Every price chart is a story about a fight between buyers and sellers, and candlestick patterns are the shorthand traders use to read that fight one bar at a time. Born in the rice markets of 18th-century Japan and popularised in the West by Steve Nison, candlestick patterns remain the most widely used visual language in forex today. This guide walks through the essential candlestick patterns every forex trader should recognise on sight — starting with how a single candle is built.

The anatomy of a candle: the body spans open-to-close, the wicks reach to the high and low.
Each candle shows four prices for its time period — open, high, low and close. The thick body is the distance between open and close; the thin wicks (or shadows) mark the extreme high and low. A green body means price closed higher than it opened; a red body means it closed lower. Every one of the candlestick patterns below is just a specific arrangement of these bodies and wicks that tends to appear at moments of hesitation or reversal.
QUICK ANSWER
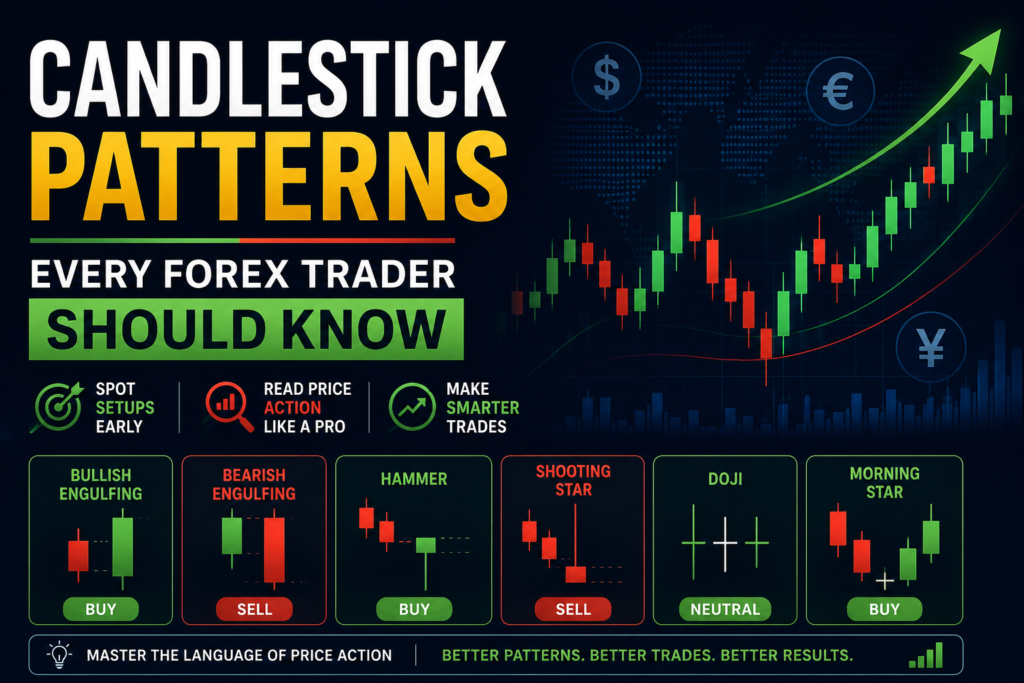
Candlestick patterns are formations of one or more candles that hint at where price may go next. The most important forex candlestick patterns are the doji (indecision), the hammer and shooting star (single-candle reversals), and the engulfing patterns (two-candle reversals) — together often summarised as the doji, engulfing, hammer family that beginners learn first.
Single-candle patterns
The simplest candlestick patterns are read from just one bar. On their own they are only clues — but at the right place on a chart, these are among the most reliable single-candle signals in forex.
Doji
INDECISION

Open and close are almost equal, leaving a tiny body with wicks on both sides. It signals a standoff — momentum is stalling. After a strong run, a doji warns the trend may be tiring.
Hammer
BULLISH REVERSAL

A small body sits at the top of a long lower wick, after a downtrend. Sellers pushed price down but buyers slammed it back up — a classic bullish reversal hint. Its bearish twin at a top is the hanging man.
Shooting Star
BEARISH REVERSAL

A small body at the bottom of a long upper wick, after an uptrend. Buyers pushed high but were rejected hard — a bearish reversal signal. Its bullish cousin at a bottom is the inverted hammer.
Two-candle patterns
Adding a second candle sharpens the message. The engulfing pair is the headline act here — one of the first forex candlestick patterns worth trading with confirmation.
Bullish Engulfing
BULLISH REVERSAL

A large green candle completely swallows the prior small red one. Buyers have overwhelmed sellers in a single session — a strong bottoming signal when it lands after a decline.
Bearish Engulfing
BEARISH REVERSAL

The mirror image: a big red candle engulfs the previous small green one at the top of a rally. Sellers have seized control — a warning that the uptrend may be ending.
Two other two-candle candlestick patterns worth knowing: the harami, where a small candle sits inside the prior large one, and tweezer tops and bottoms, where two candles share almost the same high or low. Piercing line (bullish) and dark cloud cover (bearish) are close relatives of the engulfing pair, where the second candle pushes only partway into the first.
Three-candle patterns
The three-candle candlestick patterns are among the most trusted reversal signals because they show a full shift of control — setup, turning point, and confirmation, all in sequence.
Morning Star
BULLISH REVERSAL

A big red candle, then a small indecisive “star” gapping lower, then a strong green candle closing well into the first. The bottom is in — buyers have taken over after a pause.
Evening Star
BEARISH REVERSAL

The top-of-trend mirror: a big green candle, a small star gapping higher, then a decisive red candle. The rally has exhausted itself and sellers are stepping in.
Three White Soldiers & Three Black Crows
MOMENTUM · CONFIRMATION

Three strong candles marching in the same direction confirm real momentum. Three white soldiers (rising green candles) signal sustained buying after a bottom; three black crows (falling red candles) signal sustained selling after a top. Because they need three full candles, these candlestick patterns confirm a move rather than call the exact turn.
The candlestick patterns cheat sheet
Keep this candlestick patterns cheat sheet handy while you learn to spot them live. Bias tells you the likely direction; the last column is the context that makes the signal trustworthy.
| PATTERN | CANDLES | BIAS | BEST APPEARS AT |
|---|---|---|---|
| Doji | 1 | Indecision | End of a strong move |
| Hammer | 1 | Bullish | Bottom of a downtrend |
| Hanging Man | 1 | Bearish | Top of an uptrend |
| Shooting Star | 1 | Bearish | Top of an uptrend |
| Inverted Hammer | 1 | Bullish | Bottom of a downtrend |
| Bullish Engulfing | 2 | Bullish | Support / after a decline |
| Bearish Engulfing | 2 | Bearish | Resistance / after a rally |
| Harami | 2 | Reversal watch | After an extended move |
| Tweezer Top / Bottom | 2 | Reversal | A twice-rejected level |
| Piercing / Dark Cloud | 2 | Reversal | Support / resistance |
| Morning Star | 3 | Bullish | Bottom of a downtrend |
| Evening Star | 3 | Bearish | Top of an uptrend |
| Three White Soldiers | 3 | Bullish | After a bottom (confirmation) |
| Three Black Crows | 3 | Bearish | After a top (confirmation) |
How to trade candlestick patterns without fooling yourself
Here is the honest part most guides skip: candlestick patterns are probabilities, not promises. Academic evidence on their standalone predictive power is genuinely mixed, and a hammer in isolation is close to a coin flip. What turns these forex candlestick patterns from decoration into an edge is context and discipline.
- Demand confluence. Trust a pattern far more when it lines up with a support/resistance level, a trendline, or a moving average.
- Wait for confirmation. Let the next candle or a break of the pattern’s high/low confirm the move before entering.
- Respect the trend. Reversal signals fail more often against a powerful trend; continuation signals with the trend are safer.
- Mind the timeframe. Candlestick patterns on the 4-hour and daily charts are far more meaningful than on the 1-minute, where noise dominates.
- Always define risk. Place a stop beyond the pattern and size the position so a failed signal is a small, survivable loss.
For traders in India: the same candlestick patterns apply to exchange-traded currency pairs such as USD/INR. Resident Indians should trade forex only through NSE/BSE currency derivatives via a SEBI-registered broker; trading spot forex through offshore platforms is restricted under FEMA.
Frequently asked questions
What are candlestick patterns?
Candlestick patterns are formations made by one or more price candles that suggest the likely next move. Each candle shows the open, high, low and close for its period, and their shapes hint at whether buyers or sellers are winning.
Which candlestick patterns should a beginner learn first?
Start with the doji, engulfing and hammer group. The doji shows indecision, the hammer and shooting star are single-candle reversals, and bullish and bearish engulfing are the clearest two-candle reversals.
What is the difference between a hammer and a shooting star?
A hammer has a long lower wick and appears at the bottom of a downtrend, signalling a bullish reversal. A shooting star has a long upper wick and appears at the top of an uptrend, signalling a bearish reversal.
Are forex candlestick patterns reliable?
They are useful clues, not guarantees. Evidence on their standalone accuracy is mixed, so they work best combined with support and resistance, trend context, and confirmation from the next candle.
What is a doji candle?
A doji forms when the open and close are almost equal, leaving a very small body. It signals indecision, and after a strong trend it can warn that momentum is fading.
Do candlestick patterns work on all timeframes?
They appear on every timeframe but are more reliable on higher ones. Daily and 4-hour patterns carry more weight than very short timeframes, where noise produces false signals.
What is the strongest candlestick reversal pattern?
Many traders rate the engulfing patterns and the morning/evening star among the most reliable, especially at a key level with confirmation. No single pattern is strong enough to trade on its own without context.
How do I confirm a candlestick pattern before entering?
Wait for the following candle to move in the pattern’s direction, or for price to break the pattern’s high (bullish) or low (bearish). Confirmation reduces false signals at the cost of a slightly later entry.