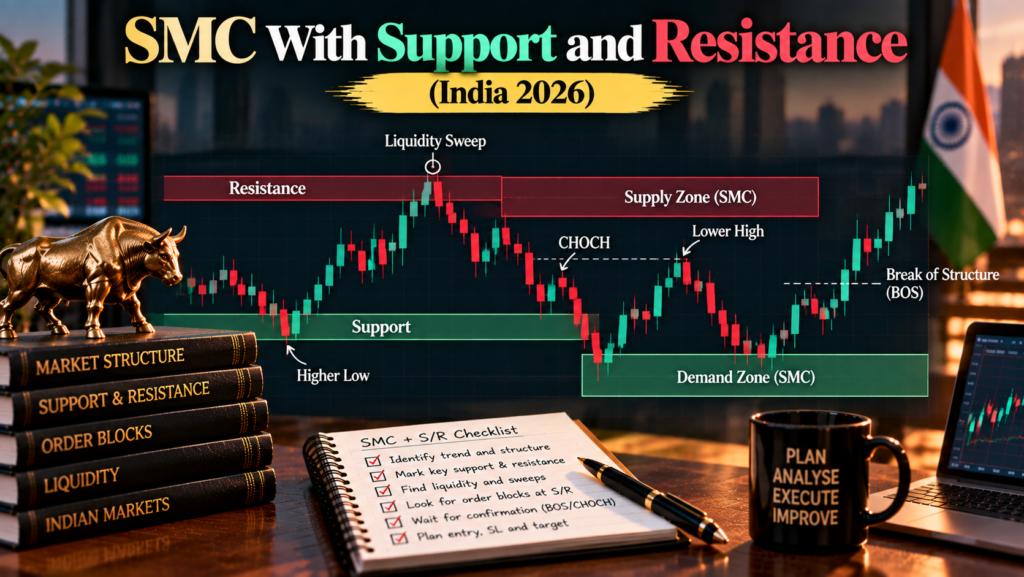
Many beginners hear that Smart Money Concepts (SMC) “replaces” support and resistance. Some SMC videos even claim classic S/R is “retail” and gets you trapped. That framing is unhelpful. SMC is largely built on the same price levels, just read differently.
Quick answer: Use classic support and resistance to find where obvious orders are likely to sit, and use SMC to decide what price is doing at that level. In SMC terms, an obvious support or resistance level is a pool of liquidity: stop-losses and breakout orders cluster just beyond it. Instead of buying the first touch of support, an SMC trader waits for price to either sweep that liquidity and reverse, or break the level with displacement and retest it, then enters with a stop beyond the structure.
In this guide you will learn:
- How classic S/R and SMC zones compare, and where they overlap
- Why S/R levels act as liquidity, with real evidence from currency-order research
- A step-by-step framework that uses both
- A worked USD/INR trade with rupee risk and lot sizing
- Common mistakes, myths, key takeaways and 17 FAQs
Important for Indian readers: Resident Indians may trade forex only in permitted currency pairs on recognised exchanges (NSE, BSE) through a SEBI-registered broker. Offshore forex apps and websites are not permitted; the RBI maintains an Alert List of unauthorised platforms. For rupee pairs, RBI rules also link participation to having an underlying exposure, so check with your broker before you trade.
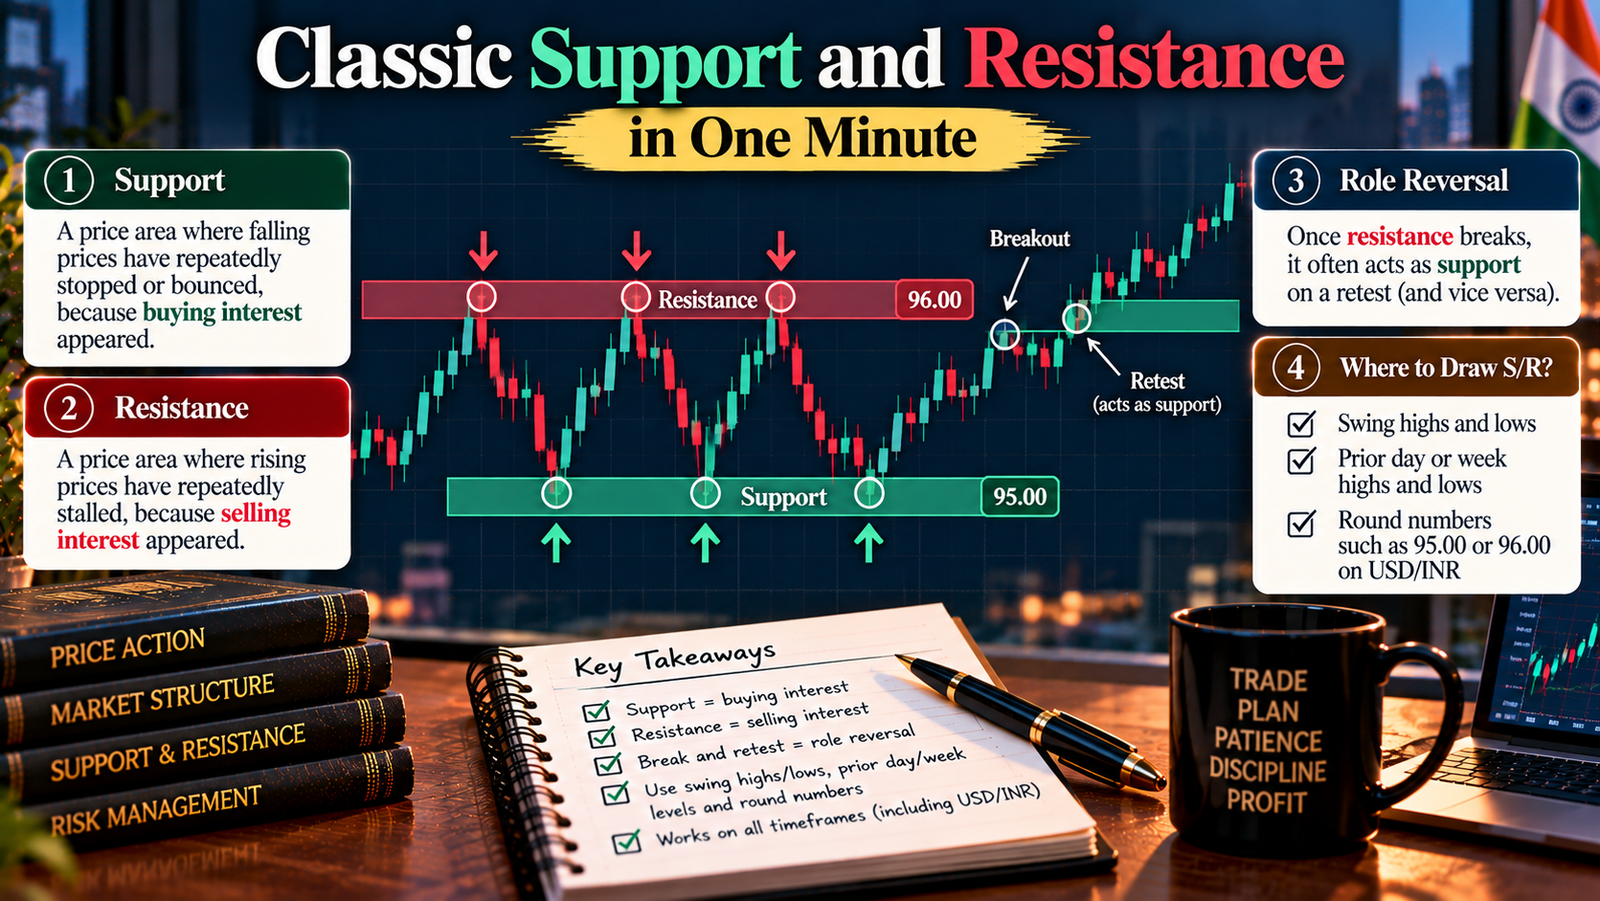
Classic Support and Resistance in One Minute
- Support is a price area where falling prices have repeatedly stopped or bounced, because buying interest appeared.
- Resistance is a price area where rising prices have repeatedly stalled, because selling interest appeared.
- Role reversal: once resistance breaks, it often acts as support on a retest (and vice versa).
- Traders usually draw S/R from swing highs and lows, prior day or week highs and lows, and round numbers such as 95.00 or 96.00 on USD/INR.
The SMC View of the Same Levels
SMC traders look at the same highs and lows, but ask a different question: whose orders are sitting there, and who benefits if they get triggered?
- Liquidity: an obvious resistance level has buy-stop orders (stop-losses of short sellers and breakout buy orders) just above it. An obvious support has sell-stop orders just below it. SMC calls these pools buy-side and sell-side liquidity.
- Liquidity sweep: price briefly pushes through the level, triggers those orders, then reverses.
- Order block: the last opposite-coloured candle before a strong move, treated as a zone where price may react on a return.
- Breaker block: an order block that failed. Price broke through it with force, and it may now act in the opposite role.
- Market structure shift (MSS): a break of the most recent swing in the opposite direction, signalling a possible change in short-term trend.
Classic S/R vs SMC Zones: Comparison Table
| Feature | Classic support/resistance | SMC approach |
|---|---|---|
| Main tool | Horizontal lines or zones at swing points | Liquidity pools, order blocks, FVGs, breakers |
| What a level means | Buyers/sellers step in here | Orders cluster just beyond here |
| Typical entry | Buy at support, sell at resistance | Wait for a sweep or a break-and-retest, then enter |
| Stop placement | Just beyond the level | Beyond the sweep wick or the structure |
| Breakouts | Trade the break, or wait for role reversal | Distinguish a sweep from a real break with displacement |
| Role reversal | Old resistance becomes support | Similar idea: breaker block or retest of a broken level |
| Objectivity | Fairly high on clean charts | Lower: more concepts, more judgment |
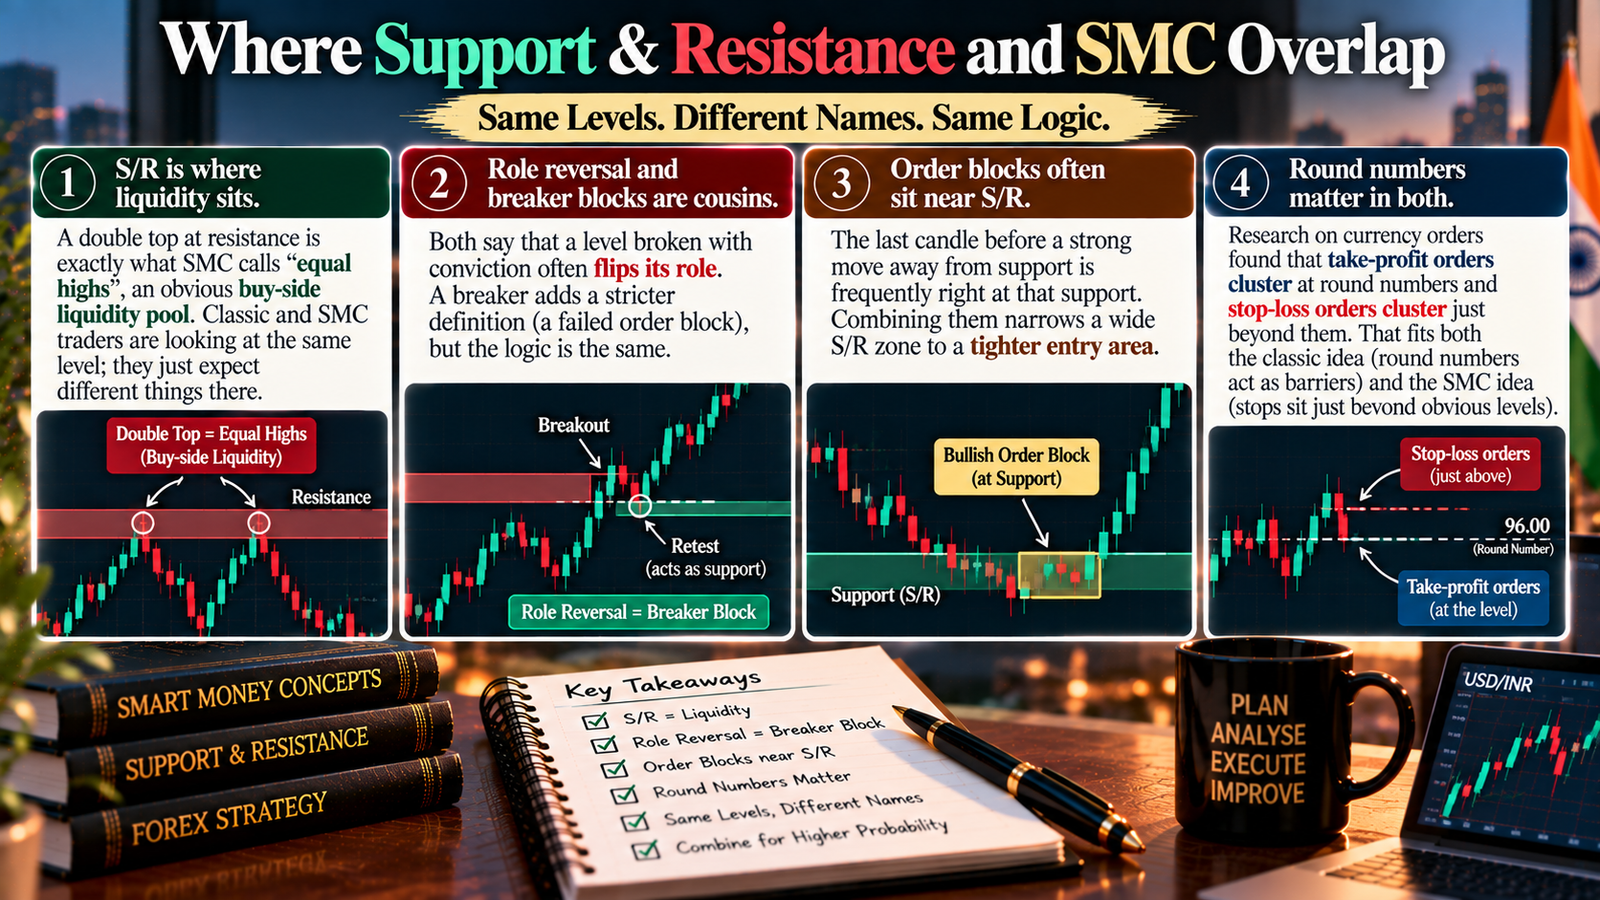
Where They Overlap
- S/R is where liquidity sits. A double top at resistance is exactly what SMC calls “equal highs”, an obvious buy-side liquidity pool. Classic and SMC traders are looking at the same level; they just expect different things there.
- Role reversal and breaker blocks are cousins. Both say that a level broken with conviction often flips its role. A breaker adds a stricter definition (a failed order block), but the logic is the same.
- Order blocks often sit near S/R. The last candle before a strong move away from support is frequently right at that support. Combining them narrows a wide S/R zone to a tighter entry area.
- Round numbers matter in both. Research on currency orders, covered below, found that take-profit orders cluster at round numbers and stop-loss orders cluster just beyond them. That fits both the classic idea (round numbers act as barriers) and the SMC idea (stops sit just beyond obvious levels).
A Simple Framework: Three Scenarios at a Level
Once you have marked a key support or resistance level, price usually does one of three things there. Your plan should cover all three before price arrives.
| Scenario at resistance | What you see | SMC-style action |
|---|---|---|
| Rejection | Price stalls below the level; no break | Classic sell only if lower-timeframe structure turns down; otherwise wait |
| Sweep and reverse | Wick above the level, close back below, then a bearish structure shift | Sell on a pullback into the order block or FVG; stop above the sweep high |
| Break and hold | Strong displacement candle closes above; retest holds as support | Buy the retest (role reversal / breaker); stop below the retest low |
The same logic applies in reverse at support.
Step-by-Step: Combining SMC With Support and Resistance
- Start on the higher timeframe. On the daily or 4H chart, mark 2–4 obvious S/R levels: major swing highs/lows, equal highs/lows, the prior week’s high and low, and nearby round numbers.
- Set your bias. Is higher-timeframe structure making higher highs (bullish) or lower lows (bearish)?
- Label each level as liquidity. Note where stops are likely: just above resistance, just below support.
- Wait for price to reach the level. Don’t trade the middle of the range.
- Drop to a lower timeframe (1H or 15m) and watch for either a sweep and market structure shift, or a displacement break and retest.
- Refine the entry to an order block or fair value gap created by that move.
- Place the stop beyond the sweep wick (reversal) or beyond the retest low/high (continuation).
- Target the next opposite liquidity: the next S/R level on the other side.
- Size the trade so the stop equals 1% or less of capital, rounding lots down.
- Journal it, noting which scenario occurred.
USD/INR Trade Example in Rupees
All prices are illustrative. On NSE, one USD/INR lot is $1,000 and the tick size is ₹0.0025, so every ₹0.01 move equals ₹10 per lot.
Setup:
- Daily resistance: 96.00, a round number with two prior swing highs at 95.98 and 96.01 (equal highs = buy-side liquidity).
- Support / target zone: 95.60, a previous 4H swing low.
- What happens: price spikes to 96.06, closes the 1H candle back at 95.94, then breaks the last 1H swing low (a bearish market structure shift). The move leaves a bearish order block at 95.95–95.99.
Trade plan:
- Capital: ₹1,00,000. Risk per trade: 1% = ₹1,000
- Entry: sell limit at 95.96 (inside the order block)
- Stop-loss: 96.08 (above the sweep high of 96.06)
- Target: 95.60 (next support)
| Item | Calculation | Result |
|---|---|---|
| Stop distance | 96.08 − 95.96 = ₹0.12 | 12 paise |
| Risk per lot | 0.12 × $1,000 | ₹120 |
| Lots | ₹1,000 ÷ ₹120 = 8.33, rounded down | 8 lots |
| Actual risk | 8 × ₹120 | ₹960 |
| Reward per lot | (95.96 − 95.60) × $1,000 | ₹360 |
| Total reward | 8 × ₹360 | ₹2,880 |
| Reward-to-risk | 2,880 ÷ 960 | 3 : 1 |
The alternative scenario: if price had instead closed a strong 4H candle above 96.06 and then held 96.00 on a retest, the plan would flip: 96.00 becomes support, and a long on the retest with a stop below the retest low is the continuation trade. Costs (brokerage, exchange fees, GST, stamp duty) reduce net results. (For JPY/INR, one lot is ¥100,000 quoted per 100 yen, so a ₹1 move equals ₹1,000 per lot.)
Confluence Checklist
- Level is obvious on the daily or 4H chart
- Trade agrees with higher-timeframe bias (or is a clear sweep against a range edge)
- Liquidity was taken (sweep) or the level broke with displacement
- Lower-timeframe market structure shift confirms
- Entry at an order block or FVG, not in mid-air
- Stop beyond structure; risk ≤ 1%
- Next opposite S/R gives at least 2R
- No major scheduled news (RBI, Fed, US CPI) within the trade window
What Does the Evidence Say?
Fact: Support and resistance has more academic backing in currency markets than most SMC ideas:
- Carol Osler (2000), in the Federal Reserve Bank of New York’s Economic Policy Review, tested support and resistance levels published by six foreign exchange firms and found they helped predict intraday trend interruptions, though predictive power varied across currencies and firms.
- Osler’s 2001 FRBNY staff report analysed 9,667 stop-loss and take-profit orders at a large dealing bank (dollar-yen, euro-dollar and dollar-pound, September 1999 to April 2000). Take-profit orders clustered at round numbers, while stop-loss buy orders clustered just above round numbers and stop-loss sell orders just below. Osler noted that “take-profit orders should tend to reflect or reverse existing price trends, while stop-loss orders should tend to propagate or intensify them.”
Fact: We did not find peer-reviewed studies testing SMC-specific tools such as order blocks, breaker blocks or liquidity sweeps.
Analysis: Osler’s findings support two ideas that both methods share: obvious levels (especially round numbers) can slow or reverse price, and once they break, clustered stops can accelerate the move. That gives a sound reason to watch S/R levels closely. It does not prove that any particular SMC entry pattern is profitable, and the data is from major pairs over two decades ago, not USD/INR today.
Expert Analysis: Fact, Analysis and Opinion
Fact: Classic support and resistance, and the clustering of orders around round numbers, have been studied in currency markets by Federal Reserve Bank of New York research. SMC-specific tools (order blocks, breakers, liquidity sweeps) come from practitioner education and have no peer-reviewed tests we could find.
Analysis: SMC and S/R are not rival systems. S/R answers where to pay attention; SMC offers a vocabulary for how price behaves there (sweep, break, retest). The main value of combining them is patience: instead of buying the first touch of support, you wait for evidence of either rejection after a sweep or acceptance after a break. The cost is complexity. More concepts mean more chances to find a reason for any trade in hindsight.
Opinion: For a beginner, keep it lean. Draw only the obvious daily and 4H levels, add one SMC confirmation (a lower-timeframe market structure shift), and enter at one refinement tool (order block or FVG, not both). Track the three scenarios (rejection, sweep-and-reverse, break-and-hold) in your journal to see which one you read well.
Common Mistakes Beginners Make
- Drawing too many levels. If every candle has a line, none of them mean anything.
- Buying support blindly. The first touch is often where stops get swept.
- Putting stops exactly at obvious levels. That is where liquidity sits; place stops beyond the structure that invalidates the idea.
- Calling every wick a sweep. Wait for a close back inside and a structure shift.
- Ignoring the higher-timeframe trend when fading a level.
- Treating SMC as “better” and discarding S/R. The levels are the same; only the interpretation differs.
- Oversizing tight setups. Keep risk at 1% or less and round lots down.
- Using offshore apps to trade SMC setups on unpermitted pairs. For resident Indians, stick to exchange-traded pairs via a SEBI-registered broker.
Myths vs Facts
| Myth | Fact |
|---|---|
| SMC replaces support and resistance | SMC reinterprets the same levels as liquidity |
| Support and resistance is “retail” and doesn’t work | FRBNY research found published S/R levels helped predict intraday trend interruptions in major currencies |
| Every break of support is a stop hunt | Some breaks are real and continue; displacement and retests help tell them apart |
| Round numbers are meaningless | Research found take-profit orders cluster at round numbers and stop-losses just beyond them |
| Order blocks are proven institutional footprints | No peer-reviewed tests of order blocks were found |
| More confluence always means a better trade | Too many conditions leads to hindsight bias and missed trades |
Key Takeaways
- Support and resistance tells you where to watch; SMC helps you judge what price is doing there.
- In SMC terms, obvious S/R levels are liquidity pools: stops sit just beyond them.
- Plan for three scenarios at every level: rejection, sweep-and-reverse, or break-and-hold.
- Role reversal and breaker blocks share the same logic: a level broken with conviction can flip its role.
- Research on currency orders supports the idea that round-number levels slow price and that breaks can accelerate.
- Size every trade to 1% risk, rounding lots down; in the example, 8 lots risked ₹960 for a 3 : 1 target.
- In India, trade only permitted pairs on NSE/BSE through a SEBI-registered broker.
Frequently Asked Questions (FAQs)
- Can you combine SMC with support and resistance?
Yes. Support and resistance shows where obvious orders are likely to sit, and SMC helps you judge whether price is sweeping that liquidity and reversing or breaking the level and continuing.
- Is support and resistance the same as liquidity in SMC?
Closely related. An obvious support or resistance level usually has stop-loss and breakout orders just beyond it, which SMC calls sell-side or buy-side liquidity.
- What is the difference between support/resistance and an order block?
Support and resistance is a horizontal level where price has reacted before. An order block is a specific candle, the last opposite candle before a strong move, often used to refine an entry near that level.
- Is a breaker block the same as role reversal?
They share the same logic: a level broken with conviction may flip its role. A breaker block uses a stricter definition based on a failed order block.
- Does support and resistance still work in forex?
Federal Reserve Bank of New York research by Carol Osler found published support and resistance levels helped predict intraday trend interruptions in major currencies, though the effect varied by currency and firm.
- Why do stop-losses cluster just beyond round numbers?
Osler’s analysis of bank order data found stop-loss buy orders clustered just above round numbers and stop-loss sell orders just below them, while take-profit orders clustered at the round numbers themselves.
- How do I tell a liquidity sweep from a real breakout?
A sweep usually wicks through the level and closes back inside, followed by a structure shift the other way. A real breakout closes beyond the level with a strong candle and holds on the retest.
- Which timeframe should I use to draw support and resistance?
Most beginners draw levels on the daily and 4H charts, then use the 1H or 15-minute chart to time entries.
- How many support and resistance levels should I draw?
Keep it to the two to four most obvious levels near current price. Too many lines make every move look significant.
- Where should I place my stop-loss in an SMC support and resistance trade?
Beyond the structure that proves you wrong: above the sweep high for a short after a sweep, or below the retest low for a long after a breakout.
- Should I buy at support right away?
Not in an SMC approach. Waiting for a sweep and structure shift, or for a break-and-retest, gives more evidence than buying the first touch.
- Are round numbers important in USD/INR?
Round figures such as 95.00 or 96.00 are widely watched and often act as reference levels. Research on major currency pairs found order clustering at round numbers, but those studies did not cover USD/INR.
- Is SMC backed by research?
We found no peer-reviewed tests of SMC-specific tools such as order blocks, breaker blocks or liquidity sweeps. Support and resistance and order clustering have some academic backing in currency markets.
- Can I trade SMC with support and resistance on USD/INR in India?
You can apply the approach to exchange-traded currency futures and options on permitted pairs such as USD/INR on NSE or BSE through a SEBI-registered broker. RBI rules link rupee-pair participation to underlying exposure, so check with your broker.
- How many lots should I trade?
Divide your rupee risk by the risk per lot and round down. In the example, a 12-paise stop costs ₹120 per lot, so ₹1,000 of risk allows 8 lots.
- Is it legal to trade SMC setups on offshore forex apps from India?
Resident Indians are not permitted to trade forex on unauthorised offshore platforms. The RBI publishes an Alert List of such entities. Use only recognised Indian exchanges.
- What is the best way for a beginner to start combining SMC and S/R?
Draw only obvious daily and 4H levels, add one confirmation such as a lower-timeframe structure shift, use one entry tool, risk 1% or less and journal which scenario played out.