If you have watched a few Smart Money Concepts (SMC) or ICT videos, you have probably heard “imbalance” and “fair value gap” used as if they mean the same thing. Sometimes they do. Often they don’t. For a beginner in India trading USD/INR or other permitted currency pairs, that confusion leads to boxes drawn in the wrong place, stops set at random and trades taken on patterns that don’t actually exist.
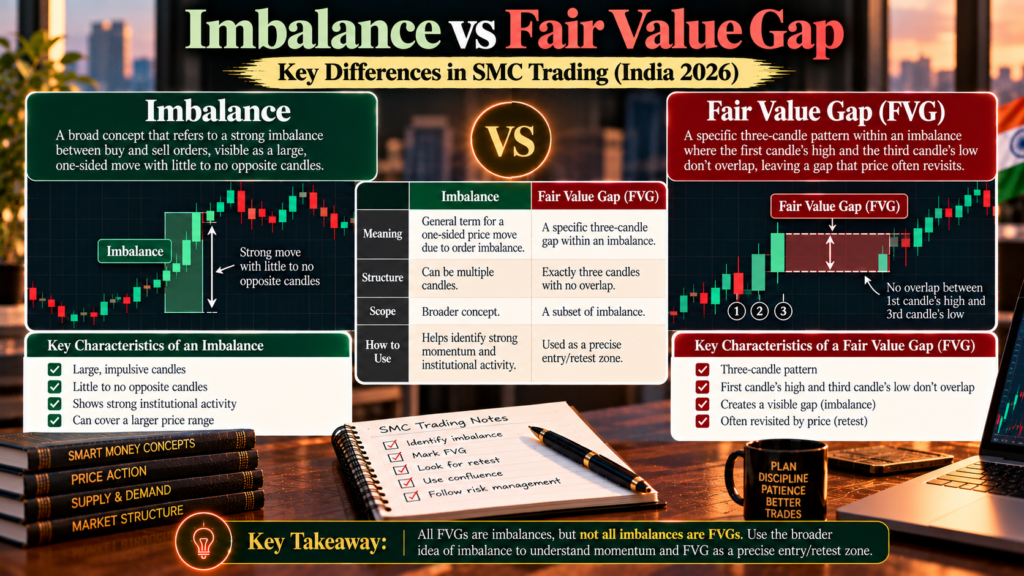
Quick answer: “Imbalance” is the broad idea: price moved so fast in one direction that one side of the market (buyers or sellers) barely got to trade. A fair value gap (FVG) is one specific, measurable way of spotting an imbalance: a three-candle pattern where the wicks of candle 1 and candle 3 do not overlap, leaving a gap beside candle 2. Every FVG is an imbalance, but not every imbalance is an FVG.
In this guide you will learn:
- What each term means and where it comes from
- The related terms you will meet: BISI, SIBI, volume imbalance and liquidity void
- How to mark each one on a chart with worked USD/INR prices
- How traders use them, what “consequent encroachment” means, and a trade example in rupees
- What the evidence does (and doesn’t) say, plus mistakes, myths and 17 FAQs
Important for Indian readers: Resident Indians may trade forex only in permitted currency pairs on recognised exchanges (NSE, BSE) through a SEBI-registered broker. Offshore forex apps and websites are not permitted; the RBI maintains an Alert List of unauthorised platforms. For rupee pairs, RBI rules also link participation to having an underlying exposure, so check with your broker before you trade.
What Is an Imbalance in Trading?
In SMC and ICT teaching, an imbalance describes a price area where one side dominated so heavily that the other side got little or no chance to trade. Price “skipped” through the zone quickly. The idea is that such zones are inefficient, and price may later return to trade through them.
Imbalance is a concept, not a single pattern. Different educators recognise it in several shapes:
- A three-candle gap (the fair value gap)
- A gap between two candle bodies whose wicks still overlap (volume imbalance)
- A long run of large one-directional candles with little overlap (often called a liquidity void)
- A true price gap between one candle’s close and the next candle’s open (common in stocks after a weekend, rarer in near-24-hour markets)
This is why the words get mixed up. Many traders say “imbalance” when they mean “FVG”, and in casual use that is fine. The problem starts when you need a rule for where to draw the box.
What Is a Fair Value Gap (FVG)?
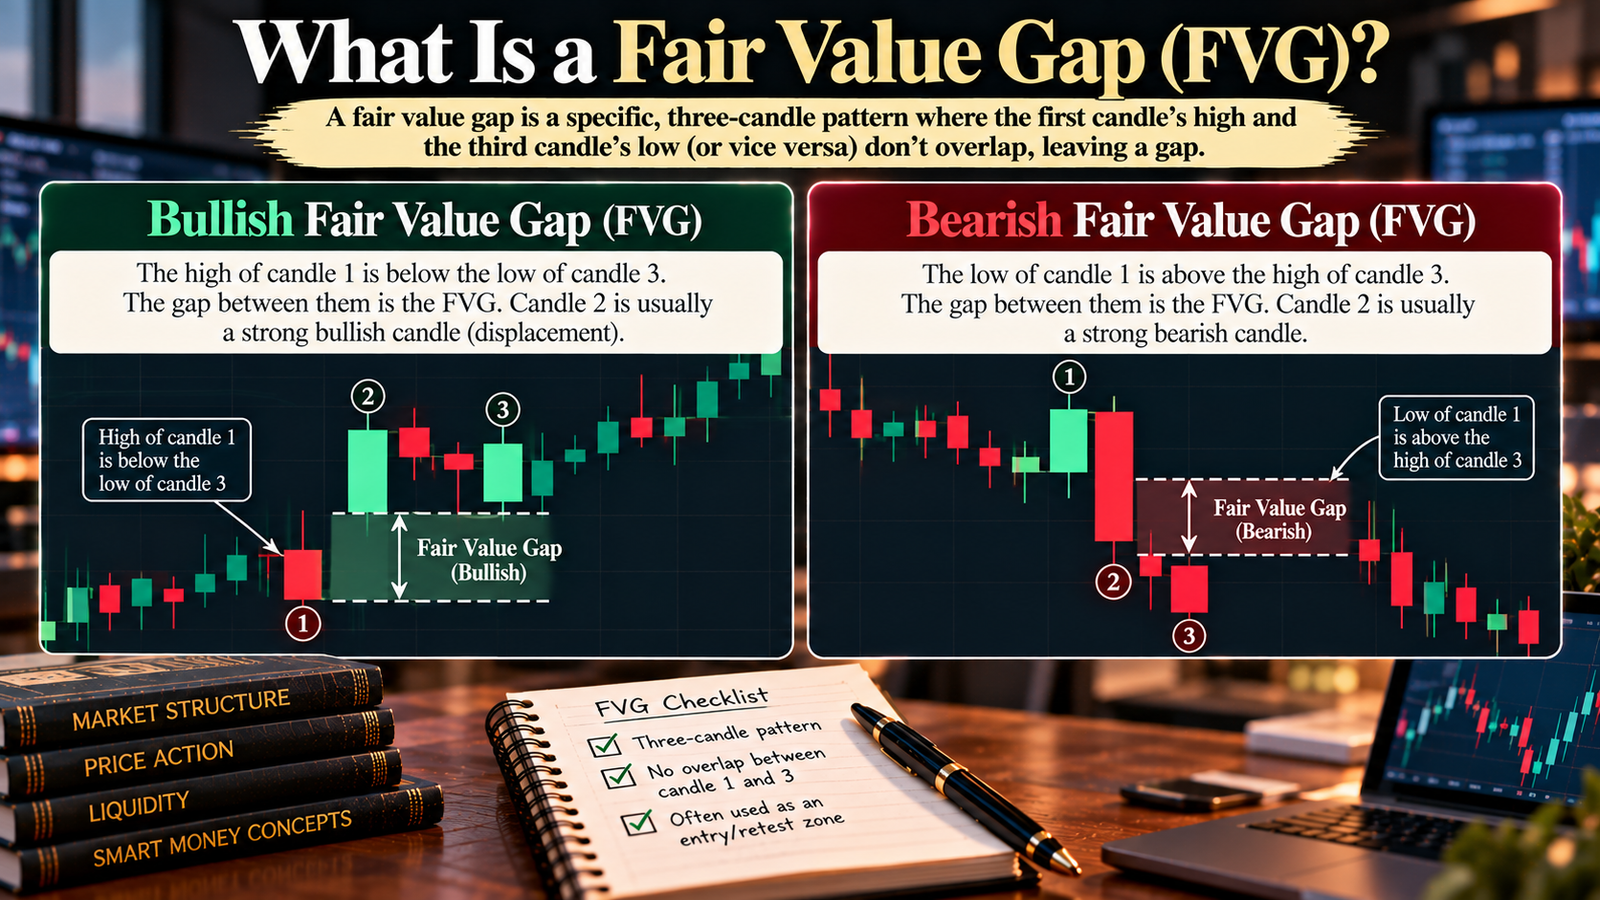
A fair value gap is a precise, three-candle pattern:
- Bullish FVG: the high of candle 1 is below the low of candle 3. The gap between them is the FVG. Candle 2 is usually a strong bullish candle (displacement).
- Bearish FVG: the low of candle 1 is above the high of candle 3. The gap between them is the FVG. Candle 2 is usually a strong bearish candle.
In ICT terminology these have their own names:
- BISI (buy-side imbalance, sell-side inefficiency) = a bullish FVG. Buyers dominated; sellers were under-represented.
- SIBI (sell-side imbalance, buy-side inefficiency) = a bearish FVG. Sellers dominated; buyers were under-represented.
The ICT education site innercircletrader.net defines BISI as the gap between candle 1’s high and candle 3’s low, and SIBI as the gap between candle 1’s low and candle 3’s high, which matches the FVG definitions above.
Related Terms You Will Meet
Volume imbalance. Two consecutive candles whose bodies do not touch, but whose wicks do overlap. In the bullish form, candle 2 opens above candle 1’s close, yet its low dips back to or below candle 1’s high. The zone runs from candle 1’s close to candle 2’s open (Hadal Instruments glossary). It is smaller and uses only two candles.
Liquidity void. A practitioner term for a large area traversed by several big, one-directional candles with little overlap between them. It is essentially a large imbalance spanning many candles, sometimes containing several FVGs.
Consequent encroachment (CE). The 50% midpoint of an FVG. Many ICT-style traders watch this level as a reference within the gap. It is a practitioner convention, not a tested rule.
Inverse FVG (IFVG). When price closes straight through an FVG instead of respecting it, some traders then treat the old gap as a zone of opposite polarity (a failed bullish FVG becomes potential resistance). Again, a convention rather than an established finding.
Imbalance vs FVG vs Volume Imbalance: Comparison Table
| Feature | Imbalance (broad) | Fair value gap (FVG) | Volume imbalance | Liquidity void |
|---|---|---|---|---|
| What it is | General concept of one-sided price movement | Specific 3-candle pattern | Specific 2-candle pattern | Large multi-candle one-sided area |
| Candles needed | Any | 3 | 2 | Many |
| Where the zone sits | Varies by pattern | Candle 1 wick to candle 3 wick | Candle 1 body to candle 2 body | Start to end of the fast move |
| Wicks overlap? | Varies | No (that is the gap) | Yes | Little or none |
| Typical size | Varies | Small to medium | Very small | Large |
| ICT names | Imbalance / inefficiency | BISI (bullish), SIBI (bearish) | Volume imbalance | Liquidity void |
| Precision for beginners | Low (too vague) | High (clear rule) | Medium (easy to miss) | Low (subjective edges) |
How to Mark Each One: Worked USD/INR Prices
The prices below are illustrative, on a 4-hour USD/INR futures chart. On NSE, one USD/INR lot is $1,000 and the tick size is ₹0.0025, so every ₹0.01 move equals ₹10 per lot.
Example 1: Bullish FVG (BISI)
| Candle | Open | High | Low | Close |
|---|---|---|---|---|
| Candle 1 | 95.20 | 95.24 | 95.17 | 95.22 |
| Candle 2 (displacement) | 95.22 | 95.44 | 95.21 | 95.42 |
| Candle 3 | 95.42 | 95.46 | 95.34 | 95.44 |
- Candle 1 high = 95.24; candle 3 low = 95.34. They do not overlap, so an FVG exists.
- FVG zone: 95.24 to 95.34 (10 paise wide, worth ₹100 per lot).
- Consequent encroachment (50%): 95.29.
Example 2: Bearish FVG (SIBI)
- Candle 1 low = 95.60; candle 3 high = 95.52.
- FVG zone: 95.52 to 95.60. CE = 95.56.
Example 3: Bullish volume imbalance
- Candle A closes at 95.40. Candle B opens at 95.43, and its low is 95.39.
- The bodies don’t touch (95.40 vs 95.43), but B’s low (95.39) reaches back below A’s close, so the wicks overlap. No FVG, but a volume imbalance from 95.40 to 95.43.
Example 4: Liquidity void
- Four large bullish 4H candles carry price from 95.20 to 95.70 with barely any overlap. The whole 95.20–95.70 area is a liquidity void, and the FVG from Example 1 sits inside it.
The lesson: “imbalance” can describe any of these four, but only Example 1 and Example 2 are fair value gaps.
How Traders Use Imbalances and FVGs
SMC traders generally use these zones in three ways. Treat each as a hypothesis to test, not a rule.
| Behaviour | What happens | How practitioners read it |
|---|---|---|
| Full fill | Price returns and trades through the entire gap | Inefficiency “rebalanced”; the zone is often considered spent |
| Partial fill | Price taps into the gap (often near the 50% CE) and reverses | Zone “respected”; seen as support (bullish) or resistance (bearish) |
| Inversion | Price closes decisively through the gap | Original idea failed; some traders then flip the zone’s role (inverse FVG) |
Which one should a beginner prioritise? The fair value gap. It has a clear, objective definition you can mark the same way every time, which makes journaling and back-testing possible. “Imbalance” as a loose idea is too vague to test. Volume imbalances are tiny and easy to over-mark on low timeframes. Liquidity voids have subjective edges.
A filter many educators add: an FVG is more meaningful when candle 2 is a genuine displacement candle (large body, above-average range) and when the FVG agrees with your higher-timeframe bias. An FVG in the middle of a choppy range is common and usually meaningless.
USD/INR Trade Example in Rupees
Using Example 1’s bullish FVG (95.24–95.34) on a USD/INR futures 4H chart, all numbers illustrative:
- Capital: ₹1,00,000. Risk per trade: 1% = ₹1,000
- Entry: buy limit at the CE, 95.29
- Stop-loss: 95.16 (just below candle 1’s low of 95.17, the level that would invalidate the FVG idea)
- Target: 95.60 (an earlier swing high where buy stops may sit)
| Item | Calculation | Result |
|---|---|---|
| Stop distance | 95.29 − 95.16 = ₹0.13 | 13 paise |
| Risk per lot | 0.13 × $1,000 | ₹130 |
| Lots | ₹1,000 ÷ ₹130 = 7.69, rounded down | 7 lots |
| Actual risk | 7 × ₹130 | ₹910 |
| Reward per lot | (95.60 − 95.29) × $1,000 | ₹310 |
| Total reward | 7 × ₹310 | ₹2,170 |
| Reward-to-risk | 2,170 ÷ 910 | about 2.4 : 1 |
If price never returns to 95.29, there is no trade; that is normal. If it closes below 95.16, the FVG failed, and you take the planned ₹910 loss. Brokerage, exchange fees, GST and stamp duty will reduce the net result slightly. (If you trade JPY/INR instead, remember one lot is ¥100,000 quoted per 100 yen, so a ₹1 move equals ₹1,000 per lot.)
What Does the Evidence Say?
Fact: We did not find peer-reviewed studies testing whether fair value gaps, imbalances or volume imbalances predict future price moves in forex or USD/INR. The definitions come from practitioner education (ICT and related communities), not academic research.

Related research (context only):
- A 2022 study by Tsinaslanidis and colleagues in Expert Systems with Applications tested Fibonacci-based retracement zones across markets and found limited evidence that the levels had special significance. It does not test FVGs, but it is a caution about zone-based ideas.
- Moskowitz, Ooi and Pedersen (2012) documented time-series momentum across futures, including currencies: past 12-month returns tended to continue. This supports the broad idea that strong moves can carry information, but it says nothing about gaps being “filled”.
Analysis: A fast move leaving an FVG is often just a sign of momentum or news. Price revisiting that area may happen simply because markets oscillate, not because the gap “must” fill. Without your own tested sample, treat FVGs as a structured way to locate entries, not as proof of an edge.
Step-by-Step: Marking and Trading an FVG
- Set the higher-timeframe bias (daily or 4H): are you looking for longs or shorts?
- Find displacement: a large-bodied candle moving in the direction of your bias.
- Check the three-candle rule: do candle 1’s and candle 3’s wicks leave a gap? If they overlap, it’s not an FVG (check for a volume imbalance instead).
- Draw the box from candle 1’s wick to candle 3’s wick and mark the 50% CE.
- Plan the trade before price returns: entry (edge or CE), stop beyond candle 1’s extreme, target at a logical liquidity level.
- Size the position so the stop-loss equals 1% (or less) of capital, rounding lots down.
- Wait. If price closes through the gap, cancel or accept the stop; don’t move it.
- Journal the result, including FVGs you skipped, so you build your own evidence.
Expert Analysis: Fact, Analysis and Opinion
Fact: “Fair value gap”, “BISI”, “SIBI”, “volume imbalance” and “liquidity void” are terms from practitioner education (chiefly ICT and the wider SMC community). Their definitions are consistent across major ICT education sites for FVG and BISI/SIBI; terms such as liquidity void and inverse FVG vary more between educators. No peer-reviewed tests of these patterns were found.
Analysis: The value of the FVG definition is its precision. Three candles, non-overlapping wicks: two traders looking at the same chart will draw the same box. “Imbalance” in its broad sense lacks that precision, which makes it easy to see one everywhere after the fact. On liquid 4H and daily USD/INR charts, FVGs appear often, so the pattern alone is not selective. Context (higher-timeframe bias, a real displacement candle, a nearby liquidity target) is what practitioners use to filter them.
Opinion: For a beginner, use “imbalance” as the idea and “FVG” as the tool. Mark only FVGs on your main timeframe for the first few months, journal every one (taken or not), and only add volume imbalances or inverse FVGs once you can show from your own records that the basic version helps you.
Common Mistakes Beginners Make
- Treating every gap as an FVG. If candle 1’s and candle 3’s wicks overlap, there is no FVG.
- Drawing the box body-to-body. An FVG is wick-to-wick; body-to-body gaps are volume imbalances.
- Marking FVGs on every timeframe. A 1-minute chart produces dozens a day; most mean nothing.
- Ignoring the trend. Buying a bullish FVG against a bearish higher-timeframe bias.
- Assuming gaps must fill. Some never do, especially after major news.
- Placing the stop inside the gap. The idea is invalidated beyond candle 1’s extreme, not in the middle.
- Oversizing because the zone is “high probability”. Keep risk at 1% or less.
- Using offshore apps to trade FVG setups on pairs like EUR/USD CFDs. For resident Indians these are not permitted; stick to exchange-traded pairs via a SEBI-registered broker.
Myths vs Facts
| Myth | Fact |
|---|---|
| Imbalance and FVG are exactly the same thing | FVG is one specific pattern; imbalance is the broader idea |
| Every FVG gets filled | Many are only partly filled or never revisited |
| The 50% level (CE) is where price always reacts | CE is a practitioner reference, not a proven level |
| FVGs are how banks leave footprints | That is a narrative; no public evidence links FVGs to specific institutions’ orders |
| Bigger gaps are always stronger | Large gaps often follow news and can extend further before any retracement |
| FVG trading is proven by research | No peer-reviewed tests were found |
Key Takeaways
- Imbalance is a broad concept; a fair value gap is a precise three-candle pattern for spotting one.
- BISI = bullish FVG; SIBI = bearish FVG.
- A volume imbalance is a two-candle body gap with overlapping wicks; a liquidity void is a large multi-candle imbalance.
- Mark FVGs wick-to-wick; the 50% midpoint is called consequent encroachment.
- Put your stop beyond candle 1’s extreme and size to 1% risk, rounding lots down.
- Evidence is practitioner-based only; build your own journal data before trusting the pattern.
- In India, trade only permitted pairs on NSE/BSE through a SEBI-registered broker.
Frequently Asked Questions (FAQs)
- What is the difference between imbalance and a fair value gap?
Imbalance is the broad idea that price moved so fast one side barely traded. A fair value gap is a specific three-candle pattern where candle 1’s and candle 3’s wicks do not overlap. Every FVG is an imbalance, but not every imbalance is an FVG.
- Is an imbalance the same as an FVG?
In casual use many traders treat them as the same. Strictly, FVG is one type of imbalance; volume imbalances and liquidity voids are others.
- How do I identify a bullish fair value gap?
Look at three consecutive candles. If candle 1’s high is below candle 3’s low, the space between them is a bullish FVG. Candle 2 is usually a strong bullish candle.
- How do I identify a bearish fair value gap?
If candle 1’s low is above candle 3’s high, the space between them is a bearish FVG, usually created by a strong bearish middle candle.
- What do BISI and SIBI mean?
BISI stands for buy-side imbalance, sell-side inefficiency and is a bullish FVG. SIBI stands for sell-side imbalance, buy-side inefficiency and is a bearish FVG. Both are ICT terms.
- What is a volume imbalance?
A two-candle pattern where the candle bodies do not touch but the wicks overlap. The zone runs from the first candle’s close to the second candle’s open.
- What is a liquidity void?
A practitioner term for a large area crossed by several big one-directional candles with little overlap. It is a large imbalance that can contain several FVGs.
- What is consequent encroachment?
The 50% midpoint of a fair value gap. Many ICT-style traders use it as a reference entry level. It is a convention, not a tested rule.
- What is an inverse fair value gap?
When price closes through an FVG instead of respecting it, some traders treat the old gap as a zone of opposite role, for example a failed bullish FVG becoming resistance.
- Do fair value gaps always get filled?
No. Some are fully filled, some only partly, and some are never revisited, especially after big news moves.
- Which timeframe is best for fair value gaps?
Beginners usually find 4-hour and daily charts easier because they produce fewer, clearer FVGs than very low timeframes. Test any timeframe in your own journal first.
- Where should I put my stop-loss on an FVG trade?
Practitioners typically place it just beyond candle 1’s extreme: below its low for a bullish FVG, above its high for a bearish one. Size the position so that stop equals 1% or less of capital.
- Are fair value gaps backed by research?
We did not find peer-reviewed studies testing FVGs or imbalances. The definitions come from practitioner education, so treat them as a framework to test, not a proven edge.
- Can I trade FVGs on USD/INR in India?
You can apply the concept to exchange-traded currency futures and options on permitted pairs such as USD/INR on NSE or BSE through a SEBI-registered broker. RBI rules link rupee-pair participation to underlying exposure, so check with your broker.
- How much is a 10 paise FVG worth on USD/INR?
One NSE USD/INR lot is $1,000, so each 1 paisa is worth ₹10 per lot. A 10-paise-wide FVG therefore spans ₹100 per lot.
- Is it legal to trade FVG setups on offshore forex apps from India?
Resident Indians are not permitted to trade forex on unauthorised offshore platforms. The RBI publishes an Alert List of such entities. Use only recognised Indian exchanges.
- Should beginners use imbalance or FVG in their trading plan?
Use FVG. Its precise definition lets you mark it the same way every time and journal results, while the broad imbalance idea is too vague to test.