Introduction
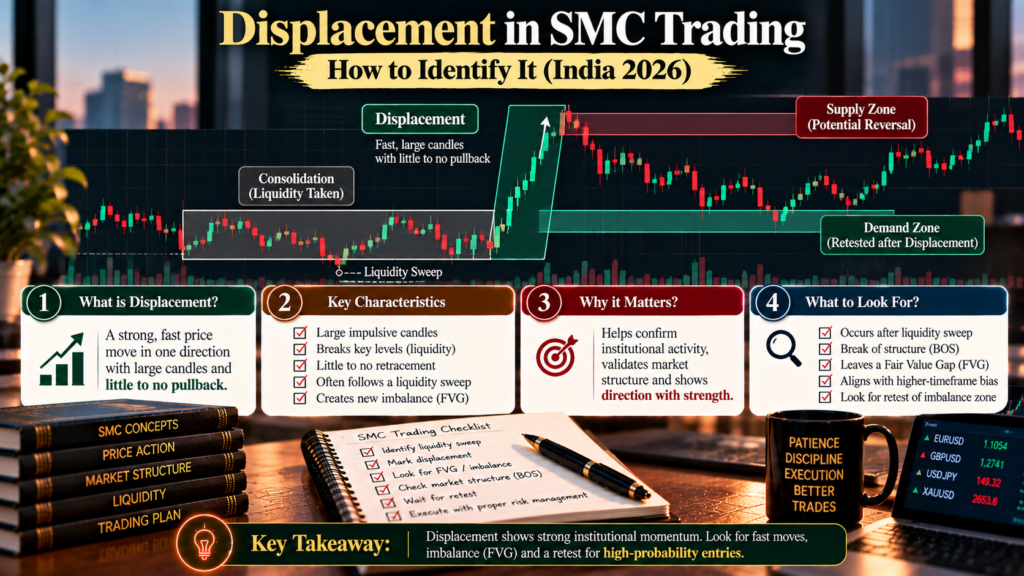
In SMC and ICT content you’ll often hear “wait for displacement” before trusting a break of structure or an order block. Displacement describes a strong, one-directional burst of price: big-bodied candles that move quickly away from a level and leave gaps behind. It’s the market’s way of showing that one side is clearly in control. Learning to recognise displacement forex trading setups, and to measure them rather than guess, helps you separate meaningful moves from ordinary noise.
Quick answer: Displacement is a sharp, energetic price move made of one or more large, full-bodied candles that travel well beyond recent average movement, usually breaking structure and leaving a fair value gap (FVG). A practical way to measure it is to compare the candle’s range with ATR (for example, at least 2× ATR) and check that the body makes up most of the candle (for example, 70% or more). SMC traders use displacement to confirm a break of structure, then look to enter on a retrace into the FVG or order block it created, with a stop beyond the origin of the move.
Why this matters
- Displacement gives weight to other SMC concepts. A break of structure without displacement is often treated as weak or suspect.
- It creates the fair value gaps and order blocks many SMC entries are built on.
- Indian traders can apply the concept to permitted pairs such as USD/INR futures on NSE or BSE, through a SEBI-registered broker. Many examples online use offshore pairs and platforms that aren’t permitted for residents.
What is displacement?
In SMC and ICT teaching, displacement is an aggressive move away from a price level, usually after a liquidity sweep, that shows strong buying or selling pressure. It typically:
- Consists of one or more large-bodied candles with small wicks.
- Moves well beyond recent average candle size.
- Breaks market structure (a break of structure or change of character).
- Leaves an imbalance, often a fair value gap, because price moved too fast for normal two-way trading.
Measuring displacement objectively
“Big candle” is subjective. Two simple measurements make it testable:
| Measure | Formula | Common threshold (convention) |
|---|---|---|
| Range vs ATR | Candle high − low ÷ ATR (same timeframe) | 2× ATR or more |
| Body percentage | |Close − open| ÷ (high − low) | 70% or more |
| Structure | Does the move close beyond a prior swing? | Yes |
| Imbalance | Does it leave a fair value gap? | Usually yes |
These thresholds are practical conventions, not official SMC rules. Choose your own, write them down, and apply them consistently.
Worked example: displacement vs a normal candle (illustrative)
USD/INR futures, 4-hour chart, with ATR(14) of ₹0.08.
| Displacement candle | Normal candle | |
|---|---|---|
| Open / high / low / close | 95.20 / 95.46 / 95.18 / 95.44 | 95.20 / 95.27 / 95.17 / 95.23 |
| Range | ₹0.28 | ₹0.10 |
| Range ÷ ATR | 3.5× | 1.25× |
| Body | ₹0.24 | ₹0.03 |
| Body % of range | 86% | 30% |
| Verdict | Displacement | Normal movement |
Calculated in code; prices are illustrative.
Displacement vs a normal move
| Displacement | Normal move | |
|---|---|---|
| Candle size | Well above ATR | Around or below ATR |
| Candle shape | Large bodies, small wicks | Mixed bodies and wicks |
| Speed | Covers distance in few candles | Gradual, overlapping candles |
| Structure | Breaks a swing decisively | Often stays inside the range |
| Leaves behind | FVG, clear order block | Little or no imbalance |
What displacement leaves behind
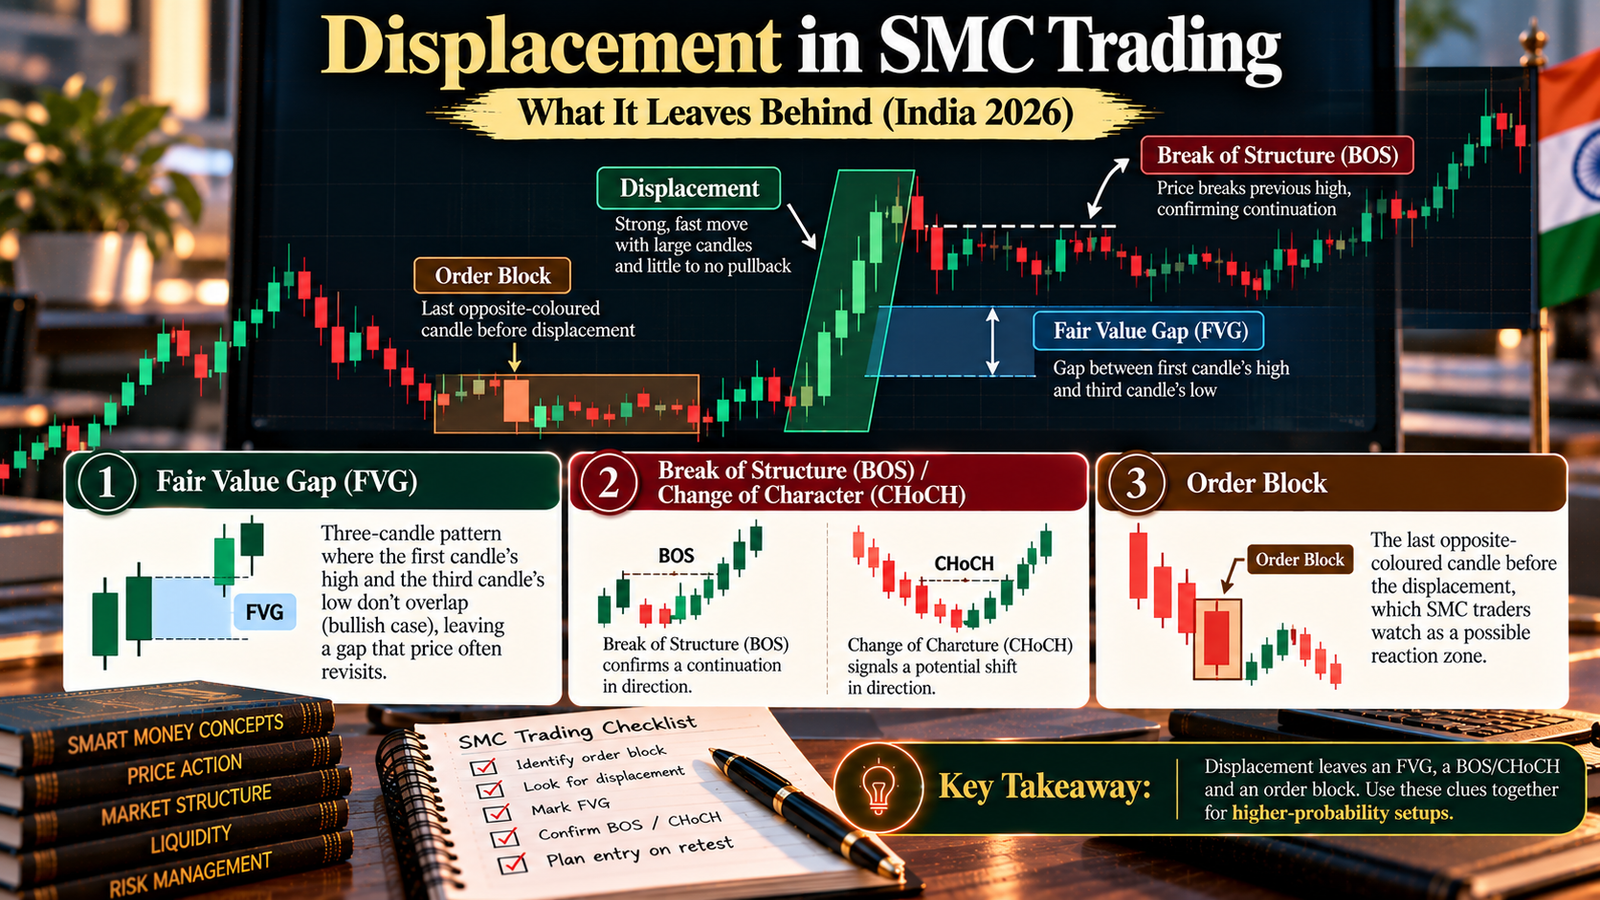
- Fair value gap (FVG): a three-candle pattern where the first candle’s high and the third candle’s low don’t overlap (bullish case), leaving a gap that price often revisits.
- Break of structure (BOS) or change of character (CHoCH): confirms a shift or continuation in direction.
- Order block: the last opposite-coloured candle before the displacement, which SMC traders watch as a possible reaction zone.
How to trade after displacement
Most SMC traders don’t chase the displacement candle itself. Instead they use a sequence:
- Liquidity sweep: price takes out an obvious low (for longs) or high (for shorts), triggering stops.
- Displacement: a strong move in the opposite direction breaks structure and leaves an FVG.
- Retrace: price pulls back into the FVG or order block created by the displacement.
- Entry: on the retrace, ideally aligned with higher-timeframe bias and in discount (longs) or premium (shorts).
- Stop: beyond the origin of the displacement, usually the sweep low or high.
- Target: the next obvious liquidity, such as a prior high or low.
Worked example: USD/INR futures (illustrative)
Daily bias is bullish. On the 4-hour chart, price sweeps a minor low at 95.15, dips to 95.12, then prints the displacement candle from the previous section (95.20 → 95.44, 3.5× ATR), breaking a 4H swing high. It leaves an FVG between the first candle’s high at 95.24 and the third candle’s low at 95.34.
NSE USD/INR: one lot = $1,000, so a ₹0.01 move = ₹10 per lot.
| Item | Value |
|---|---|
| FVG zone | 95.24–95.34 (midpoint 95.29) |
| Entry (buy limit at FVG midpoint) | 95.29 |
| Stop-loss (below the sweep low, with buffer) | 95.10 |
| Target (prior 4H high / liquidity) | 95.70 |
| Risk per lot | (95.29 − 95.10) × 1,000 = ₹190 |
| Potential reward per lot | (95.70 − 95.29) × 1,000 = ₹410 |
| Reward-to-risk | About 2.2 : 1 |
| Capital and risk | ₹1,00,000 at 1% = ₹1,000 |
| Position size | ₹1,000 ÷ ₹190 = 5.3, round down to 5 lots (risk ₹950; potential reward ₹2,050) |
Calculated in code; before brokerage, charges and slippage.
Price may not return to the FVG at all. In that case the limit order doesn’t fill, and chasing the move usually means a worse entry and a larger stop.
A caution: news-driven displacement
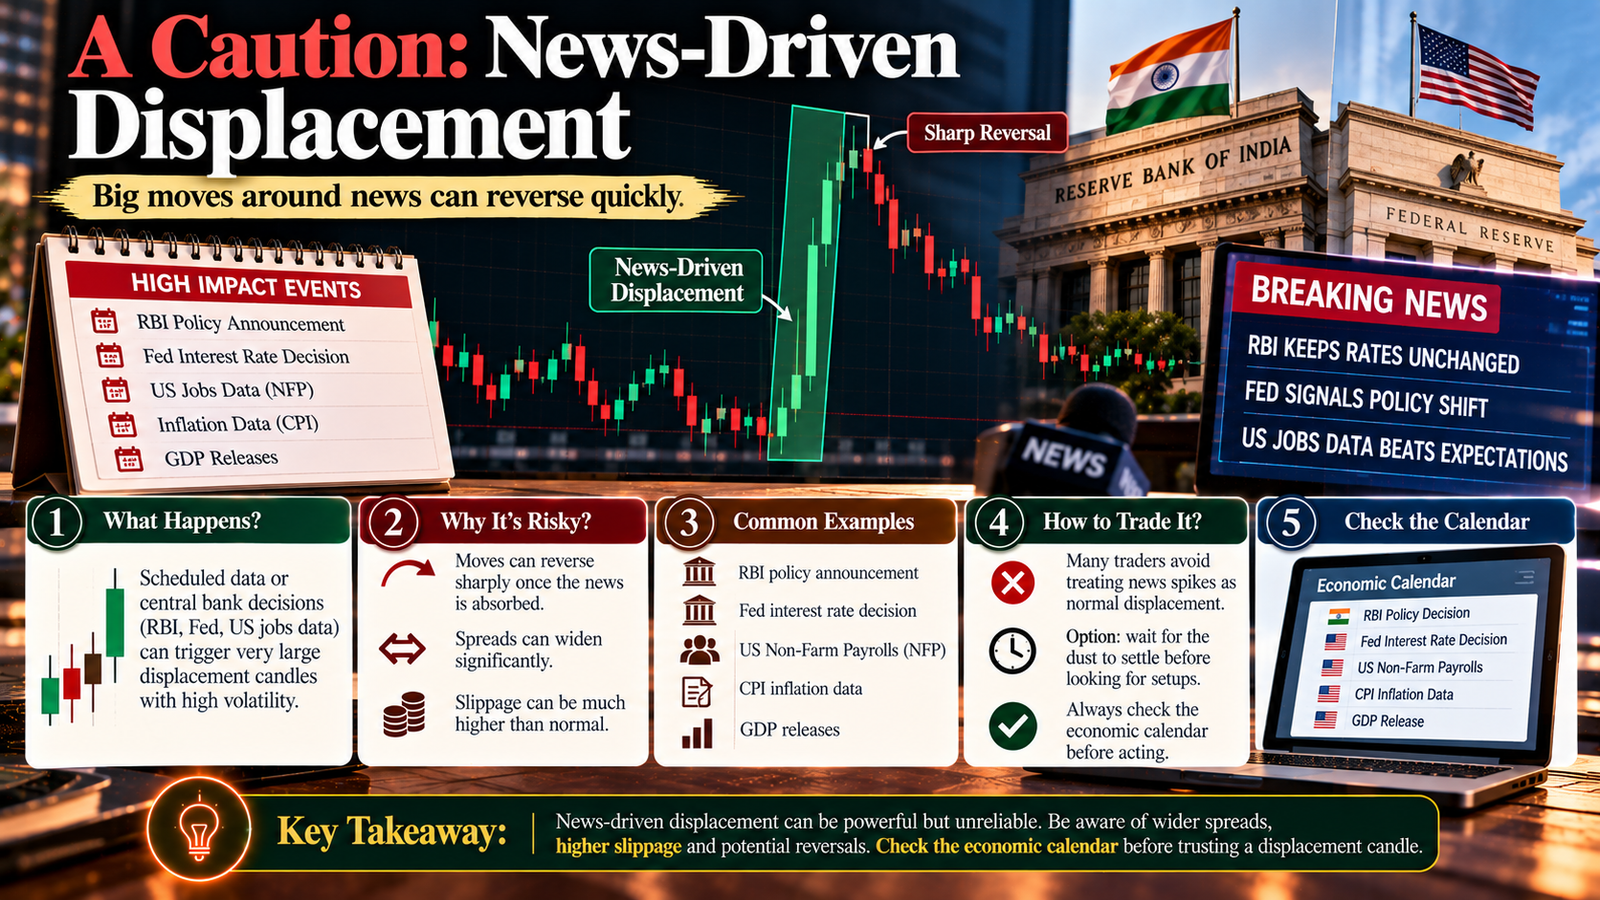
Some of the biggest displacement candles happen around scheduled data or central bank decisions, such as RBI or Fed announcements and US jobs data. These moves can reverse sharply once the news is absorbed, and spreads and slippage can widen. Many traders avoid treating news spikes as normal displacement, or wait for the dust to settle before acting. Check the economic calendar before trusting a displacement candle.
What does the evidence say?
Fact: We found no peer-reviewed research testing SMC or ICT displacement as defined by practitioners.
Fact: Broader academic research, such as Moskowitz, Ooi and Pedersen (2012), documented “time series momentum” in currency and other futures markets over 1–12 month horizons. That’s a much longer horizon than intraday SMC displacement.
Analysis: It’s reasonable that strong, decisive moves carry information about who’s in control, but there’s no published evidence that SMC displacement rules produce an edge. Any edge must come from your full system and be proven in your own journal over many trades.
Step-by-step checklist
- Confirm higher-timeframe bias.
- Mark obvious liquidity (prior highs, lows, equal highs or lows).
- Wait for a sweep of that liquidity.
- Look for displacement: range at least 2× ATR, body 70% or more, structure broken.
- Mark the FVG and order block created.
- Place a limit entry in the FVG, or wait for a lower-timeframe confirmation.
- Stop beyond the sweep; target the next liquidity.
- Size from fixed risk per trade.
- Skip setups driven by major news unless your plan covers them.
- Journal every setup, including those that didn’t fill.
Expert analysis
Fact: In SMC teaching, displacement is a strong, fast move with large-bodied candles that breaks structure and often leaves a fair value gap. There are no official numerical thresholds, and we found no peer-reviewed tests of SMC displacement rules.
Analysis: Displacement is best thought of as a quality filter for other SMC signals. A break of structure with displacement shows commitment; a break by a small, wicky candle is weaker. The main risk is hindsight: on a finished chart, it’s easy to call any big candle “displacement”. Defining it with ATR and body percentage makes it testable and harder to fudge.
Opinion: Beginners should adopt one objective definition (for example, range at least 2× ATR and body at least 70%), use it only in the direction of higher-timeframe bias, and avoid treating news spikes as normal displacement. Most importantly, don’t chase the displacement candle. Wait for the retrace and accept missed trades.
Common mistakes
- Chasing the displacement candle after it has already moved.
- Calling any big candle displacement without an objective rule.
- Ignoring higher-timeframe bias, and trading displacement against the bigger trend.
- Treating news spikes as normal displacement.
- Stops too tight, inside the displacement range instead of beyond the origin.
- Expecting every FVG to be filled or to hold.
- Trading offshore pairs from SMC videos on platforms not permitted for Indian residents.
Myths vs facts
| Myth | Fact |
|---|---|
| “Displacement proves institutions are buying or selling.” | It shows strong one-sided pressure, but you can’t see who is behind it. |
| “Every displacement leads to a retrace into the FVG.” | Many moves never retrace; limit orders may not fill. |
| “There’s an official size for displacement.” | There isn’t; ATR and body-percentage thresholds are practical conventions. |
| “News candles are the best displacement.” | News-driven moves can reverse quickly and come with wider spreads and slippage. |
| “Displacement is a proven edge.” | We found no peer-reviewed tests of SMC displacement rules. |
Key takeaways
- Displacement is a strong, fast move with large-bodied candles that breaks structure and often leaves an FVG.
- Measure it objectively: range vs ATR (e.g. at least 2×) and body percentage (e.g. at least 70%).
- Typical sequence: liquidity sweep → displacement → retrace into FVG or order block → entry.
- Place stops beyond the displacement’s origin, and size from fixed risk. In our example, 5 USD/INR lots risked ₹950 for a potential ₹2,050.
- Be cautious with news-driven displacement.
- The concept isn’t independently proven; test your exact rules over 50–100 trades.
FAQs
- What is displacement in SMC trading? A strong, fast price move made of large-bodied candles that breaks structure and often leaves a fair value gap, showing one side is clearly in control.
- How do I identify displacement? Look for candles with a range well above ATR (for example 2× or more), bodies making up most of the candle (for example 70% or more), a break of structure, and usually an FVG.
- Is displacement the same as an impulse move? They’re similar. Displacement is the SMC/ICT term, with extra emphasis on breaking structure and leaving imbalances.
- What is a fair value gap? A three-candle pattern where the first candle’s high and third candle’s low don’t overlap (bullish), leaving a gap price often revisits.
- Why does displacement matter? SMC traders use it to judge whether a break of structure is meaningful and to find FVGs and order blocks for entries.
- Should I enter on the displacement candle? Most SMC traders wait for a retrace into the FVG or order block rather than chasing the move.
- Where should I place my stop after displacement? Beyond the origin of the move, usually below the sweep low for longs or above the sweep high for shorts.
- What if price never retraces? The limit order doesn’t fill. That’s part of the strategy; chasing usually means worse risk-reward.
- Can news cause displacement? Yes, but news-driven moves can reverse quickly and come with wider spreads and slippage. Many traders treat them separately.
- How does ATR help identify displacement? It gives a baseline for normal movement, so you can measure whether a candle is unusually large.
- Does displacement always lead to a trend? No. Some displacement moves fail or reverse, especially against higher-timeframe bias.
- What timeframe is best for spotting displacement? Any, but use the same timeframe for ATR as for the candle. Many traders look for displacement on the setup timeframe (for example 1-hour or 4-hour).
- Is displacement a proven edge? We found no peer-reviewed research testing SMC displacement rules. Test your own rules carefully.
- Can I use displacement on USD/INR? Yes, on NSE or BSE USD/INR futures through a SEBI-registered broker.
- How is displacement related to liquidity? It often follows a liquidity sweep, when stops above or below an obvious level are taken before price moves strongly the other way.
- What’s the difference between displacement and a breakout? A breakout is any move beyond a level. Displacement specifically describes the strength and speed of the move and the imbalance it leaves.
- How do I test a displacement strategy? Define displacement numerically, set rules for entry, stop and target, apply them to 50–100 trades, and review results in R after costs.