Where candlestick patterns read the market one bar at a time, forex chart patterns zoom out to the bigger shape a price makes over dozens of candles. These larger formations — the head and shoulders pattern, triangles, flags and wedges — map the psychology of a trend as it either exhausts and reverses, or pauses and continues. Learn to spot forex chart patterns and you gain a framework for anticipating breakouts before they happen, rather than chasing them after.
QUICK ANSWER
Forex chart patterns are recognisable price formations that signal a likely reversal or continuation of a trend. The most important are the head and shoulders (reversal), double tops and bottoms (reversal), triangles (usually continuation), flags and pennants (continuation), and wedges (either). Traders enter on a breakout beyond the pattern and project a target using its height.
Reversal vs continuation patterns
Every pattern in this guide falls into one of two families, and knowing which you’re looking at is the whole game. Understanding continuation and reversal patterns tells you whether the prevailing trend is about to end or merely catch its breath.
- Reversal patterns form at the end of a trend and signal a change of direction — head and shoulders, double tops and bottoms.
- Continuation patterns form during a trend as a pause before it resumes — flags, pennants and most triangles.
The mechanics of trading them are similar: wait for a breakout, confirm it, enter, and measure a target from the pattern’s height. The difference is direction — and that is why misreading continuation and reversal patterns is the costliest mistake in chart pattern trading.
The head and shoulders pattern
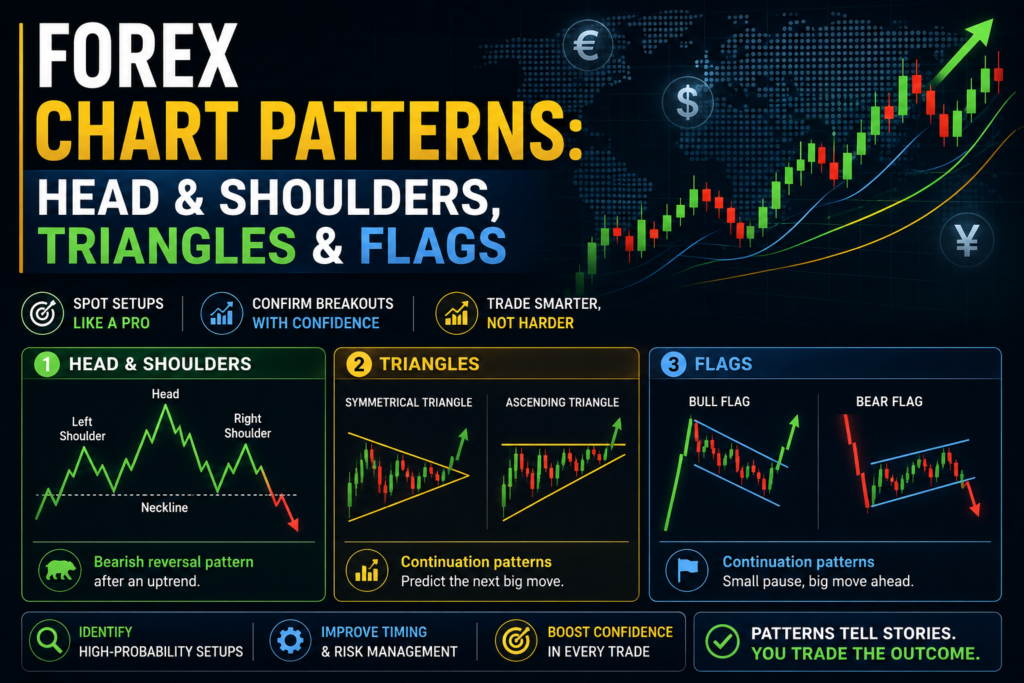
The head and shoulders pattern is the most famous reversal in technical analysis — a three-peak formation that marks the top of an uptrend. A left shoulder forms, then a higher peak (the head), then a lower right shoulder. A line drawn under the two troughs is the neckline; when price breaks below it, the reversal is confirmed.
Head & shoulders: the drop below the neckline confirms the top; the target equals the head-to-neckline height.
Flip it upside down and you get the inverse head and shoulders — the same shape at the bottom of a downtrend, signalling a bullish reversal when price breaks above the neckline. Both are among the most reliable forex chart patterns precisely because they show a clear, three-part failure of the trend to make new extremes.

Double Top & Double Bottom
REVERSAL PATTERNS


Price tests the same level twice and fails to break through. A double top (“M”) reverses an uptrend once price breaks the middle trough; a double bottom (“W”) reverses a downtrend on a break above the middle peak. Triple tops and bottoms are the rarer three-touch versions.
Triangles
Triangles are consolidation patterns where price coils into a narrowing range before breaking out. They are usually continuation patterns, though the breakout direction is what ultimately matters. These are three of the most traded forex chart patterns because the tightening range offers a clean, well-defined entry.


Ascending (flat resistance, rising lows) leans bullish; descending (flat support, falling highs) leans bearish; symmetrical (both lines converging) is neutral until it breaks. Target: project the triangle’s widest height from the breakout point.
Flags and pennants
Flags and pennants are short, sharp continuation patterns. After a steep move (the “flagpole”), price consolidates briefly — in a small rectangular channel (flag) or a tiny triangle (pennant) — then resumes in the original direction. They are the fastest of the forex chart patterns to play out.
Bull Flag
BULLISH · CONTINUATION

A strong rally, a gentle downward drift, then a break upward. The prior surge tends to repeat — target the flagpole’s height from the breakout.
Bear Flag
BEARISH · CONTINUATION

The mirror image in a downtrend: a sharp drop, a slight upward drift, then a break lower as selling resumes.
Wedges
Wedges look like slanted triangles and can act as either reversal or continuation patterns depending on context. A rising wedge (both lines sloping up, converging) is bearish; a falling wedge (both sloping down, converging) is bullish — a useful quirk, because the break usually goes against the wedge’s slope.
Rising Wedge
BEARISH

Price grinds higher into a narrowing range, but momentum fades — the break is typically downward.
Falling Wedge
BULLISH

Price drifts lower into a tightening range, sellers exhaust, and the break is typically upward.
How to trade chart patterns without getting trapped
Recognising a shape is the easy part. Turning forex chart patterns into an edge comes down to a disciplined breakout routine — and a healthy respect for how often patterns fail.
- Wait for the breakout close. Enter only after price closes beyond the neckline or trendline, not on the first poke through — that filters out many false breaks.
- Use the measured move for targets. Project the pattern’s height (head-to-neckline, triangle width, or flagpole length) from the breakout point.
- Check volume. A genuine breakout in chart pattern trading usually comes with a pickup in participation; a limp breakout is more likely to fail.
- Expect the retest. Price often returns to the broken level before continuing — a retest that holds is a higher-probability entry than chasing.
- Define risk first. Place your stop on the other side of the pattern and size the trade so a false breakout is a small loss.
The honest caveat: forex chart patterns are frameworks for probability, not crystal balls. Academic evidence on their standalone reliability is mixed, false breakouts are common, and the measured-move target is a guide, not a promise. They work best as one input alongside trend, support and resistance, and sound risk management.
For traders in India: these patterns apply to exchange-traded pairs like USD/INR. Resident Indians should trade forex only through NSE/BSE currency derivatives via a SEBI-registered broker; offshore spot forex is restricted under FEMA.
Forex chart patterns cheat sheet
| PATTERN | TYPE | BIAS | BREAKOUT / TARGET |
|---|---|---|---|
| Head & Shoulders | Reversal | Bearish | Break below neckline · head height |
| Inverse Head & Shoulders | Reversal | Bullish | Break above neckline · head height |
| Double Top (“M”) | Reversal | Bearish | Break below middle trough |
| Double Bottom (“W”) | Reversal | Bullish | Break above middle peak |
| Ascending Triangle | Continuation | Bullish | Break above flat top · range height |
| Descending Triangle | Continuation | Bearish | Break below flat base · range height |
| Symmetrical Triangle | Continuation | Neutral | Break either way · widest height |
| Bull Flag / Pennant | Continuation | Bullish | Break up · flagpole length |
| Bear Flag / Pennant | Continuation | Bearish | Break down · flagpole length |
| Rising Wedge | Either | Bearish | Break below lower line |
| Falling Wedge | Either | Bullish | Break above upper line |
Frequently asked questions
What are forex chart patterns?
Forex chart patterns are recognisable price formations, spanning many candles, that suggest a trend is likely to reverse or continue. Common examples include head and shoulders, triangles, flags and wedges.
What is the difference between continuation and reversal patterns?
Reversal patterns form at the end of a trend and signal a change of direction, such as head and shoulders or double tops. Continuation patterns form mid-trend as a pause before it resumes, such as flags and most triangles.
How reliable is the head and shoulders pattern?
The head and shoulders pattern is considered one of the more dependable reversals, especially when the neckline break is confirmed by a closing price and a pickup in volume. Like all patterns, it still fails at times, so a stop-loss is essential.
How do I set a price target from a chart pattern?
Use the measured move: take the pattern’s height — the head-to-neckline distance, the triangle’s widest point, or the flagpole length — and project it from the breakout point in the direction of the break.
Are triangles bullish or bearish?
Ascending triangles lean bullish and descending triangles lean bearish, while symmetrical triangles are neutral until price breaks out. In all cases the actual breakout direction is what confirms the bias.
What is a flag pattern in forex?
A flag is a short continuation pattern where price consolidates in a small channel after a sharp move (the flagpole), then breaks out to continue the trend. A pennant is the same idea with a small triangular consolidation.
Why do chart patterns fail?
False breakouts, low volume, major news, and traders all watching the same level can cause patterns to fail. This is why confirmation, volume, a retest, and disciplined risk management matter more than the pattern alone.
Do chart patterns work on all timeframes?
They appear on every timeframe but are generally more reliable on higher ones. Patterns on the 4-hour and daily charts carry more weight than those on very short timeframes, where noise creates many false signals.