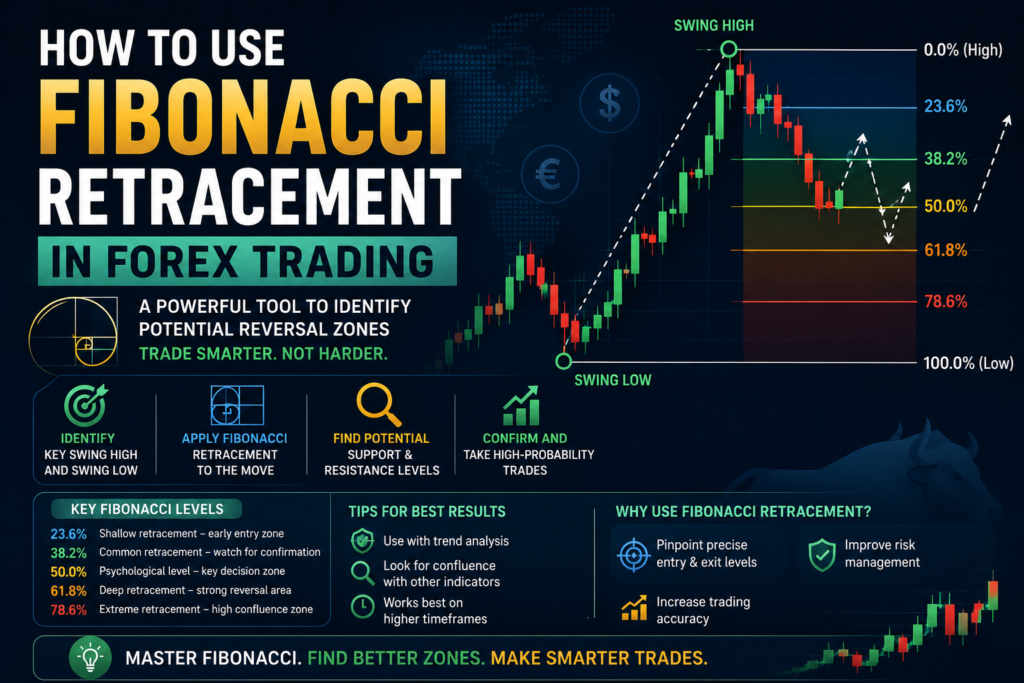
Markets rarely move in a straight line. A currency pair rallies, then pulls back, then often resumes the original move — and Fibonacci retracement is the tool traders use to guess how deep that pullback will go. It maps a handful of horizontal levels onto a price swing, marking the zones where a retracement is most likely to stall and the trend to reload. Used well, Fibonacci retracement turns a vague “it’ll probably bounce somewhere” into a specific, plannable price area.
QUICK ANSWER
Fibonacci retracement is a technical tool that plots horizontal support and resistance levels at key ratios — 23.6%, 38.2%, 50%, 61.8% and 78.6% — across a price swing. In forex, traders use these levels to find where a pullback may end and the trend may resume, entering near a level (often the 61.8% golden ratio) with confirmation, a stop beyond it, and a target at the prior high or a Fibonacci extension.
What is Fibonacci retracement?
The tool takes its name from the Fibonacci sequence — 0, 1, 1, 2, 3, 5, 8, 13, 21… — where each number is the sum of the two before it. Divide any number by the one that follows and you converge on 0.618, the “golden ratio” that shows up throughout nature and design. From that sequence come the ratios traders care about: 61.8% (the golden ratio), 38.2%, 23.6%, and 78.6% (the square root of 0.618). The 50% level isn’t a true Fibonacci number at all, but it’s included because markets so often retrace half of a move.
Applied to a chart, Fibonacci retracement stretches these ratios across a single price swing — from the start of a move to its end — and draws a horizontal line at each level. Those lines act as a map of potential support (in an uptrend) or resistance (in a downtrend). The idea is simple: after a strong move, price usually gives back a predictable fraction of it before continuing.
| LEVEL | ORIGIN | TYPICAL MEANING |
|---|---|---|
| 23.6% | Fibonacci ratio | Shallow pullback — strong trend |
| 38.2% | Fibonacci ratio | Common, healthy retracement |
| 50% | Not Fibonacci (added by convention) | Half-give-back — widely watched |
| 61.8% | The golden ratio | The key level — deep but valid |
| 78.6% | Square root of 0.618 | Last stand before the move fails |
How to draw Fibonacci retracement
Every charting platform — MetaTrader, TradingView and the rest — has a Fibonacci retracement tool. Knowing how to draw Fibonacci correctly is the whole game, because the levels are only as good as the swing you anchor them to.
- Identify a clear swing. Find one clean, decisive move — a run from an obvious swing low to a swing high (or high to low). Choppy, sideways price gives useless levels.
- Anchor the tool. In an uptrend, click the swing low and drag to the swing high. In a downtrend, click the swing high and drag to the swing low. The platform plots the 0% and 100% anchors and fills in the ratios between.
- Read the retracement zone. The 23.6%–78.6% lines show where a pullback may find support (uptrend) or resistance (downtrend).
- Wait for the price to react. Let price pull back into a level and show a reaction before acting — the level is a zone of interest, not an automatic trade.


In a downtrend, anchor high-to-low: price bounces up into the 61.8% level, meets resistance, and the downtrend resumes. Once a retracement holds, extensions (127.2%, 161.8%) project where the resumed move may reach — useful for setting profit targets beyond the prior swing.
A practical Fibonacci trading strategy
Levels on their own are just lines. A repeatable Fibonacci trading strategy turns them into decisions by combining the retracement zone with a trigger, a stop, and a target. Here’s the framework most disciplined traders use.
Trade with the trend, into the golden zone
The highest-probability use of Fibonacci retracement is a pullback entry in the direction of the existing trend. In an uptrend, you buy the dip as price falls into a level; in a downtrend, you sell the bounce. The 50%–61.8% area is often called the “golden zone” — deep enough to give a good price, shallow enough that the trend is likely intact. A retracement beyond 78.6% warns the move may be failing rather than pausing.
Demand confluence and confirmation
A Fibonacci level is far more trustworthy when it lines up with something else. This is the single biggest edge in Fibonacci retracement forex trading: look for a level that coincides with a prior support/resistance zone, a trendline, a moving average, or a round number. Then wait for confirmation — a bullish candlestick pattern at the level, or a break of a small counter-trend line — before entering.

Place stops and targets by the levels
Structure the trade around the grid itself. A logical stop sits just beyond the next level down (for a long) or the 78.6%/100% anchor — if price breaks there, your retracement idea is wrong. For targets, aim at the prior swing high/low, or project Fibonacci extensions for a trend that runs. This keeps risk defined and reward mapped before you enter.
Common mistakes with Fibonacci retracement
- Anchoring to the wrong swing. Sloppy or arbitrary swing points produce meaningless levels. Pick clean, obvious highs and lows.
- Trading against the trend. Fibonacci retracement works best as a trend-continuation tool, not a reversal predictor.
- Treating levels as exact prices. They’re zones, not laser lines — expect price to overshoot or undershoot slightly.
- Skipping confirmation. Entering the instant price touches a level, with no reaction or trigger, invites false signals.
- Forcing it on choppy markets. In a range, retracement levels lose meaning. Use the tool on clear, trending swings.
The honest caveat: Fibonacci retracement has no guaranteed predictive power. Part of why the levels “work” is that so many traders watch them, making them partly self-fulfilling — and the 50% line isn’t even a Fibonacci number. Academic evidence on their standalone edge is mixed. Treat them as one input, strongest in confluence with trend, structure and confirmation, and never as a reason to skip a stop-loss.
For traders in India: Fibonacci retracement applies to exchange-traded pairs like USD/INR just as it does to any market. Resident Indians should trade forex only through NSE/BSE currency derivatives via a SEBI-registered broker; offshore spot forex is restricted under FEMA.
Key takeaways
- Fibonacci retracement plots support/resistance at 23.6%, 38.2%, 50%, 61.8% and 78.6% across a price swing.
- Draw it low-to-high in an uptrend, high-to-low in a downtrend, anchored to a clean swing.
- The 50%–61.8% golden zone is the highest-probability pullback entry — with the trend.
- Confluence and confirmation matter more than the level itself.
- Set stops beyond the next level and targets at prior swings or Fibonacci extensions.
- Levels are zones and are partly self-fulfilling — use them as one input, not a crystal ball.
Frequently asked questions
What is Fibonacci retracement in forex?
Fibonacci retracement is a technical tool that draws horizontal levels at key ratios (23.6%, 38.2%, 50%, 61.8%, 78.6%) across a price swing. In forex it marks where a pullback may find support or resistance before the trend resumes.
What are the most important Fibonacci retracement levels?
The 61.8% level (the golden ratio) is the most watched, followed by 38.2% and 50%. The 50%–61.8% area is often treated as the key entry zone in a trend.
How do I draw Fibonacci retracement correctly?
Pick a clear price swing. In an uptrend, drag the tool from the swing low to the swing high; in a downtrend, from the swing high to the swing low. The platform then plots the levels between the two anchors.
Is the 50% level a real Fibonacci number?
No. The 50% level is not part of the Fibonacci sequence, but it’s included by convention because markets frequently retrace about half of a prior move.
Does Fibonacci retracement actually work?
It has no guaranteed edge on its own, and part of why levels hold is that many traders watch them. It works best combined with trend, support and resistance, and confirmation rather than traded blindly.
What is the golden zone in Fibonacci trading?
The golden zone is the area between the 50% and 61.8% retracement levels, considered a high-probability spot to enter in the direction of the trend after a pullback.
What is the difference between Fibonacci retracement and extension?
Retracement levels measure how far a pullback goes within a move (0%–100%). Extensions project beyond it (127.2%, 161.8%) to estimate how far the resumed trend may travel.
Can I combine Fibonacci with other indicators?
Yes — that’s the recommended approach. Fibonacci levels are strongest when they line up with trendlines, moving averages, support and resistance, or candlestick patterns.