Quick answer
The MACD indicator (Moving Average Convergence Divergence) is a momentum and trend tool that subtracts a 26-period EMA from a 12-period EMA. Traders watch three things: the MACD line crossing its 9-period signal line, crosses of the zero line, and divergence between MACD and price.
Introduction
If you have ever opened a chart on Zerodha Kite, Upstox or TradingView, you have probably seen two wavy lines and a set of bars drifting above and below a central level. That is the MACD indicator, and it is one of the most popular technical tools among Indian traders on the NSE and BSE. It is used on everything from Nifty 50 and Bank Nifty to individual stocks and forex pairs.
This guide explains the MACD indicator in plain language. You will learn what it measures, how it is calculated, and — most importantly — how to read its three core signals: signal-line crossovers, zero-line crossovers and divergence. The goal is understanding, not tips: nothing here is investment advice, and every example is illustrative.
What Is the MACD Indicator?
MACD stands for Moving Average Convergence Divergence. It was developed by American analyst Gerald Appel in the late 1970s, and the now-familiar histogram was added by Thomas Aspray in 1986. In simple terms, the MACD indicator tracks the relationship between two exponential moving averages (EMAs) of price. When those averages pull apart (diverge), momentum is building; when they move closer (converge), momentum is fading.
Because it blends trend direction with momentum, the MACD indicator sits somewhere between a trend-following tool and an oscillator. This dual nature is exactly why it stays popular: one indicator hints at both the direction of a move and its strength.
The Three Components of MACD
The MACD indicator is built from three parts, and reading it correctly means knowing what each one represents.
- MACD line — the difference between the 12-period EMA and the 26-period EMA. This is the fast-moving heart of the tool.
- Signal line — a 9-period EMA of the MACD line itself. It smooths the MACD line and acts as a trigger.
- Histogram — the gap between the MACD line and the signal line, drawn as bars. Growing bars mean accelerating momentum; shrinking bars mean it is easing.

The MACD Formula (With a Worked Example)
Here is the standard math behind the MACD indicator, using the default 12, 26, 9 settings:
MACD Line = EMA(12) − EMA(26)
Signal Line = EMA(9) of the MACD Line
Histogram = MACD Line − Signal Line
Each EMA gives more weight to recent prices using a smoothing multiplier of 2 ÷ (period + 1). So a 12-period EMA uses 2 ÷ 13 ≈ 0.1538, and a 26-period EMA uses 2 ÷ 27 ≈ 0.0741. The formula for each new EMA value is:
EMA(today) = (Price(today) × Multiplier) + EMA(yesterday) × (1 − Multiplier)
Illustrative example: suppose a stock’s 12-EMA is ₹1,020 and its 26-EMA is ₹1,000. The MACD line reads +20. If the 9-period signal line sits at +14, the histogram is +6 — a positive, widening reading that says short-term momentum is running ahead of the longer average. (Figures are illustrative, not live prices.)
Default MACD Settings: 12, 26, 9
The 12, 26, 9 combination is the default on almost every charting platform, and most traders leave it unchanged. Faster settings react sooner but produce more false signals; slower settings are steadier but lag more. A common table of trade-offs looks like this:
| Setting profile | Values | Behaviour | Typical use in India |
|---|---|---|---|
| Standard | 12, 26, 9 | Balanced, the default | Swing / positional trades on Nifty stocks |
| Faster | 8, 17, 9 | Quicker, noisier | Intraday Bank Nifty / index scalping |
| Slower | 19, 39, 9 | Smoother, more lag | Long-term positional charts |
There is no single ‘best’ setting — it depends on your timeframe and how much noise you can tolerate. Beginners are usually better off learning the MACD indicator on the standard 12, 26, 9 before experimenting.
Signal 1: The MACD Crossover (Signal-Line Cross)
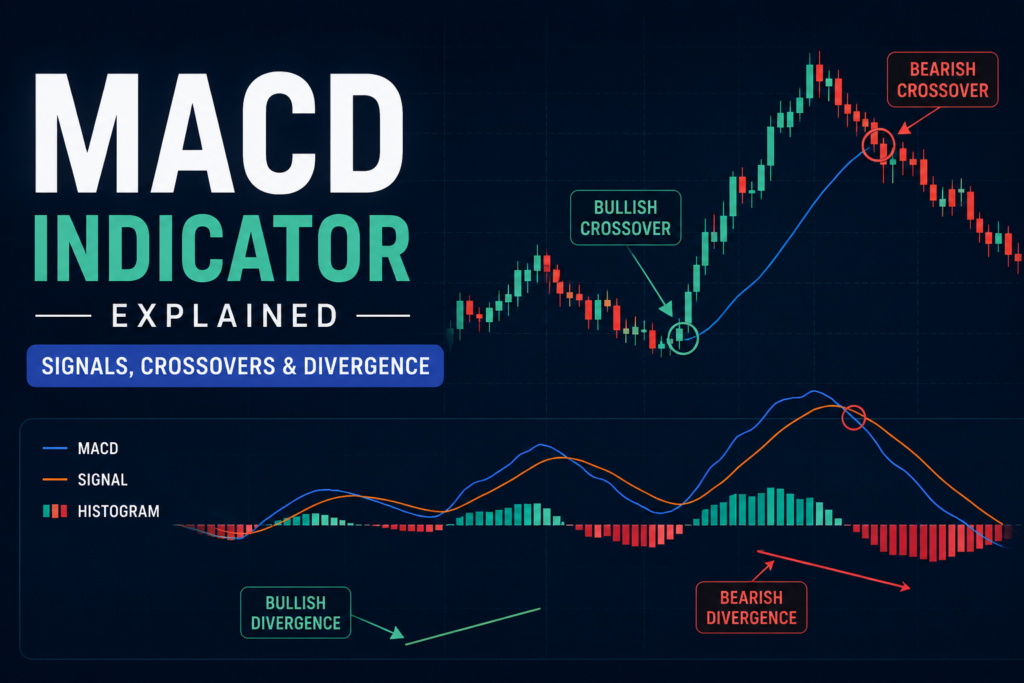
The MACD crossover is the most-watched signal of all. It happens when the MACD line crosses its 9-period signal line.
- Bullish crossover — the MACD line crosses above the signal line, hinting that upward momentum is strengthening.
- Bearish crossover — the MACD line crosses below the signal line, hinting that downward momentum is building.
On the chart you will also see the histogram flip from negative to positive on a bullish crossover, and from positive to negative on a bearish one. That is the same event shown two ways. The catch: crossovers that occur close to the zero line, in a sideways market, produce a lot of whipsaws — signals that reverse almost immediately.
Signal 2: The Zero-Line (Centreline) Crossover
The zero line marks the point where the 12-EMA and 26-EMA are equal. Crosses of this line describe the bigger trend rather than short-term timing:
- MACD line above zero — the shorter EMA is above the longer EMA, so the broader trend leans bullish.
- MACD line below zero — the shorter EMA is below the longer EMA, so the broader trend leans bearish.
Many traders combine the two: they treat a signal-line crossover as more reliable when it agrees with the zero line. A bullish crossover that happens above zero, for instance, is considered stronger than one that fires deep in negative territory against the prevailing trend.
Signal 3: Reading the MACD Histogram
The histogram is an early-warning gauge of momentum. Because it measures the distance between the MACD line and the signal line, it starts shrinking before the two lines actually cross. Traders watch for:
- Expanding bars — momentum is accelerating in the current direction.
- Contracting bars — momentum is slowing, and a crossover may be near.
- Bars flipping sides — confirmation that a signal-line crossover has just occurred.
Signal 4: MACD Divergence
MACD divergence is the signal that separates casual users from experienced ones. Divergence occurs when price and the MACD indicator disagree — a warning that the current trend may be running out of fuel.
Bullish divergence
Price makes a lower low, but the MACD line makes a higher low. Selling momentum is weakening even as price falls — often a sign that a downtrend could be maturing.
Bearish divergence
Price makes a higher high, but the MACD line makes a lower high. Buying momentum is fading even as price rises — a caution flag during an uptrend.
Important
Divergence signals timing poorly. Trends can extend far longer than divergence suggests, so most traders treat divergence as a caution to tighten risk — not as a standalone buy or sell trigger.
A Simple MACD Trading Strategy (Framework, Not Advice)
A basic MACD trading strategy layers the signals so they confirm each other instead of acting alone. One common educational framework:
- Establish the trend: check whether the MACD line is above or below the zero line.
- Wait for a crossover: look for a signal-line crossover in the same direction as the zero-line reading.
- Confirm with the histogram: expanding bars support the move; contracting bars call for caution.
- Add a second tool: many Indian traders pair the MACD indicator with RSI or a 200-day moving average to filter false signals.
- Define risk first: decide your stop-loss and position size before entering — no indicator replaces risk management.
Applied to indices, a trader might watch for a bullish MACD crossover on the Nifty 50 daily chart while the MACD line is already above zero, then use the histogram to judge whether momentum is genuinely building. This is a study framework only.

How to Use MACD in Forex
The mechanics of how to use MACD in forex are identical to stocks — only the market changes. On pairs like USD/INR, EUR/USD or GBP/USD, the MACD indicator is popular because forex often trends cleanly during active sessions.
- Trend confirmation — traders use the zero line to confirm the dominant direction of a currency pair.
- Session timing — crossovers during the London and New York overlap tend to carry more follow-through than quiet Asian-session signals.
- Divergence at extremes — bearish or bullish divergence near a major support or resistance level is watched closely by forex traders.
Note for Indian traders: legal retail forex trading in India is limited to INR-based currency pairs on SEBI-regulated exchanges (NSE, BSE). Always verify that any platform you use is authorised by SEBI and the RBI.

MACD vs RSI: Which Should You Use?
MACD and RSI are the two indicators beginners compare most. They answer slightly different questions, and many traders use them together.
| Feature | MACD indicator | RSI |
|---|---|---|
| Type | Trend + momentum | Momentum oscillator |
| Main question | Is momentum shifting? | Is price overbought/oversold? |
| Scale | Unbounded (centred on zero) | Bounded 0–100 |
| Best in | Trending markets | Range-bound markets |
| Key signal | Crossovers & divergence | 70/30 levels & divergence |
| Lag | Higher (uses EMAs) | Lower |
Neither is ‘better’. The MACD indicator shines when a market is trending; RSI is often more useful when price is stuck in a range. Combining them can reduce false signals — but also adds complexity.
Common Mistakes When Using MACD
- Trading every crossover — in sideways markets, crossovers whipsaw constantly and generate losses.
- Ignoring the trend — taking bullish signals in a clear downtrend fights the bigger picture.
- Treating divergence as a timing tool — divergence warns of fatigue, not the exact turn.
- Over-optimising settings — endlessly tweaking 12, 26, 9 to fit past data rarely works in real time.
- Using MACD alone — no single indicator is a complete system; confirmation and risk control matter more.
Myths vs Facts
| Myth | Fact |
|---|---|
| MACD predicts price. | It reflects momentum from past prices; it does not forecast the future. |
| A crossover is always a buy/sell signal. | Crossovers are unreliable in sideways markets and need context. |
| The best settings are secret. | The default 12, 26, 9 works fine for most; tuning offers marginal gains. |
| Divergence guarantees a reversal. | Trends can persist long after divergence appears. |
Limitations of the MACD Indicator
The MACD indicator is a lagging tool: because it is built from moving averages, its signals arrive after a move has begun. It performs poorly in choppy, range-bound conditions, where crossovers cluster and reverse. And like all technical indicators, it describes probability, not certainty. Used with a clear trend filter and disciplined risk management, however, it remains one of the most practical tools a trader can learn.
Educational disclaimer (SEBI-aligned)
This article is for educational purposes only and is not investment advice, a research report, or a recommendation to buy or sell any security. Trading and investing involve substantial risk of loss. Past performance and technical signals do not guarantee future results. Consult a SEBI-registered Investment Adviser or Research Analyst before making financial decisions.
Best MACD Settings by Timeframe (Reference Table)
| Trader type | Timeframe | Suggested settings | Notes |
|---|---|---|---|
| Scalper (intraday) | 1–5 min | 8, 17, 9 | Fast but noisy; needs confirmation |
| Intraday | 15 min | 12, 26, 9 | Standard, balanced |
| Swing trader | 1 hour – daily | 12, 26, 9 | Most common for Nifty stocks |
| Positional / investor | Daily – weekly | 19, 39, 9 | Smoother, fewer signals |
Expert Analysis
From a practitioner’s standpoint, the enduring value of the MACD indicator is not any single crossover — it is the way it forces a trader to think about trend and momentum at the same time. The zero line answers ‘which way is the market leaning?’ while the crossover and histogram answer ‘is that lean strengthening or fading?’ Read together, they impose a discipline that raw price charts often lack.
Historically, indicators like MACD work best when markets trend and worst when they chop. That is why seasoned traders rarely act on MACD in isolation: they pair it with a trend filter (such as a 200-day moving average) and strict position sizing. In the Indian context, where retail participation on the NSE has grown sharply, the biggest edge is rarely a better setting — it is the patience to skip low-quality signals and the discipline to respect a stop-loss.
Key Takeaways
- The MACD indicator measures the relationship between a 12-period and 26-period EMA, smoothed by a 9-period signal line.
- Its three signals are signal-line crossovers, zero-line crossovers and divergence.
- The histogram is an early gauge of momentum shifts.
- MACD is a lagging tool that works best in trending markets and struggles in sideways ranges.
- It is strongest when combined with a trend filter and firm risk management — never used alone.
Frequently Asked Questions (FAQ)
Q: What is the MACD indicator in simple terms?
A: The MACD indicator is a momentum and trend tool that subtracts a 26-period EMA from a 12-period EMA, then compares that MACD line to a 9-period signal line to show whether momentum is rising or falling.
Q: What does MACD stand for?
A: MACD stands for Moving Average Convergence Divergence.
Q: What are the default MACD settings?
A: The default settings are 12, 26 and 9 — a 12-period EMA, a 26-period EMA and a 9-period signal line. Most charting platforms use these by default.
Q: What is a MACD crossover?
A: A MACD crossover happens when the MACD line crosses its signal line. Crossing above is bullish; crossing below is bearish.
Q: What is MACD divergence?
A: Divergence is when price and the MACD line move in opposite directions — for example price makes a new high but MACD does not — warning that the trend may be weakening.
Q: Is MACD a leading or lagging indicator?
A: MACD is mainly a lagging indicator because it is built from moving averages, though the histogram can give slightly earlier momentum clues.
Q: What is the zero line in MACD?
A: The zero line is where the 12-EMA and 26-EMA are equal. Above zero suggests a bullish lean; below zero suggests a bearish lean.
Q: Can I use MACD for intraday trading in India?
A: Yes. Many intraday traders use the MACD indicator on 5–15 minute charts of Nifty, Bank Nifty and liquid stocks, often with faster settings and a second confirming tool.
Q: Is MACD good for forex trading?
A: Yes. MACD is popular in forex because currency pairs often trend cleanly. The signals work the same way as on stocks.
Q: MACD vs RSI — which is better?
A: Neither is universally better. MACD is stronger in trending markets, RSI in ranging ones; many traders use both together.
Q: What are the best MACD settings for beginners?
A: Beginners should start with the standard 12, 26, 9 before experimenting, as it is balanced and widely used.
Q: Does MACD work on Nifty and Bank Nifty?
A: Yes. The MACD indicator is widely applied to Indian indices like Nifty 50, Bank Nifty and the Sensex, as well as individual stocks.
Q: Why does MACD give false signals?
A: In sideways or choppy markets, the MACD line and signal line cross repeatedly, producing whipsaws. A trend filter helps reduce these.
Q: Can MACD be used with other indicators?
A: Yes, and it usually should be. Pairing it with RSI, volume or a 200-day moving average helps confirm signals.
Q: Is the MACD indicator free to use?
A: Yes. It is a standard tool available free on TradingView, Zerodha Kite, Upstox, Angel One and virtually every charting platform.