Key Takeaways
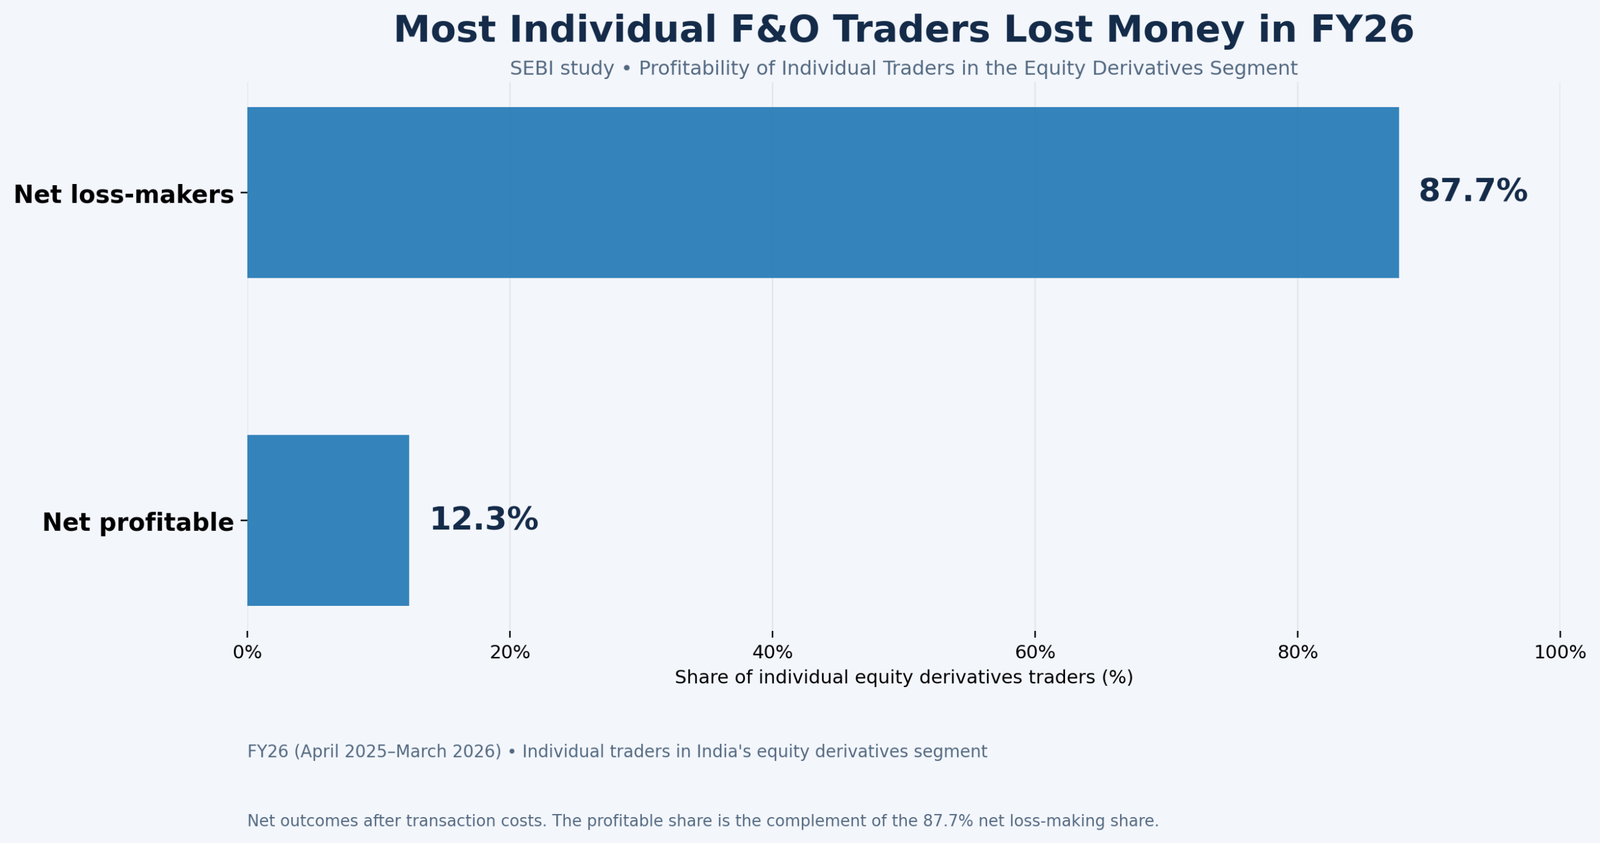
- SEBI’s FY26 study found 87.7% of individual equity F&O traders made net losses, with aggregate losses of about ₹91,685 crore.
- Options drove about 92% of those losses, and traders under 30 made up 43% of the trader base.
- Transaction costs of about ₹24,859 crore turned roughly 4.4 lakh pre-cost winners into net losers.
- The causes are mostly behavioural and structural: oversized positions, option buying with negative expectancy, overtrading and no cost awareness.
- You can improve your odds by sizing by rupee risk, tracking costs and expectancy, and trading far less.
Every year SEBI publishes a number that should stop new traders in their tracks, and every year a fresh batch of traders opens an F&O account anyway. The question is not whether losses happen; it is why most F&O traders lose money, and what the few who survive do differently. This guide is for Indian retail traders, students and working professionals who trade or plan to trade futures and options. You will learn what SEBI’s latest study found, the five main reasons behind the losses, a ₹ example of how costs and small edges add up, and practical habits that keep you out of the losing majority.
Why do most F&O traders lose money?
Most F&O traders lose money because they buy short-dated options with poor expectancy, trade too large and too often, and ignore costs. SEBI’s FY26 study found 87.7% of individual traders made net losses, and costs alone flipped about 4.4 lakh pre-cost winners into losers. The market is not rigged; the habits are.
That answer needs evidence, so let us look at what the regulator actually measured.
What SEBI’s FY26 study found
SEBI released its latest set of equity derivatives studies on 20 August 2026 through its Department of Economic and Policy Analysis. You can read the summary in the SEBI press release on its FY26 studies. Here are the headline numbers, as reported from the study by Business Today, Outlook Money and Corporate Law Updates:
| Metric | FY25 | FY26 |
|---|---|---|
| Individual traders with net losses | about 91% | 87.7% |
| Aggregate net loss of individuals | about ₹1.12 lakh crore (revised) | about ₹91,685 crore |
| Average loss per trader | about ₹1.14 lakh | about ₹1.17 lakh |
| Active individual traders | about 98.1 lakh | about 78.6 lakh |
| Transaction costs of individuals | about ₹24,827 crore | about ₹24,859 crore |
| Average cost per trader | ₹26,027 | ₹31,628 |
A few more points from the FY26 study stand out:
- Options did the damage. About 92% of individual traders’ aggregate losses came from options.
- Young traders are over-represented. Traders under 30 made up 43% of the trader base, and about 89% of them lost money, according to Business Today’s report on the study.
- Lower incomes, bigger share of losses. Traders earning under ₹5 lakh a year accounted for 53% of total losses while contributing 43% of turnover.
- Professionals won. Proprietary traders booked gross trading profits of about ₹44,000 crore and FPIs about ₹14,000 crore, with about 99% of those profits coming from algorithmic entities.
Fewer people traded in FY26 after SEBI’s November 2024 measures on weekly expiries, contract sizes and expiry-day margins. But those who stayed lost slightly more per head.
The five real reasons F&O traders lose
1. Buying cheap out-of-the-money options
An out-of-the-money (OTM) option is a call above the current price or a put below it. These options are cheap because they usually expire worthless. A trader who buys them every expiry wins occasionally, which feels rewarding, but the many small losses add up to more than the rare big win. This is negative expectancy, meaning the average result per trade is below zero.
2. Position size far above what the account can carry
Small premiums tempt traders to buy 10 or 20 lots. A ₹2,00,000 account that risks ₹20,000 on one expiry needs only a handful of bad trades to halve. Our guide on risk management for beginner traders explains why risking 0.5% to 1% per trade is the usual ceiling.
3. Costs that compound with frequency
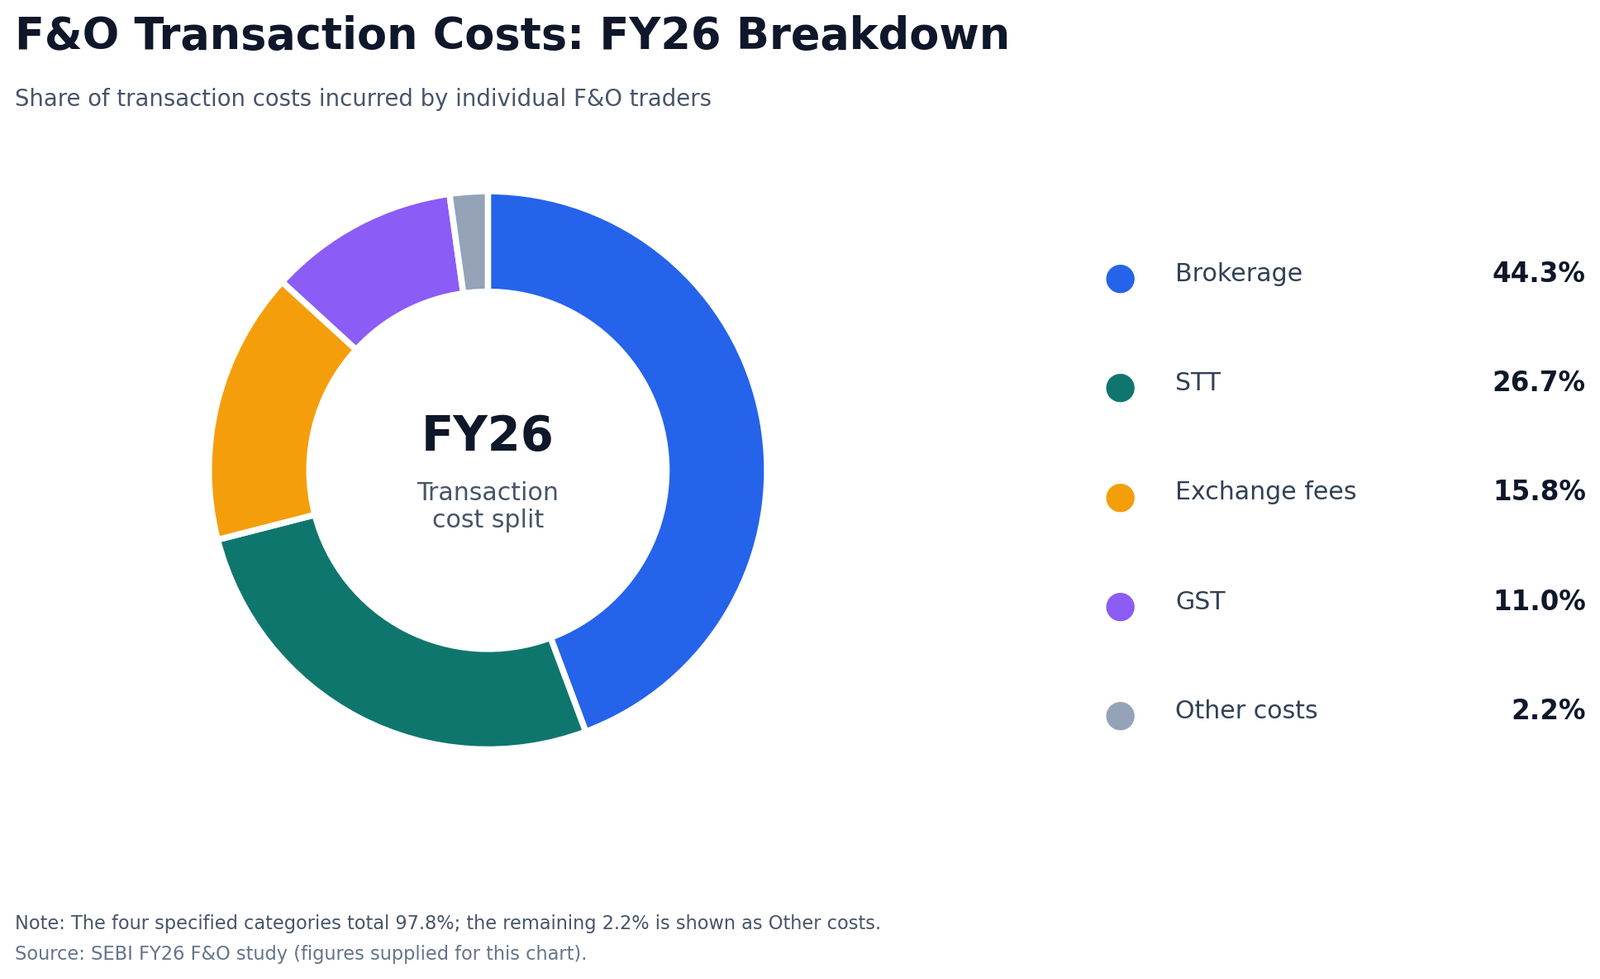
SEBI’s data shows costs took about 35% of gross losses for losing traders, against 21% of gross profits for winners. Brokerage was 44.3% of the FY26 cost bill, STT 26.7%, exchange fees 15.8% and GST 11%. Someone trading 20 times a day pays these charges 20 times.
4. Emotional decisions after losses
Revenge trading, moving stops and doubling up to “recover” are classic patterns. Traders often take their biggest positions right after their worst days. Our trading psychology guide covers how to break that loop.
5. Competing against faster, better-funded players
Algorithmic proprietary desks and FPIs earned the profits that retail traders lost. They have better data, faster execution and lower costs per trade. A retail trader scalping the same index options on a phone is playing on their terms.
Worked example: how a small edge disappears after costs
Example (hypothetical): Ravi has ₹1,00,000 and trades index options. He averages 6 round trips a day for 20 trading days a month, so 120 round trips. His charges, including brokerage, STT, exchange fees, GST and stamp duty, average ₹70 per round trip.
| Item | Monthly figure |
|---|---|
| Round trips | 120 |
| Average charges per round trip | ₹70 |
| Total charges | ₹8,400 |
| Gross trading profit before costs | ₹5,000 |
| Net result | −₹3,400 |
Ravi had a small positive edge before costs. After costs he lost ₹3,400 in the month, or 3.4% of capital. Over 12 months, the same pattern would cost him about ₹40,800 even though he “won” before charges.
Now suppose Ravi cuts to 1 round trip a day, or 20 a month, and keeps the same gross edge per trade. His gross profit falls to about ₹833 and charges fall to ₹1,400, so he is still slightly negative. The lesson: costs are not the only problem. He also needs a bigger edge per trade, which usually means fewer, better-planned setups rather than more clicks. You can model your own numbers with our commission calculator.
This mirrors SEBI’s finding that about 4.4 lakh traders who were profitable before costs ended FY26 with a net loss.
How to avoid becoming one of the 9 out of 10 traders who lose
- Measure your expectancy. Expectancy is the average rupee result per trade after costs. Track it for at least 50 trades using our guide to trade expectancy calculation.
- Fix risk per trade in rupees. Decide your maximum loss before entry, typically 0.5% to 1% of capital.
- Cap daily losses. Stop trading for the day after a set loss, for example 2% of capital.
- Trade fewer setups. Write down two or three setups and trade only those.
- Prefer defined risk. If you trade options, spreads cap your maximum loss compared with naked selling.
- Track every cost. Pull your broker’s contract notes monthly and total brokerage, STT, GST and other charges.
- Check your risk of ruin. Our page on risk of ruin calculation shows how win rate and risk size combine.
- Review weekly. Look at what you did, not just what the market did.
Is currency F&O any different from equity F&O?
SEBI’s study covers equity derivatives, not currency derivatives, so its figures should not be applied directly to USD/INR traders. Still, the same forces apply: costs, leverage, position size and behaviour.
USD/INR usually moves less than index options, which can make losses slower but also tempts traders to take bigger size. Indian residents may trade currency derivatives only through SEBI-registered brokers on recognised Indian exchanges such as NSE, BSE and MSE, in permitted pairs. Leveraged forex on overseas online platforms through LRS is not permitted, and RBI maintains an Alert List of unauthorised platforms. Our comparison of F&O vs forex trading in India explains the legal routes.
Common mistakes when reading SEBI’s loss data
Thinking “I will be in the 12%”
Almost everyone who starts believes they will be the exception. The study shows most do not become one, and the profitable group includes many with small gains.
Blaming only the regulator or the market
Rule changes affected participation, but individual losses came mainly from options buying, size and costs. Those are choices traders control.
Comparing headline numbers across years without context
SEBI’s samples and revisions differ between studies; for example, the FY25 aggregate loss was later revised to about ₹1.12 lakh crore. Use the direction of the data, not one precise figure, to guide decisions.
Ignoring the cost side
Many traders track wins and losses but never total their charges. Costs are the one part of trading you can measure precisely.
FAQs
What percentage of F&O traders lose money in India?
SEBI’s FY26 study found that 87.7% of individual traders in equity derivatives made net losses, down from about 91% in FY25. Only about 12.3% ended the year with a net profit. The study covered the large majority of individual traders through data from major brokers and exchanges.
How much did retail F&O traders lose in FY26?
Individual traders’ aggregate net losses in equity derivatives were about ₹91,685 crore in FY26, according to SEBI’s study. That was roughly 18% lower than the revised FY25 figure of about ₹1.12 lakh crore, mainly because fewer people traded. The average loss per trader, however, rose to about ₹1.17 lakh.
Why do option buyers lose more than futures traders?
Option buyers pay a premium that loses value as expiry nears, so they need a large move quickly to profit. Cheap out-of-the-money options usually expire worthless. SEBI’s FY26 study found options accounted for about 92% of individual traders’ aggregate losses, which reflects both their popularity and their difficult odds.
Do transaction costs really matter in F&O trading?
Yes. SEBI’s FY26 study estimated individual traders paid about ₹24,859 crore in transaction costs. Costs took about 35% of gross losses for losing traders, and about 4.4 lakh traders who were profitable before costs ended the year with a net loss. Frequent trading multiplies these charges.
Can a beginner make money in F&O?
It is possible but uncommon, and the data shows most beginners lose. A beginner should learn on paper or with very small size, risk no more than 0.5% to 1% per trade, prefer defined-risk strategies and track expectancy after costs. Treat the first year as education, not income.
Does SEBI’s study include currency derivatives traders?
No. The FY26 studies covered equity derivatives, mainly index and stock futures and options. Currency derivatives such as USD/INR futures and options were not part of these figures. The same principles of cost, size and discipline still apply to currency traders on NSE and BSE.
Conclusion
The data on why most F&O traders lose money is consistent year after year. Short-dated option buying, oversized positions, frequent trading and ignored costs explain most of it, while algorithmic professionals collect the other side. The fix is not a secret indicator. It is arithmetic and discipline: fixed rupee risk, fewer trades, defined-risk structures and a running record of expectancy after costs. If you trade at all, make sure you know your numbers better than the market does. Start by checking what your charges are really costing you with the commission calculator, then review our trading psychology guide.