Introduction
USD/JPY, often called the “dollar-yen”, is one of the most traded currency pairs in the world. It pairs the US dollar, the world’s main reserve currency, with the Japanese yen, a traditional safe-haven currency. That combination makes the pair highly sensitive to interest rates, global risk sentiment and central bank decisions.
For many traders, USD JPY trading offers deep liquidity, clear macro drivers and strong trends. But the pair also has unique risks, including sharp reversals when the carry trade unwinds and the possibility of intervention by Japanese authorities.
This guide covers:
- How the USD/JPY pair works and how to read its price
- The main factors that move the dollar-yen
- The best times for USD JPY trading in Indian time
- Practical strategies, risk management and common mistakes
- How Indian traders can access the pair legally
Understanding the Basics of USD JPY Trading
In USD/JPY, the US dollar is the base currency and the Japanese yen is the quote currency. The price shows how many yen are needed to buy one US dollar. If USD/JPY is at 150.00, one dollar buys 150 yen.
- If USD/JPY rises: The dollar is strengthening against the yen, or the yen is weakening.
- If USD/JPY falls: The dollar is weakening, or the yen is strengthening.
Pips and pip value
Unlike most major pairs, USD/JPY is quoted to two decimal places (with a third fractional digit on many platforms). One pip is 0.01. Because the pip is in yen, its value in dollars depends on the exchange rate.
For a standard lot of 100,000 dollars, one pip equals 1,000 yen. At a rate of 150.00, that is about $6.67. At 140.00, it is about $7.14.
| Lot size | Units of USD | Value of 1 pip in yen | Approx. value in USD at 150.00 |
|---|---|---|---|
| Standard | 100,000 | ¥1,000 | $6.67 |
| Mini | 10,000 | ¥100 | $0.67 |
| Micro | 1,000 | ¥10 | $0.07 |
Why Traders Like USD/JPY
- High liquidity: It is among the most traded pairs globally, so spreads are usually tight.
- Clear macro drivers: The pair responds strongly to interest rate expectations in the US and Japan.
- Trending behaviour: Large rate differences have historically produced long, sustained trends.
- Active across sessions: It trades actively in Tokyo, London and New York.
The trade-off is that USD JPY trading can involve sudden, violent moves when sentiment shifts or authorities step in.
What Moves USD/JPY? Key Drivers for USD JPY Trading
1. The US-Japan interest rate gap
The single most important driver is the difference between US and Japanese interest rates and bond yields. For many years, the Bank of Japan (BoJ) kept rates extremely low while US rates were much higher. That gap made holding dollars more attractive than holding yen, pushing USD/JPY higher.
When US Treasury yields rise relative to Japanese yields, USD/JPY tends to rise. When the gap narrows, because the Federal Reserve cuts rates or the BoJ raises them, the pair tends to fall. Many traders watch the US 10-year Treasury yield as a guide.
2. Bank of Japan policy
BoJ decisions on interest rates, bond purchases and yield control can move the yen sharply. Any hint of tighter policy tends to strengthen the yen, while dovish signals tend to weaken it.
3. Federal Reserve policy and US data
US inflation, jobs data (such as Non-Farm Payrolls) and Fed statements shape expectations for US rates, which feed directly into USD/JPY.
4. The carry trade
In a carry trade, investors borrow in a low-interest currency, such as the yen, and invest in higher-yielding assets. This creates steady selling of the yen and supports USD/JPY. But when markets become fearful, these trades are often unwound quickly, causing the yen to surge and USD/JPY to drop sharply.
5. Risk sentiment and safe-haven flows
The yen has traditionally acted as a safe haven. During market stress, investors often buy yen, pushing USD/JPY lower, even if US rates are unchanged.
6. Intervention risk
Japan’s Ministry of Finance can instruct the BoJ to intervene in currency markets when it believes the yen is moving too quickly. Japan intervened to support the yen several times in recent years, including in 2022 and 2024. Intervention can move the pair by hundreds of pips in minutes. Verbal warnings from Japanese officials often come first and can be a sign to reduce risk.
Best Times for USD JPY Trading in India (IST)
USD/JPY trades around the clock on weekdays, but activity varies by session. With the UK on winter time from 25 October 2026 and the US moving to winter time on 1 November 2026, approximate times are:
| Session | Approximate IST (winter) | What to expect |
|---|---|---|
| Tokyo session | 5:30 am – 2:30 pm | Japanese flows, BoJ news, Japanese data |
| London open | From about 1:30 pm | Volume rises; trends can begin or reverse |
| New York session | From about 6:30 pm | US data, Fed news, highest volatility |
Session times are approximate and shift with daylight saving in the UK and US.
For many Indian traders, the evening is the most active window for USD JPY trading, because major US data and Treasury yield moves usually happen during the New York session. The Tokyo session, early in the Indian morning, can matter on BoJ decision days.

Key Economic Events to Watch
- Japan: BoJ policy meetings, Tokyo and national CPI, wage data, GDP and the Tankan survey
- US: FOMC meetings, CPI, Non-Farm Payrolls, GDP, retail sales and ISM surveys
- Bond markets: US 10-year Treasury yields and Japanese government bond yields
- Official comments: Remarks from Japan’s Ministry of Finance about currency moves
Keep an economic calendar open. Many of the biggest moves in USD JPY trading begin with a scheduled event.
USD/JPY Trading Strategies
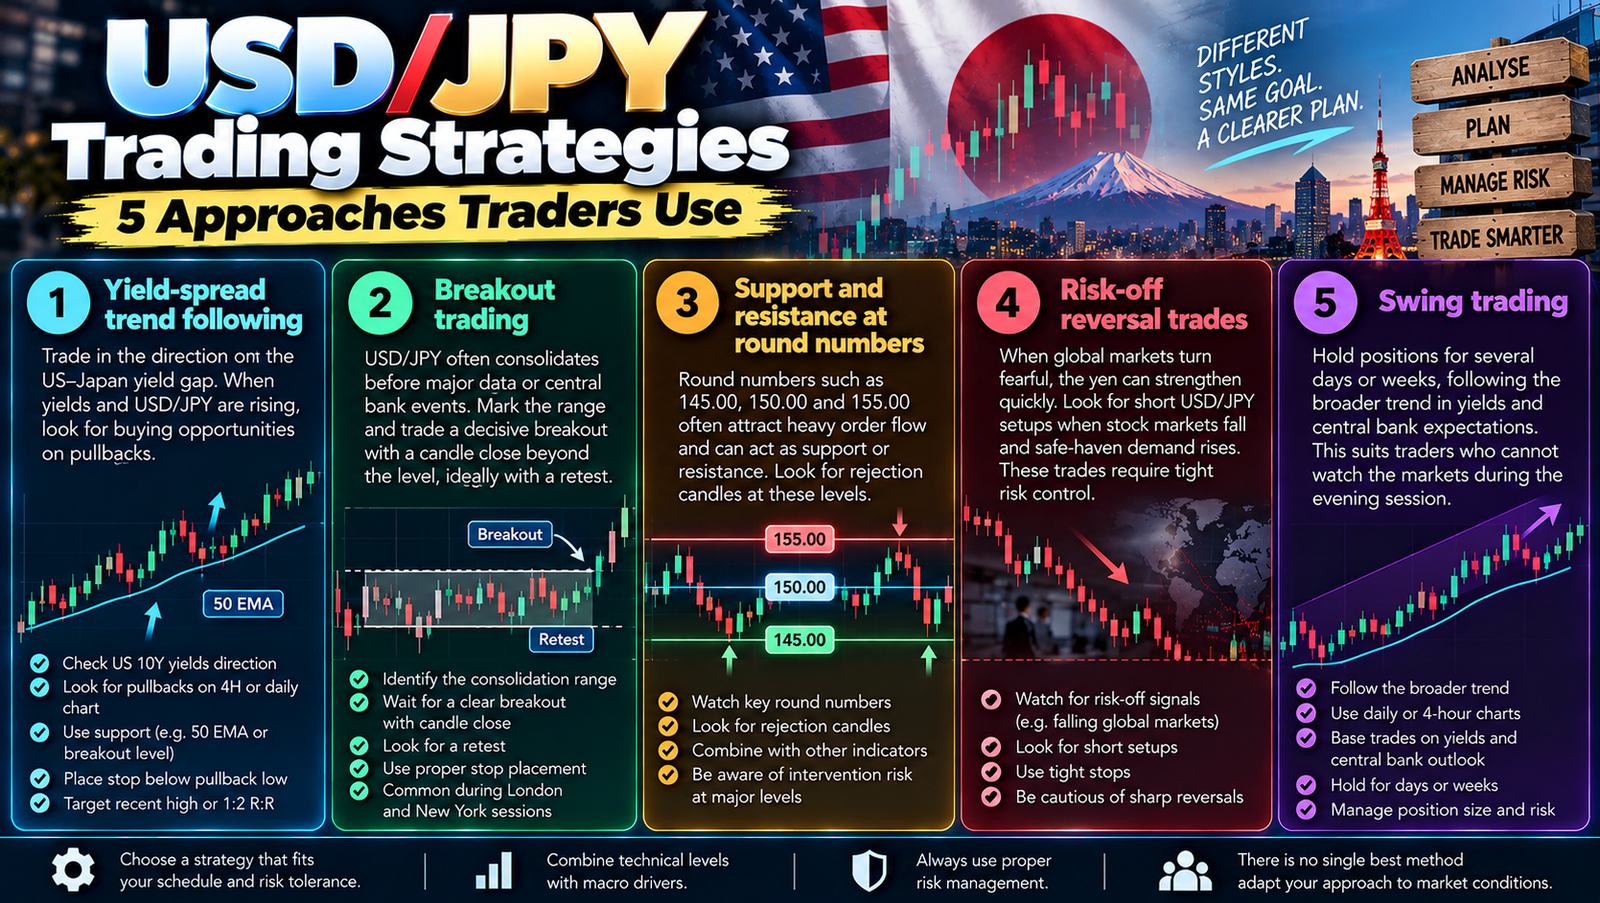
There is no single best method for USD JPY trading. Your choice depends on your schedule, risk tolerance and how closely you follow macro news. Here are five approaches many traders use.
1. Yield-spread trend following
- Check the direction of the US-Japan yield gap, for example by watching US 10-year Treasury yields.
- When yields and USD/JPY are rising together, look for buying opportunities on pullbacks.
- Use the 4-hour or daily chart to identify support, such as a rising 50 EMA or previous breakout level.
- Place the stop below the pullback low and target the recent high or a 1:2 risk-reward ratio.
This approach aligns technical entries with the main fundamental driver of the pair, which is why it is a core part of USD JPY trading for many swing traders.
2. Breakout trading
USD/JPY often consolidates before major data or central bank events. Traders mark the range and look for a decisive breakout with a candle close beyond the level, ideally confirmed by a retest. This setup is popular in USD JPY trading around the London and New York opens.
3. Support and resistance at round numbers
Round numbers, such as 145.00, 150.00 and 155.00, often attract heavy order flow and can act as support or resistance. Some round numbers also become psychological lines for possible intervention. Look for rejection candles at these levels.
4. Risk-off reversal trades
When global markets turn fearful, the yen can strengthen quickly. Some traders look for short USD/JPY setups when stock markets fall sharply and safe-haven demand rises, but these trades require tight risk control.
5. Swing trading
Swing traders hold positions for several days or weeks, following the broader trend in yields and central bank expectations. This suits traders who cannot watch the markets during the evening session.
Technical Tools for USD JPY Trading
- Moving averages: 20, 50 and 200 EMAs help define the trend.
- RSI: Useful for spotting momentum and overbought or oversold conditions.
- ATR: Helps set stops that suit the pair’s volatility.
- Fibonacci retracements: Identify pullback zones in strong trends.
- Ichimoku Cloud: Developed in Japan and popular with yen traders.
Risk Management in USD JPY Trading
Because of intervention risk and carry-trade unwinds, risk management is essential in USD JPY trading.
- Risk a small percentage: Many traders risk 0.5–1% of their account per trade.
- Use ATR-based stops: The pair can make large moves, so very tight stops are often hit.
- Reduce size near intervention zones: When officials start warning about the yen, consider smaller positions.
- Be careful around BoJ and Fed meetings: Spreads can widen and price can gap.
- Watch weekends: Major news can cause gaps at the Monday open.
Position sizing example
Suppose your account is $5,000 and you risk 1%, or $50. Your stop is 40 pips away. At a rate of 150.00, one pip on a mini lot is worth about $0.67, so 40 pips is about $26.80 per mini lot. Dividing $50 by $26.80 gives about 1.9 mini lots, so a trader might use 0.18 or 0.19 standard lots.
A USD JPY Trading Example
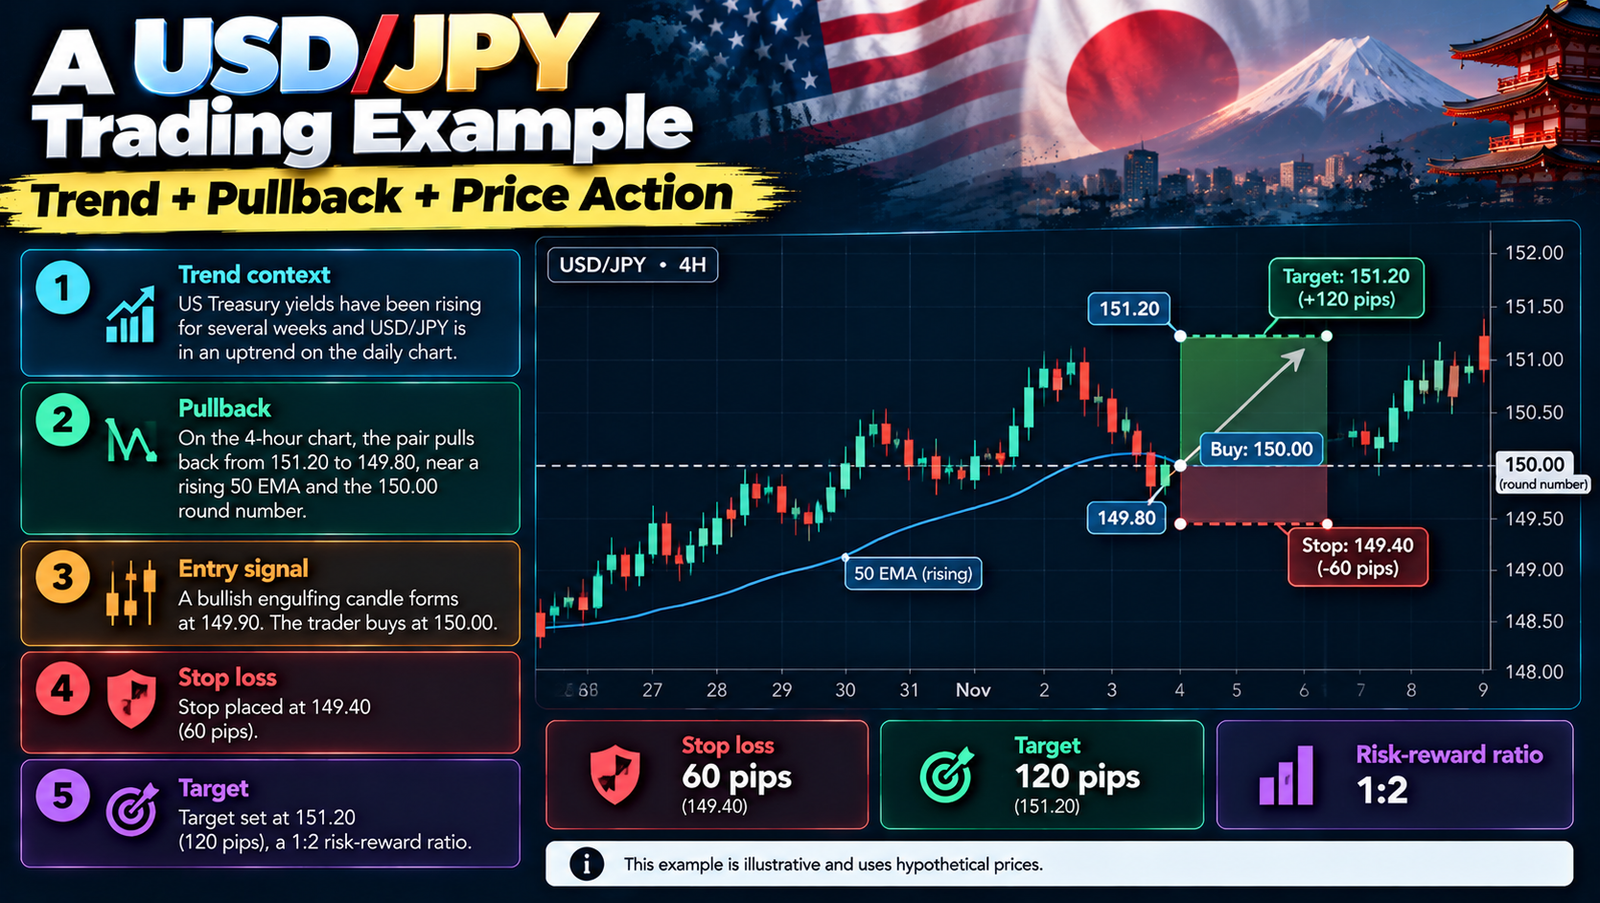
Imagine US Treasury yields have been rising for several weeks and USD/JPY is in an uptrend on the daily chart. On the 4-hour chart, the pair pulls back from 151.20 to 149.80, near a rising 50 EMA and the 150.00 round number.
A bullish engulfing candle forms at 149.90. A trader buys at 150.00, places a stop at 149.40 (60 pips) and sets a target at 151.20 (120 pips), a 1:2 risk-reward ratio.
This example is illustrative and uses hypothetical prices.
Common USD JPY Trading Mistakes
- Ignoring yields: Trading the pair without watching the US-Japan rate gap.
- Underestimating intervention: Holding large positions when officials are warning about the yen.
- Misreading pip values: Forgetting that pip value changes with the exchange rate.
- Fighting strong trends: Trying to pick tops in a powerful carry-driven uptrend.
- Overlooking risk-off events: Global sell-offs can quickly strengthen the yen.
- No plan for BoJ days: Policy surprises can cause very large moves.
How Indian Traders Can Trade USD/JPY Legally
Under FEMA, Indian residents may not send money abroad for leveraged forex or CFD trading, and the RBI has published an Alert List of unauthorised forex trading platforms. Trading USD/JPY through an offshore CFD broker can put you at legal risk.
Legal routes include:
- USD/JPY cross-currency futures and options on Indian exchanges: One contract is USD 1,000, the tick size is 0.01 yen and the price is quoted in yen per dollar. Profit and loss is converted to rupees for settlement.
- JPY/INR futures and options: These let you trade the yen against the rupee.
Not every broker offers currency derivatives, so check availability, contract specifications and trading hours with a SEBI-registered broker before trading.
FAQs
What moves USD/JPY the most?
The gap between US and Japanese interest rates and bond yields, Bank of Japan and Federal Reserve policy, global risk sentiment and the possibility of intervention.
What is the best time for USD JPY trading in India?
The New York session in the evening is usually the most active, because of US data and yield moves. The Tokyo session in the early morning matters on BoJ days.
Why is the yen called a safe haven?
Investors have traditionally bought yen during market stress, partly because of Japan’s large overseas assets and the unwinding of carry trades.
What is the pip value of USD/JPY?
One pip is 0.01. On a standard lot, it equals ¥1,000, which is roughly $6.67 at a rate of 150.00.
Can Indian residents trade USD/JPY legally?
Yes, through USD/JPY cross-currency derivatives on Indian exchanges via SEBI-registered brokers. Offshore CFD platforms are risky under FEMA.
Conclusion
USD/JPY is a liquid, trend-friendly pair driven by some of the clearest macro forces in the currency market: interest rate differentials, central bank policy and global risk sentiment. Successful USD JPY trading means watching yields, respecting intervention risk, trading the right sessions and keeping risk small.
Keep a trading journal that records the yield backdrop, session and news for each trade. Over time, it will show which conditions suit your USD JPY trading style best. For Indian traders, the best approach is to study the global dollar-yen market and use exchange-traded contracts through SEBI-registered brokers. Practise on a demo account, follow a written plan, and review every trade to build your skills.