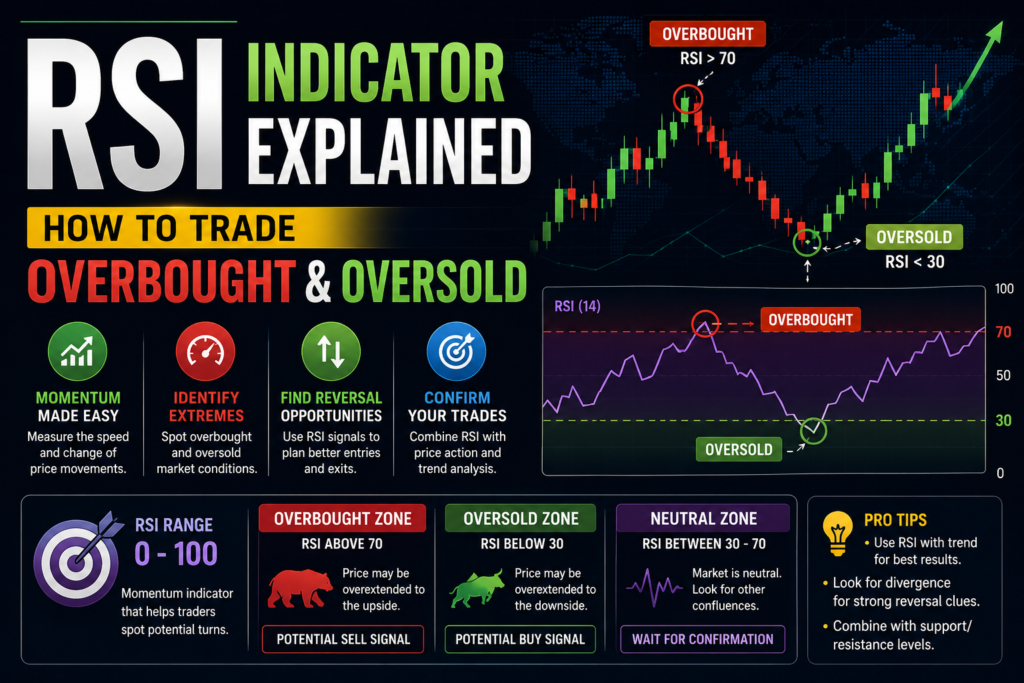
Of all the tools clipped to a forex chart, the RSI indicator is among the most used — and the most misused. It condenses momentum into a single line that swings between 0 and 100, flagging when a currency pair may have run too far, too fast. Read correctly, the RSI indicator tells you when a move is stretched and when it’s simply strong. Read lazily, it hands you a stream of “sell” signals in the middle of a rally. This guide shows the difference.
QUICK ANSWER
The RSI indicator (Relative Strength Index) is a momentum oscillator that measures the speed and size of recent price moves on a 0–100 scale. Readings above 70 are overbought and below 30 are oversold. Rather than selling the instant RSI hits 70, skilled traders wait for it to cross back out of the zone, trade with the larger trend, and watch for RSI divergence as an early warning of reversals.
What is the RSI indicator?
The RSI indicator was developed by J. Welles Wilder in 1978 and has been a staple of technical analysis ever since. “RSI” stands for Relative Strength Index, and despite the name it doesn’t compare one asset to another — it compares a market to its own recent history. The indicator measures the ratio of average gains to average losses over a set number of periods (14 by default) and converts it into a value between 0 and 100.
When recent candles are dominated by gains, the RSI indicator rises toward 100; when losses dominate, it falls toward 0. Because it’s plotted in its own panel beneath the price, you read the two together: price on top, momentum below. The relative strength index in forex behaves the same on USD/INR as it does on any pair — it’s simply measuring how one-sided recent price action has been.
Overbought and oversold: what they really mean
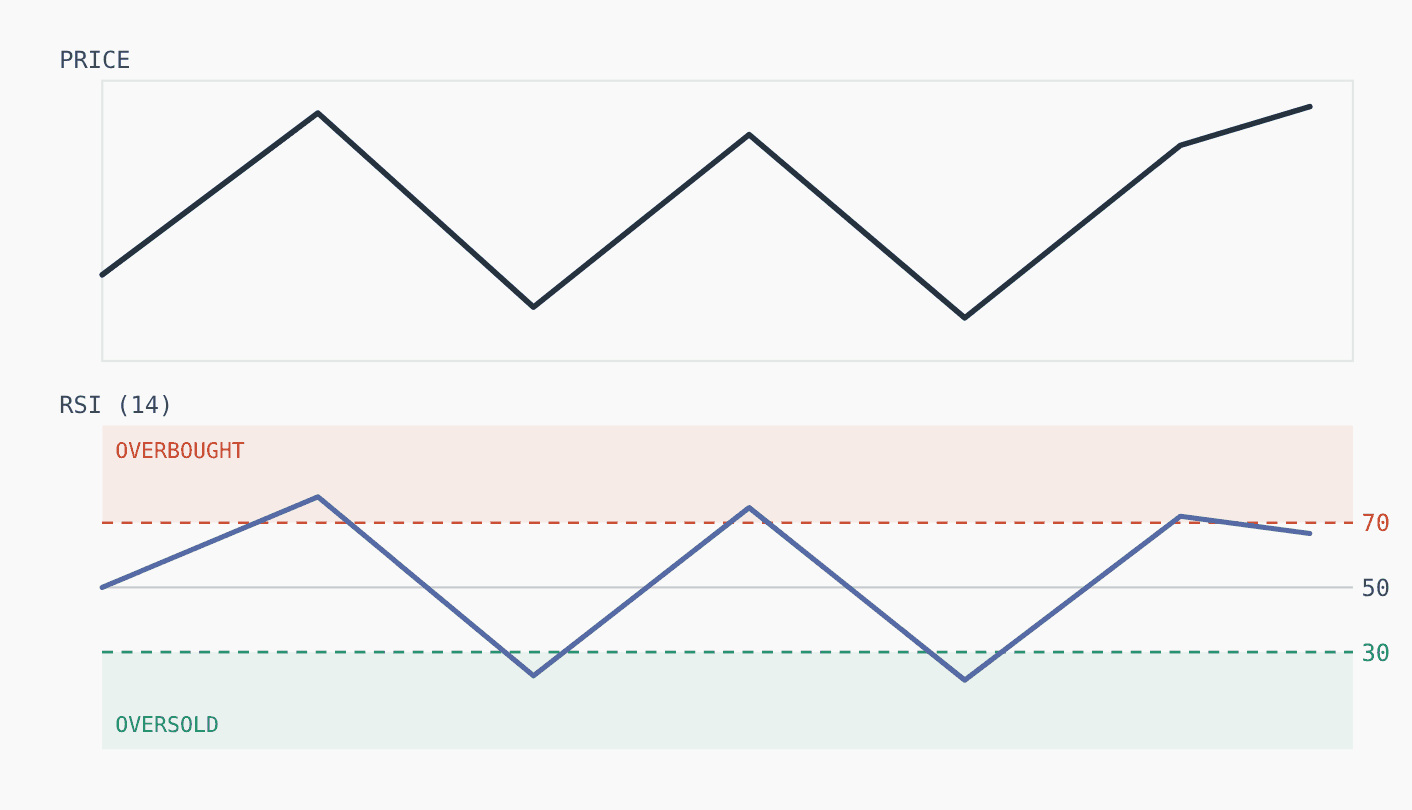
The two levels everyone learns first are 70 and 30. When the RSI indicator rises above 70, the market is “overbought” — the recent buying has been intense and a pause or pullback becomes more likely. Below 30, it’s “oversold,” and a bounce becomes more likely. Some forex traders use the stricter 80/20 levels to cut down on noise.
Here’s the trap that catches beginners: overbought does not mean “sell now,” and oversold does not mean “buy now.” In a strong trend, the RSI indicator can sit above 70 (or below 30) for a long time while price keeps running. Fading every overbought reading in an uptrend is one of the fastest ways to lose money in forex. The extreme is a warning to pay attention, not an automatic trade.
How to trade overbought and oversold
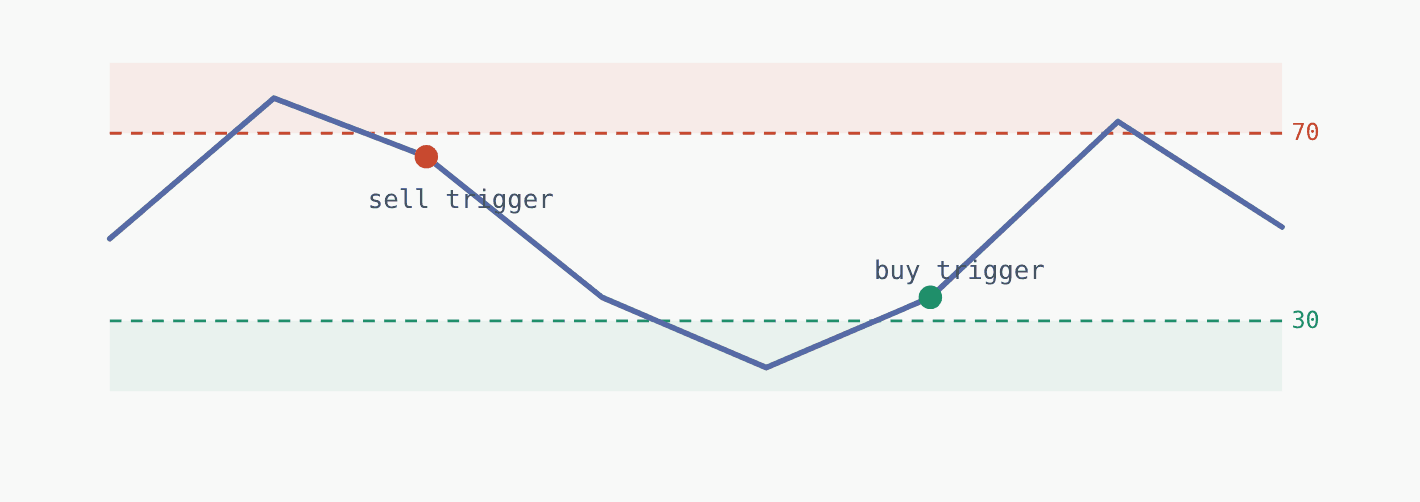
The reliable way to trade RSI extremes is to wait for confirmation and respect the trend. Instead of selling the moment RSI touches 70, wait for it to cross back below 70 — that exit from the zone is the actual signal that momentum has turned. The same applies in reverse for oversold: the buy trigger is RSI climbing back above 30.
This mean-reversion approach works best in ranging markets, where price bounces between support and resistance. In a clear trend, don’t fade the RSI indicator at all — instead use oversold pullbacks to join an uptrend, and overbought bounces to join a downtrend. Combining the signal with support and resistance, a trendline, or a candlestick pattern raises the odds further.
A simple RSI trading strategy using the 50 line
Beyond the extremes, the midpoint is quietly powerful. A clean RSI trading strategy uses the 50 level as a trend filter: when the RSI indicator holds above 50, momentum favours the bulls; when it stays below 50, the bears are in control. Many traders only take long setups while RSI is above 50 and short setups while it’s below, using the line to stay on the right side of the move.
A crossover of the 50 line can itself be a trigger — RSI pushing up through 50 after a base can confirm a fresh uptrend, while a drop back below 50 warns that momentum is fading. Used this way, the RSI indicator becomes less a “buy low, sell high” gimmick and more a momentum compass.
RSI divergence: the early-warning signal
The most valuable — and most advanced — use of the RSI indicator is spotting divergence, where price and momentum disagree. RSI divergence often appears before a reversal shows up in price itself, which is why experienced traders watch for it closely.
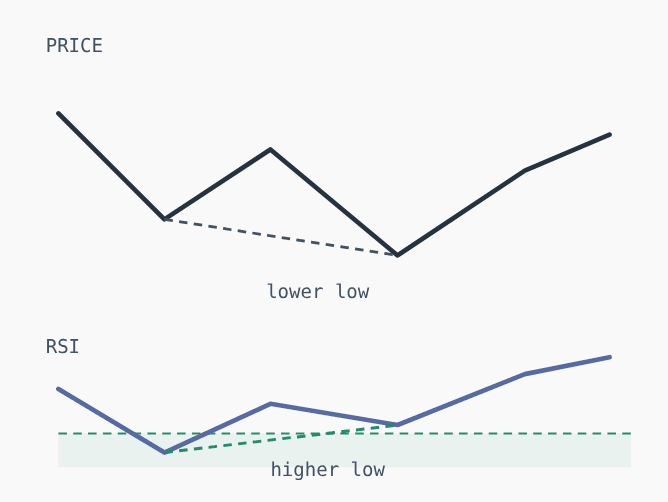
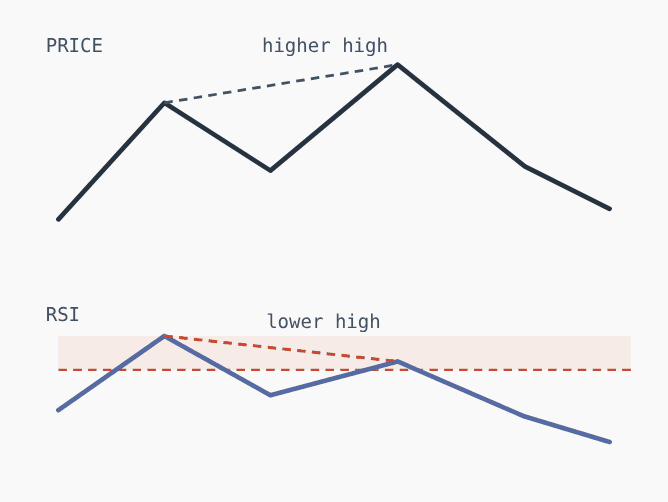
Divergence is a warning, not a trigger. It tells you momentum is draining from a move, but price can keep drifting before it turns. Wait for a confirming signal — a break of a short-term trendline, a candlestick reversal, or an RSI cross of the 50 line — before acting. Hidden divergence, where the pattern points the other way, can flag trend continuation, but classic divergence is the place to start.
RSI settings and timeframes
The default period is 14, and it’s a sensible starting point. A shorter setting (say 9) makes the RSI indicator more sensitive and produces more signals — and more false ones; a longer setting (21) is smoother and slower. Like every oscillator, RSI is more reliable on higher timeframes such as the 4-hour and daily, where there’s less random noise. Don’t over-optimise the number; consistency matters more than the perfect setting.
Common mistakes with the RSI indicator
- Fading strong trends. Selling every overbought reading in an uptrend fights the market; overbought can stay overbought for a long time.
- Treating 70/30 as instant signals. The touch is a heads-up; the cross back out of the zone is the trigger.
- Ignoring the trend. Use the 50 line and price structure to know whether to fade or follow.
- Trading divergence blindly. Divergence warns of fading momentum but needs confirmation before you act.
- Over-tuning the settings. Chasing the “best” RSI period usually curve-fits the past rather than improving the future.
The honest caveat:
the RSI indicator is a momentum tool built from past prices — it describes what has happened, not what will. Overbought markets can grow more overbought, oversold ones more oversold, and divergence can persist for many candles before (or without) a reversal. No single indicator has a reliable edge alone. Treat RSI as one input, strongest alongside trend, structure and confirmation, and always paired with a stop-loss.
For traders in India:
the relative strength index applies to exchange-traded pairs like USD/INR just as it does to any market. Resident Indians should trade forex only through NSE/BSE currency derivatives via a SEBI-registered broker; offshore spot forex is restricted under FEMA.
RSI cheat sheet
| READING | MEANING | HOW TO USE IT |
|---|---|---|
| Above 70 | Overbought | Pause/pullback more likely; sell only on cross back below 70, ideally in a downtrend or range |
| Around 50 | Trend midpoint | Above 50 favours bulls, below favours bears; use as a trend filter |
| Below 30 | Oversold | Bounce more likely; buy only on cross back above 30, ideally in an uptrend or range |
| Bullish divergence | Price lower low, RSI higher low | Early warning of a possible upturn — confirm before entry |
| Bearish divergence | Price higher high, RSI lower high | Early warning of a possible downturn — confirm before entry |
Frequently asked questions
What is the RSI indicator in forex?
The RSI indicator (Relative Strength Index) is a momentum oscillator that measures the speed and size of recent price changes on a 0–100 scale. In forex it helps gauge whether a pair is overbought, oversold, or trending.
What do overbought and oversold mean on RSI?
An RSI reading above 70 is overbought (buying has been intense, a pullback is more likely) and below 30 is oversold (selling has been intense, a bounce is more likely). They are warnings, not automatic buy or sell signals.
How do you trade RSI overbought and oversold?
Rather than acting the instant RSI hits 70 or 30, wait for it to cross back out of the zone, trade in the direction of the larger trend, and confirm with support/resistance or a price pattern.
What is RSI divergence?
RSI divergence is when price and the RSI indicator disagree — for example, price makes a higher high while RSI makes a lower high. It signals fading momentum and can precede a reversal.
What is the best RSI setting?
The default 14-period setting is a solid starting point. Shorter periods react faster but give more false signals; longer periods are smoother but slower. Consistency matters more than a “perfect” number.
Does RSI work better on certain timeframes?
Yes. Like most oscillators, the RSI indicator is generally more reliable on higher timeframes such as the 4-hour and daily, where there is less noise than on very short charts.
Can RSI stay overbought or oversold?
Absolutely. In a strong trend, RSI can remain above 70 or below 30 for extended periods while price keeps moving. This is why fading extremes without regard to the trend is risky.
Is RSI or MACD better?
Neither is strictly better; they measure different things. RSI gauges the strength of recent moves, while MACD tracks the relationship between moving averages. Many traders use them together for confirmation.