Introduction
One of the most frustrating beginner experiences is being stopped out by a small, random wiggle just before price moves in your direction. Often the stop wasn’t “wrong”, just too tight for how much the market normally moves. The ATR indicator in forex solves this by measuring that normal movement, so you can place stops outside everyday noise and size positions to match.
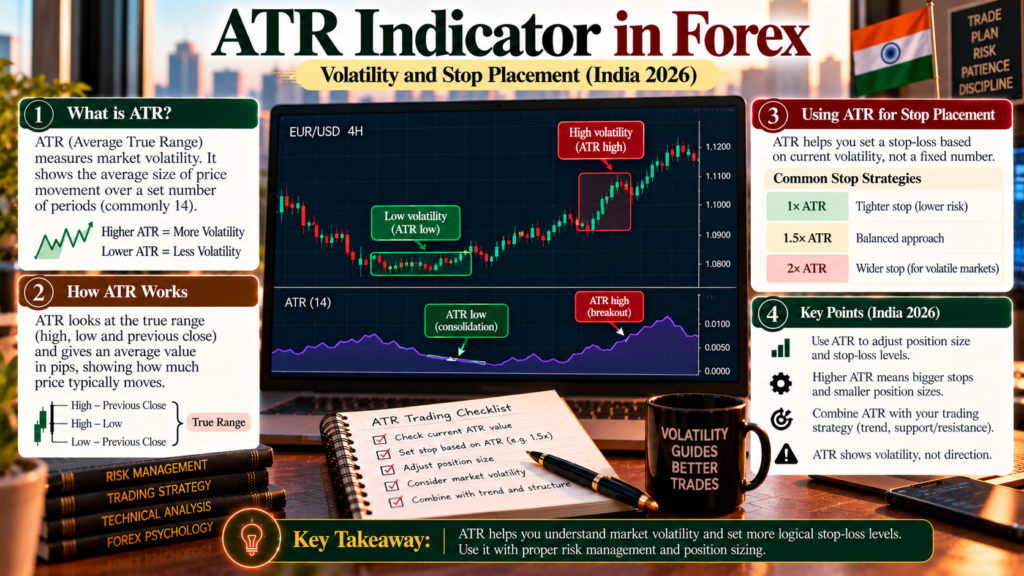
Quick answer: ATR (Average True Range) measures how much a currency pair typically moves per candle, including gaps, averaged over a period (usually 14). It doesn’t show direction, only volatility. Traders place stops a multiple of ATR (often 1.5–3×) away from entry, so stops widen when the market is volatile and tighten when it’s calm. Because a wider stop means more rupees at risk per lot, you then reduce position size to keep your risk per trade fixed.
Why this matters
- Fixed stops (e.g. “always 10 paise”) ignore changing volatility, so they are too tight in busy markets and too loose in quiet ones.
- ATR links stop distance and position size in a simple, repeatable way.
- Indian traders can apply ATR to permitted pairs such as USD/INR futures on NSE or BSE, through a SEBI-registered broker.
What is ATR?
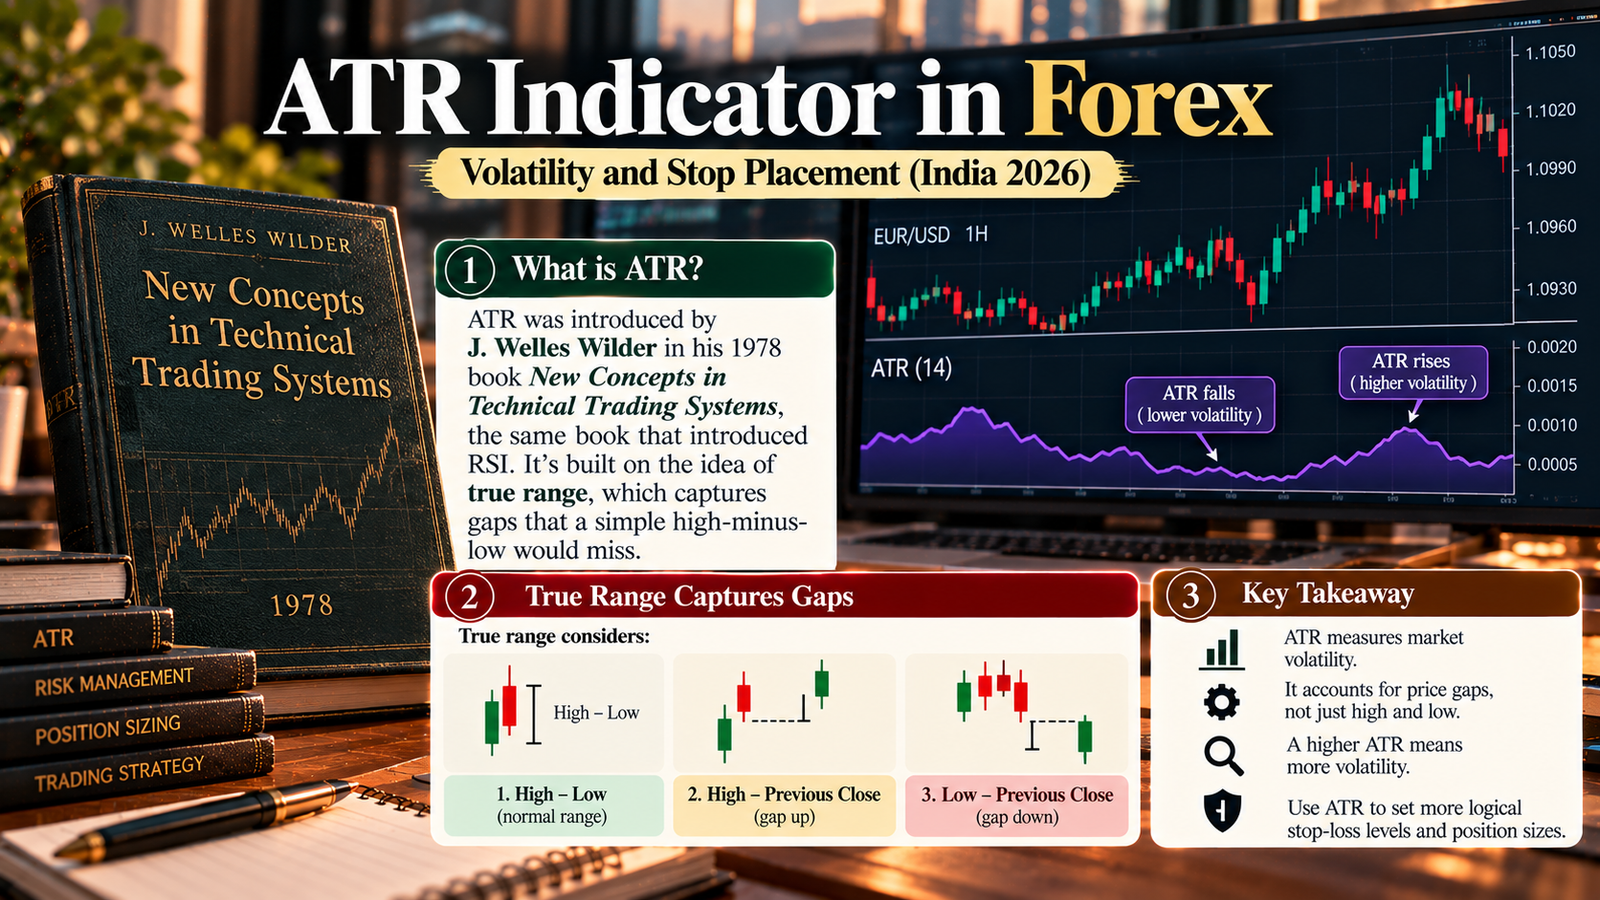
ATR was introduced by J. Welles Wilder in his 1978 book New Concepts in Technical Trading Systems, the same book that introduced RSI. It’s built on the idea of true range, which captures gaps that a simple high-minus-low would miss.
The formula
True range (TR) is the largest of:
- Today’s high − today’s low
- |Today’s high − yesterday’s close|
- |Today’s low − yesterday’s close|
ATR is the average of true range over N periods (usually 14):
- First ATR = simple average of the first 14 true ranges
- After that (Wilder smoothing): ATR today = (ATR yesterday × 13 + TR today) ÷ 14
Worked calculation (illustrative USD/INR daily bars)
For 14 days, USD/INR futures trade in a steady range, with true ranges of ₹0.18–₹0.22. On day 15, price gaps up: yesterday’s close was 95.62, and today’s high is 95.90, low 95.78, close 95.85.
| Step | Calculation | Result |
|---|---|---|
| ATR after 14 days | Average of 14 true ranges | ₹0.1986 |
| Day 15: high − low | 95.90 − 95.78 | ₹0.12 |
| Day 15: |high − previous close| | |95.90 − 95.62| | ₹0.28 |
| Day 15: |low − previous close| | |95.78 − 95.62| | ₹0.16 |
| Day 15 true range | Largest of the three | ₹0.28 |
| New ATR | (0.1986 × 13 + 0.28) ÷ 14 | ₹0.2044 |
Calculated in code; prices are illustrative.
Why true range matters: the day-15 candle itself was only 12 paise tall, but because of the gap the real move from the previous close was 28 paise. ATR includes that.
How to read ATR
| What you see | What it means |
|---|---|
| ATR rising | Volatility increasing; bigger candles and gaps |
| ATR falling | Volatility decreasing; quieter market |
| High ATR | Wider stops needed; smaller position size for the same risk |
| Low ATR | Tighter stops possible; possibly a calm period before a breakout |
| ATR in price units | For USD/INR, ATR is in rupees per dollar (e.g. ₹0.20 = 20 paise) |
Key point: ATR says nothing about direction. A rising ATR can mean a sharp rally or a sharp fall.
ATR is measured in price units, so an ATR of ₹0.20 on USD/INR isn’t directly comparable with ATR on another pair. To compare, divide ATR by price to get a percentage.
Using ATR to place stops
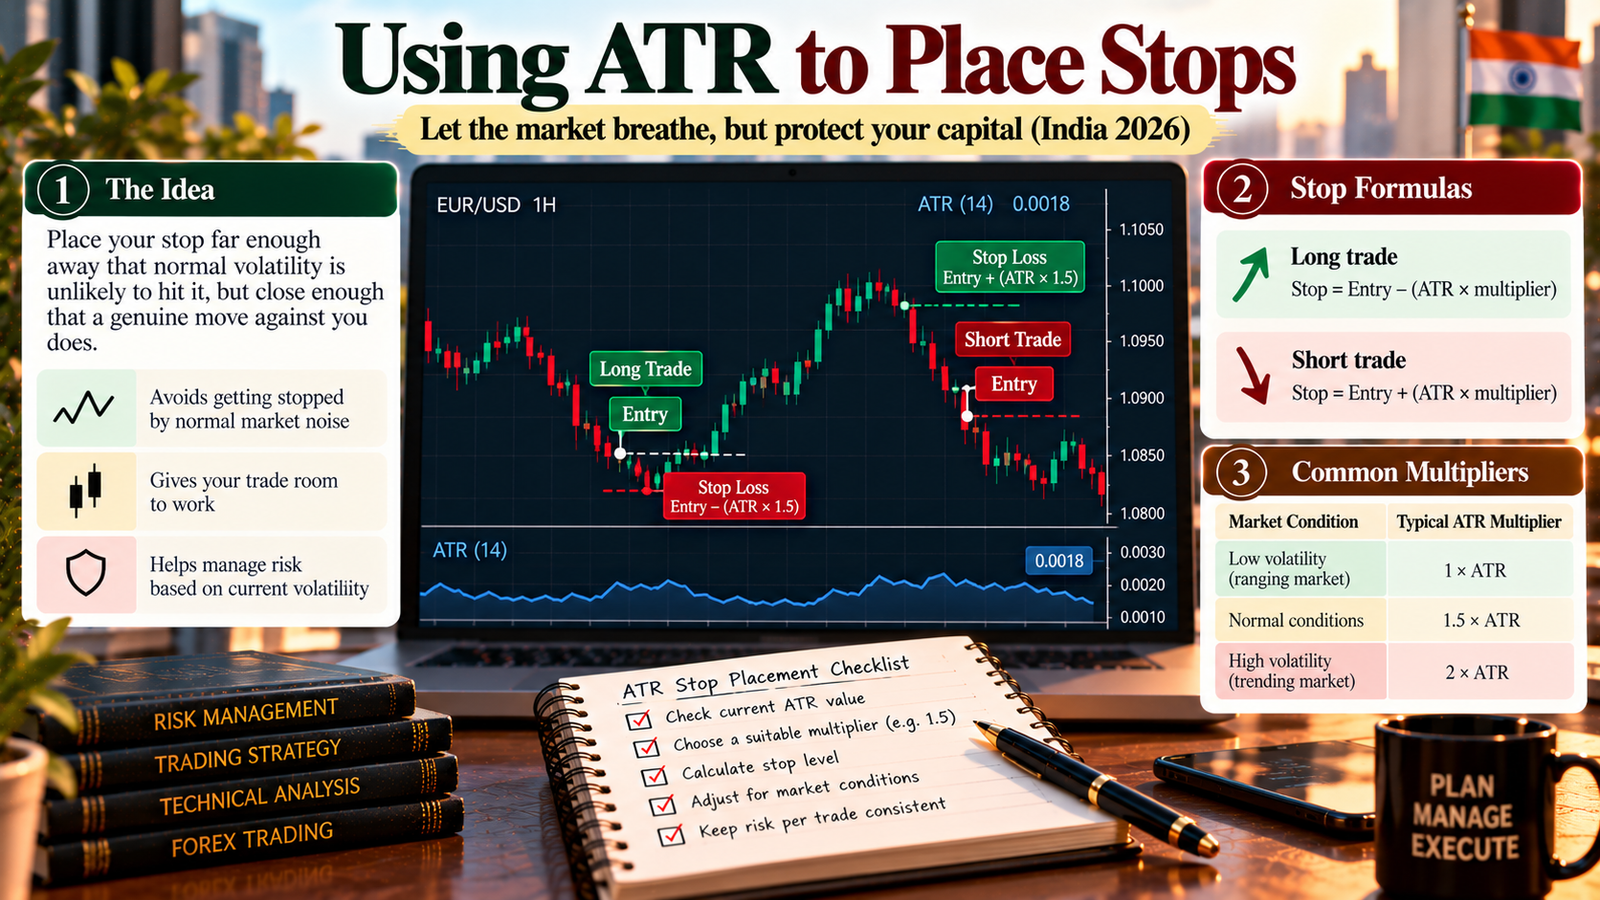
The idea is simple: place your stop far enough away that normal volatility is unlikely to hit it, but close enough that a genuine move against you does.
Long trade: Stop = Entry − (ATR × multiplier) Short trade: Stop = Entry + (ATR × multiplier)
Worked example: choosing a multiplier (illustrative)
USD/INR futures, long entry at 95.85, ATR ≈ ₹0.20, capital ₹1,00,000, risk per trade 1% = ₹1,000. One NSE lot is $1,000, so a ₹0.01 move = ₹10 per lot.
| ATR multiple | Stop price | Risk per lot | Lots for ₹1,000 risk | Actual risk |
|---|---|---|---|---|
| 1.0× | 95.65 | ₹200 | 5 | ₹1,000 |
| 1.5× | 95.55 | ₹300 | 3 | ₹900 |
| 2.0× | 95.45 | ₹400 | 2 | ₹800 |
| 3.0× | 95.25 | ₹600 | 1 | ₹600 |
Calculated in code; lots are rounded down so risk never exceeds ₹1,000.
The trade-off: a wider stop is less likely to be hit by noise, but it means fewer lots for the same risk. Your rupee risk stays roughly constant; only the position size changes.
Choosing a multiplier
| Multiple | Typical use | Trade-off |
|---|---|---|
| 1× ATR | Short-term trades, tight structure | Hit more often by normal noise |
| 1.5–2× ATR | Common for swing trades | Balance between room and size |
| 2.5–3× ATR | Trend trades, trailing stops | More room, smaller size, bigger rupee move to target |
These are common conventions, not rules. Ideally, combine ATR with structure: put the stop beyond a swing high or low, and use ATR to check it isn’t unreasonably tight or wide.
ATR stops vs fixed stops
| Fixed stop (e.g. always 20 paise) | ATR-based stop | |
|---|---|---|
| Adapts to volatility | No | Yes |
| In a quiet market | May be too wide, wasting risk | Tightens automatically |
| In a volatile market | Often too tight; hit by noise | Widens automatically |
| Position size | Constant lots, changing risk profile | Lots adjust to keep rupee risk steady |
| Simplicity | Very simple | Slightly more calculation |
When volatility changes
Using a 2× ATR stop with ₹1,000 risk:
| ATR | Stop distance | Risk per lot | Lots |
|---|---|---|---|
| ₹0.10 (calm) | ₹0.20 | ₹200 | 5 |
| ₹0.20 (normal) | ₹0.40 | ₹400 | 2 |
| ₹0.40 (volatile) | ₹0.80 | ₹800 | 1 |
When the market gets wild, ATR automatically makes you trade smaller, which is one of its most useful features.
ATR trailing stops and the chandelier exit
A trailing stop moves in your favour as price moves. One well-known version, the chandelier exit (commonly credited to Chuck LeBeau), hangs a stop a multiple of ATR below the highest high since entry, often 3× ATR over 22 periods, for long trades.
Long: Trailing stop = Highest high since entry − (ATR × 3)
The calculated level can dip if ATR rises, so most traders apply it as a ratchet: the stop only moves up, never down, locking in more profit as a trend extends.
Other uses of ATR
- Targets: some traders set targets at 2–3× ATR to keep expectations realistic for the current volatility.
- Filters: avoiding new breakout trades when ATR is unusually low, or reducing size when ATR spikes around news.
- Daily range check: if price has already moved more than the typical daily ATR, chasing the move may offer poor reward-to-risk.
Step-by-step: ATR stop and size
- Add ATR (14) to your chart on your trading time frame.
- Identify the structural stop level (beyond a swing high or low).
- Check that distance against ATR, typically aiming for 1.5–3× ATR.
- Calculate risk per lot: stop distance × lot size.
- Divide your rupee risk per trade by risk per lot, and round down.
- Place the stop with the order.
- Optionally trail the stop using ATR as the trade moves in your favour.
- Record ATR, stop distance and result in your journal.
Expert analysis
Fact: ATR, introduced by Wilder in 1978, averages true range, the largest of high−low, |high−previous close| and |low−previous close|, over a period, usually 14. It measures volatility, not direction.
Analysis: ATR’s real value isn’t as a signal but as a risk tool. It turns a vague question (“where should my stop go?”) into a consistent rule, and it links stop distance directly to position size. The biggest benefit for beginners is automatic de-risking: when volatility rises, ATR-based sizing makes you trade smaller without any extra decision.
Opinion: A practical beginner approach is to set stops at a logical structural level, check that the distance is roughly 1.5–3× ATR, and always size positions from fixed rupee risk. Avoid shrinking the multiplier just to trade more lots; that brings back the noise problem ATR was meant to solve.
Common mistakes
- Using ATR as a direction signal. It measures volatility only.
- Using a wide ATR stop but keeping the same lot size, which quietly multiplies risk.
- Picking a tiny multiplier (e.g. 0.5×) to fit more lots, and getting stopped by noise.
- Mixing time frames: using daily ATR for a 5-minute trade, or the reverse.
- Ignoring structure: placing a pure ATR stop just above an obvious swing low.
- Letting a trailing stop move backwards when ATR expands.
- Forgetting news: ATR is backward-looking and won’t anticipate a data spike.
Myths vs facts
| Myth | Fact |
|---|---|
| “High ATR means price will rise.” | ATR measures volatility, not direction. |
| “A wider stop means more risk.” | Not if you reduce position size to keep rupee risk constant. |
| “There’s one correct ATR multiplier.” | 1.5–3× is common, but the right choice depends on your strategy and time frame. |
| “ATR prevents all stop-outs.” | It reduces noise-driven stops; genuine moves and gaps will still hit stops. |
| “ATR predicts the next day’s range.” | It describes recent average movement; actual ranges vary widely, especially around news. |
Key takeaways
- ATR measures average true range, capturing gaps as well as intraday moves.
- True range is the largest of high−low, |high−previous close| and |low−previous close|; ATR usually averages 14 periods with Wilder smoothing.
- Place stops a multiple of ATR from entry (often 1.5–3×), ideally combined with structure.
- Size positions from fixed rupee risk: wider ATR stops mean fewer lots. With ATR ₹0.20 and a 2× stop, ₹1,000 risk allowed 2 USD/INR lots.
- ATR-based trailing stops, such as the chandelier exit, help lock in trend profits.
- ATR doesn’t show direction and won’t anticipate news-driven spikes.
FAQs
- What is the ATR indicator in forex? Average True Range: a volatility indicator that shows how much a currency pair typically moves per period, including gaps.
- Who created ATR? J. Welles Wilder, in his 1978 book New Concepts in Technical Trading Systems.
- How is true range calculated? It’s the largest of: high − low, |high − previous close|, and |low − previous close|.
- How is ATR calculated? Average the first 14 true ranges, then update with Wilder’s smoothing: (previous ATR × 13 + current TR) ÷ 14.
- Does ATR show trend direction? No. ATR only measures volatility. It can rise in both rallies and sell-offs.
- How do I use ATR for a stop-loss? For a long trade, stop = entry − (ATR × multiplier). For a short, stop = entry + (ATR × multiplier).
- What ATR multiplier should I use? 1.5–3× is common. Lower multiples get hit more often by noise; higher multiples need smaller position sizes.
- How does ATR affect position size? A wider ATR-based stop means more rupees at risk per lot, so you trade fewer lots to keep your total risk fixed.
- What is a good ATR setting? 14 periods is the standard. Use the ATR from the same time frame you’re trading on.
- What is the chandelier exit? An ATR-based trailing stop, commonly credited to Chuck LeBeau, placed a multiple of ATR (often 3×) below the highest high for long trades.
- Is an ATR stop better than a fixed stop? It adapts to changing volatility, so it’s usually more consistent. Combining it with structure (swing highs and lows) works best.
- What does a rising ATR mean? Volatility is increasing. Expect bigger moves and consider smaller position sizes.
- What does a low ATR mean? The market is quiet. Volatility may expand later, so be ready for larger moves.
- Can I use ATR on USD/INR? Yes, on NSE or BSE USD/INR futures, traded through a SEBI-registered broker. ATR is shown in rupees per dollar.
- Can ATR be used for profit targets? Some traders set targets at 2–3× ATR to keep them realistic for current volatility.
- Why did my ATR stop still get hit? ATR reduces noise-driven stop-outs but can’t prevent genuine moves against you or news-driven spikes.
- How do I compare ATR across currency pairs? Divide ATR by price to get a percentage, since raw ATR is measured in each pair’s price units.