Introduction
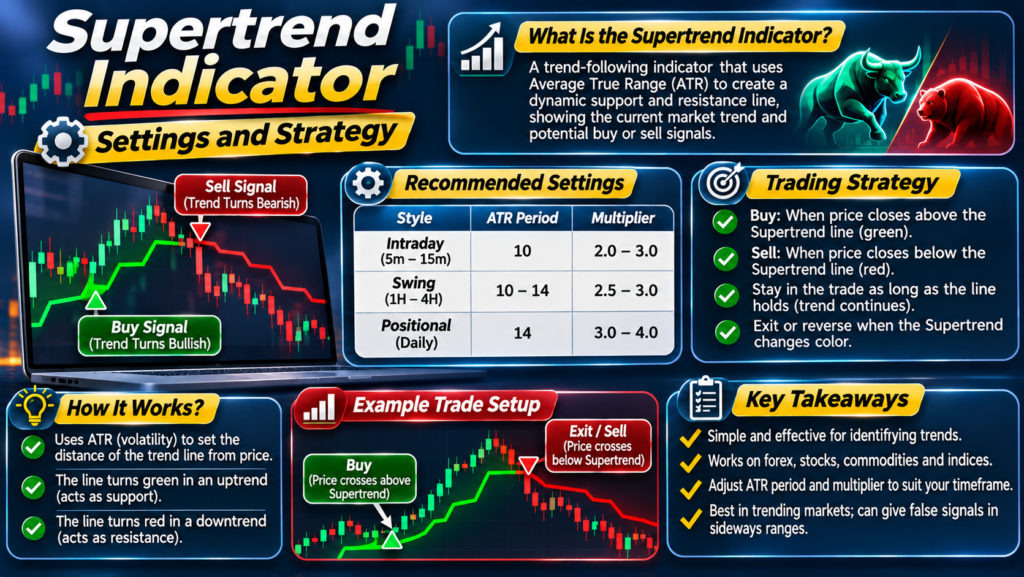
Some indicators are complicated to read. The Supertrend indicator is the opposite. It draws a single line on your chart: green below price in an uptrend, red above price in a downtrend. When the line flips from one side to the other, the trend may be changing.
That simplicity has made it one of the most popular tools among Indian traders, especially for Nifty, Bank Nifty and intraday stock trading, and it works just as well on currency charts. It can act as a trend filter, an entry signal and a trailing stop at the same time.
This guide explains:
- What the Supertrend is and how it is calculated
- How to read buy and sell signals
- The best settings for different styles
- Practical strategies with filters
- A worked example, limitations and common mistakes
What Is the Supertrend Indicator?
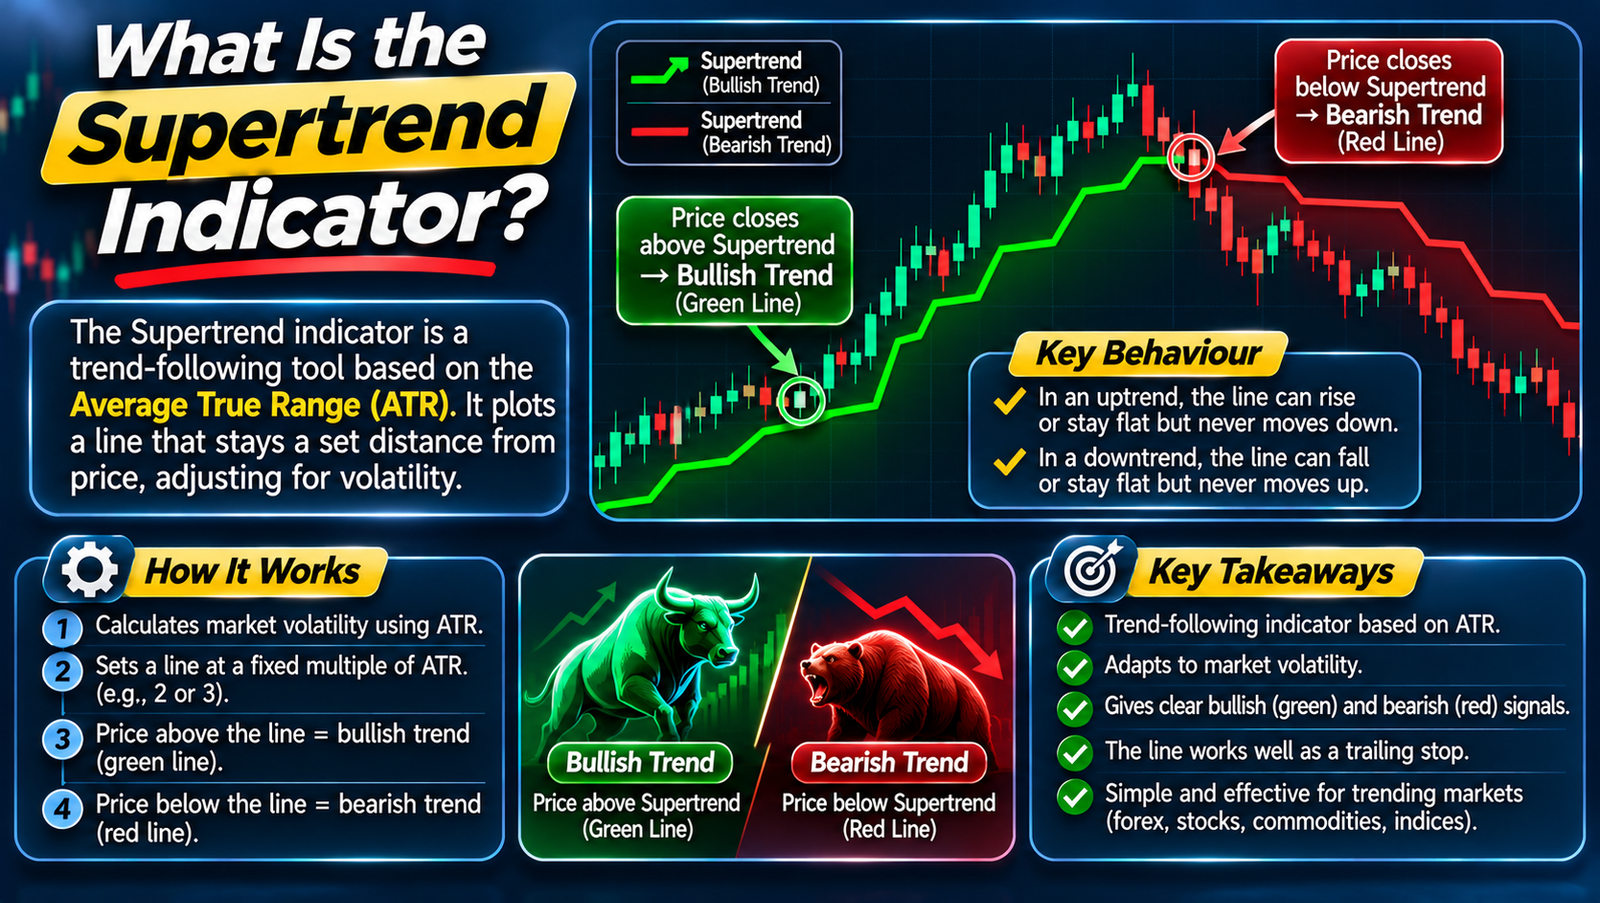
The Supertrend indicator is a trend-following tool based on the Average True Range (ATR). It plots a line that stays a set distance from price, adjusting for volatility. When price closes above the line, the trend is considered bullish and the line turns green below price. When price closes below it, the trend is bearish and the line turns red above price.
The line only moves in the direction of the trend. In an uptrend, it can rise or stay flat but never moves down, which is what makes it useful as a trailing stop.
How the Supertrend Indicator Is Calculated
The Supertrend uses two inputs: an ATR period and a multiplier.
| Step | Calculation |
|---|---|
| Midpoint | (High + Low) ÷ 2 |
| Basic upper band | Midpoint + (Multiplier × ATR) |
| Basic lower band | Midpoint − (Multiplier × ATR) |
| Final bands | Adjusted so the lower band never falls in an uptrend and the upper band never rises in a downtrend |
| Supertrend line | Lower band in an uptrend; upper band in a downtrend |
Simple calculation example
Suppose on EUR/USD:
- High: 1.1680, Low: 1.1640, so the midpoint is 1.1660
- ATR (10 periods): 0.0020 (20 pips)
- Multiplier: 3
Basic upper band = 1.1660 + (3 × 0.0020) = 1.1720
Basic lower band = 1.1660 − (3 × 0.0020) = 1.1600
If the market is in an uptrend, the Supertrend line sits near 1.1600 (adjusted by the final band rules). If price closes below that line, the indicator flips bearish and the line moves above price.
Your charting platform handles these calculations automatically.
How to Read the Supertrend Indicator
| Signal | What it means |
|---|---|
| Line turns green and moves below price | Buy signal; uptrend may be starting |
| Line turns red and moves above price | Sell signal; downtrend may be starting |
| Price stays above a rising green line | Uptrend continues |
| Price stays below a falling red line | Downtrend continues |
| Frequent flips | Choppy, sideways market; signals less reliable |
The line itself also acts as dynamic support in uptrends and dynamic resistance in downtrends.
Best Supertrend Indicator Settings
The default on many platforms is an ATR period of 10 and a multiplier of 3. Traders adjust these to suit their style:
| Setting (ATR, multiplier) | Behaviour | Suits |
|---|---|---|
| 7, 3 | Responsive, popular for intraday | Short-term and intraday traders |
| 10, 3 | Balanced default | Most traders |
| 10, 2 | Tighter, more signals and more whipsaws | Active traders in trending markets |
| 14, 3 or 20, 4 | Slower, fewer but steadier signals | Swing and position traders |
- Lower multiplier: The line sits closer to price, giving earlier signals but more false flips.
- Higher multiplier: The line sits further away, filtering noise but reacting later.
- Shorter ATR period: Adapts faster to recent volatility.
- Longer ATR period: Smoother and more stable.
There is no single best setting for the Supertrend indicator. Backtest your chosen market and timeframe before trading live.
Supertrend Indicator Trading Strategies
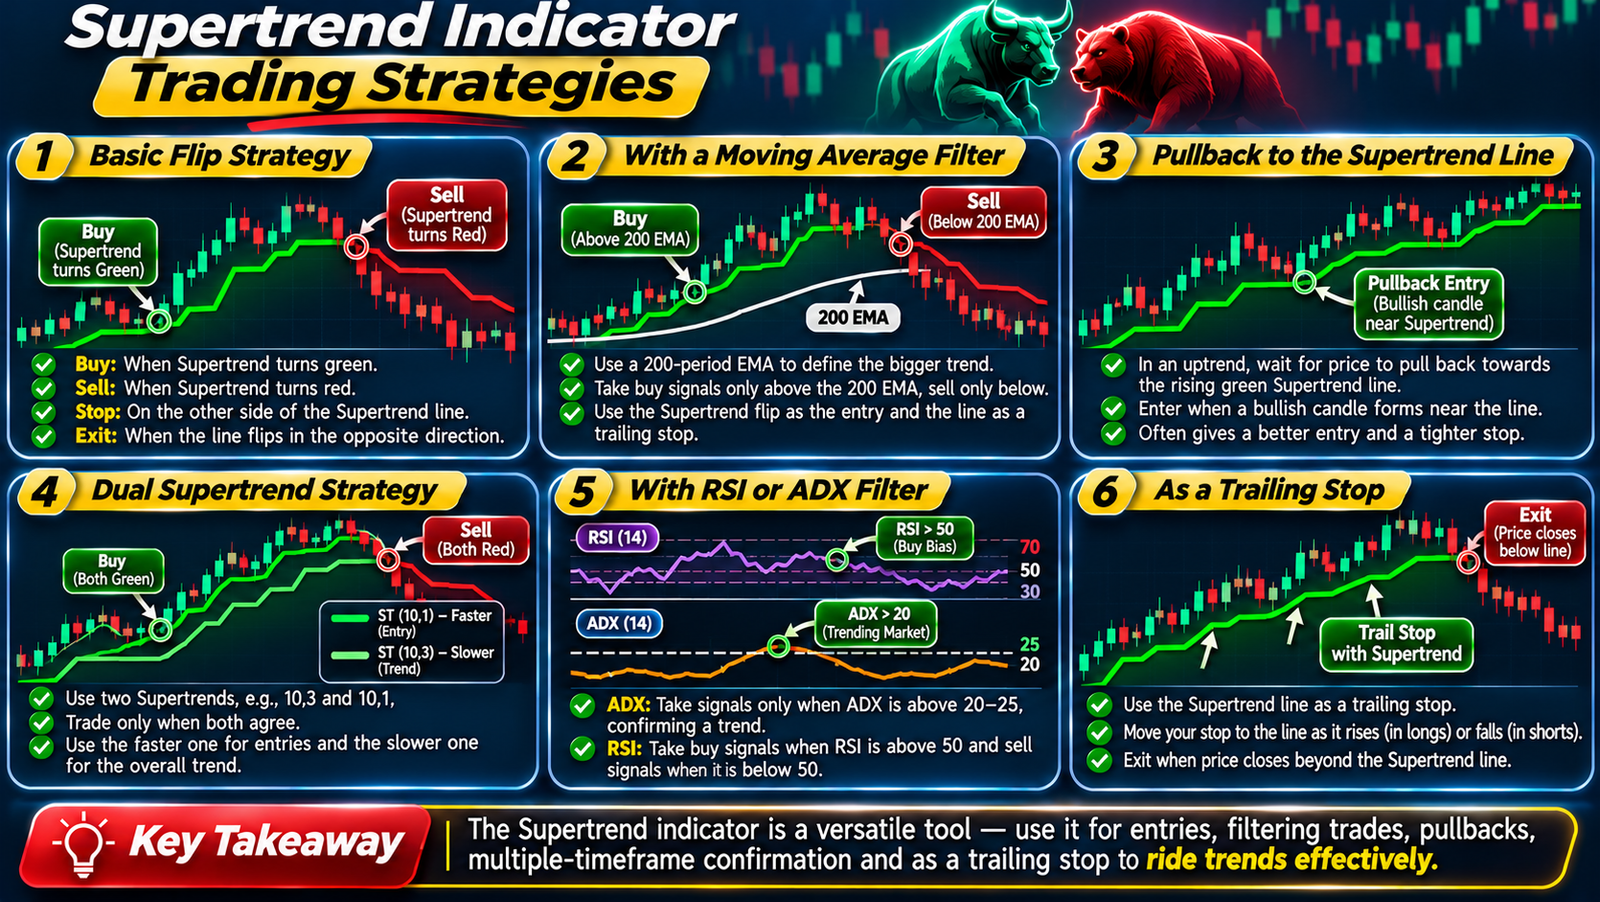
1. Basic flip strategy
- Buy when the Supertrend turns green below price.
- Sell when it turns red above price.
- Stop: On the other side of the Supertrend line.
- Exit: When the line flips in the opposite direction.
Simple and clear, but in ranging markets it can produce a series of small losses.
2. Supertrend with a moving average filter
- Use a 200-period EMA to define the bigger trend.
- Take only buy signals when price is above the 200 EMA, and only sell signals when price is below it.
- Use the Supertrend flip as the entry trigger and the line as a trailing stop.
This filter removes many counter-trend signals.
3. Pullback to the Supertrend line
Instead of buying the flip, wait for price to pull back towards a rising green Supertrend line in an uptrend. Enter when a bullish candle forms near the line. This often gives a better entry price and a tighter stop.
4. Dual Supertrend strategy
Some traders use two Supertrends, for example 10,3 and 10,1. Trade only when both agree, and use the faster one for entries and the slower one for the overall trend.
5. Supertrend with RSI or ADX
- ADX: Take signals only when ADX is above 20 to 25, confirming a trending market.
- RSI: Take buy signals when RSI is above 50 and sell signals when it is below 50, to confirm momentum.
6. Supertrend as a trailing stop
Even if you use another method to enter trades, the Supertrend line works well as a trailing stop. Move your stop to the line as it rises (in longs) or falls (in shorts) and exit when price closes beyond it.
Worked Example of a Supertrend Indicator Trade
Suppose EUR/USD is on the 4-hour chart, with the Supertrend set to 10,3 and price above the 200 EMA.
- After a pullback, the Supertrend flips green, with the line at 1.1595.
- The trader buys at 1.1645 on the next candle open.
- The initial stop goes just below the Supertrend line at 1.1595 (50 pips of risk).
- Over the next week, price trends higher, and the Supertrend line rises with it. The trader trails the stop to the line after each candle closes.
- Price eventually closes below the Supertrend line, which flips red at 1.1760. The trader exits.
The trade gains 115 pips on 50 pips of initial risk, about 2.3 times the risk. The Supertrend provided the entry, the initial stop and the exit.
This example is illustrative and uses hypothetical prices.
Supertrend Indicator vs Moving Averages and Parabolic SAR
| Feature | Supertrend | Moving average | Parabolic SAR |
|---|---|---|---|
| Based on | ATR (volatility) | Average price | Price and an acceleration factor |
| Signal | Line flips side and colour | Price crosses the average | Dots flip side |
| Trailing stop | Yes, volatility-adjusted | Possible, less precise | Yes, accelerates over time |
| Weakness | Whipsaws in ranges | Lag | Whipsaws and early exits |
The Supertrend indicator’s advantage is that it adapts to volatility through ATR, so the stop distance widens in volatile markets and tightens in calm ones.
Best Timeframes and Markets for the Supertrend Indicator
- Intraday (5 to 15 minutes): Popular for index futures and liquid stocks, usually with 7,3 or 10,3.
- Swing (1-hour to 4-hour): Works well on forex pairs and indices with 10,3.
- Position (daily and weekly): Use slower settings, such as 14,3 or 20,4, to follow major trends.
- Markets: Forex, indices, stocks, commodities and crypto. It performs best in trending markets.
Position Sizing With the Supertrend Indicator
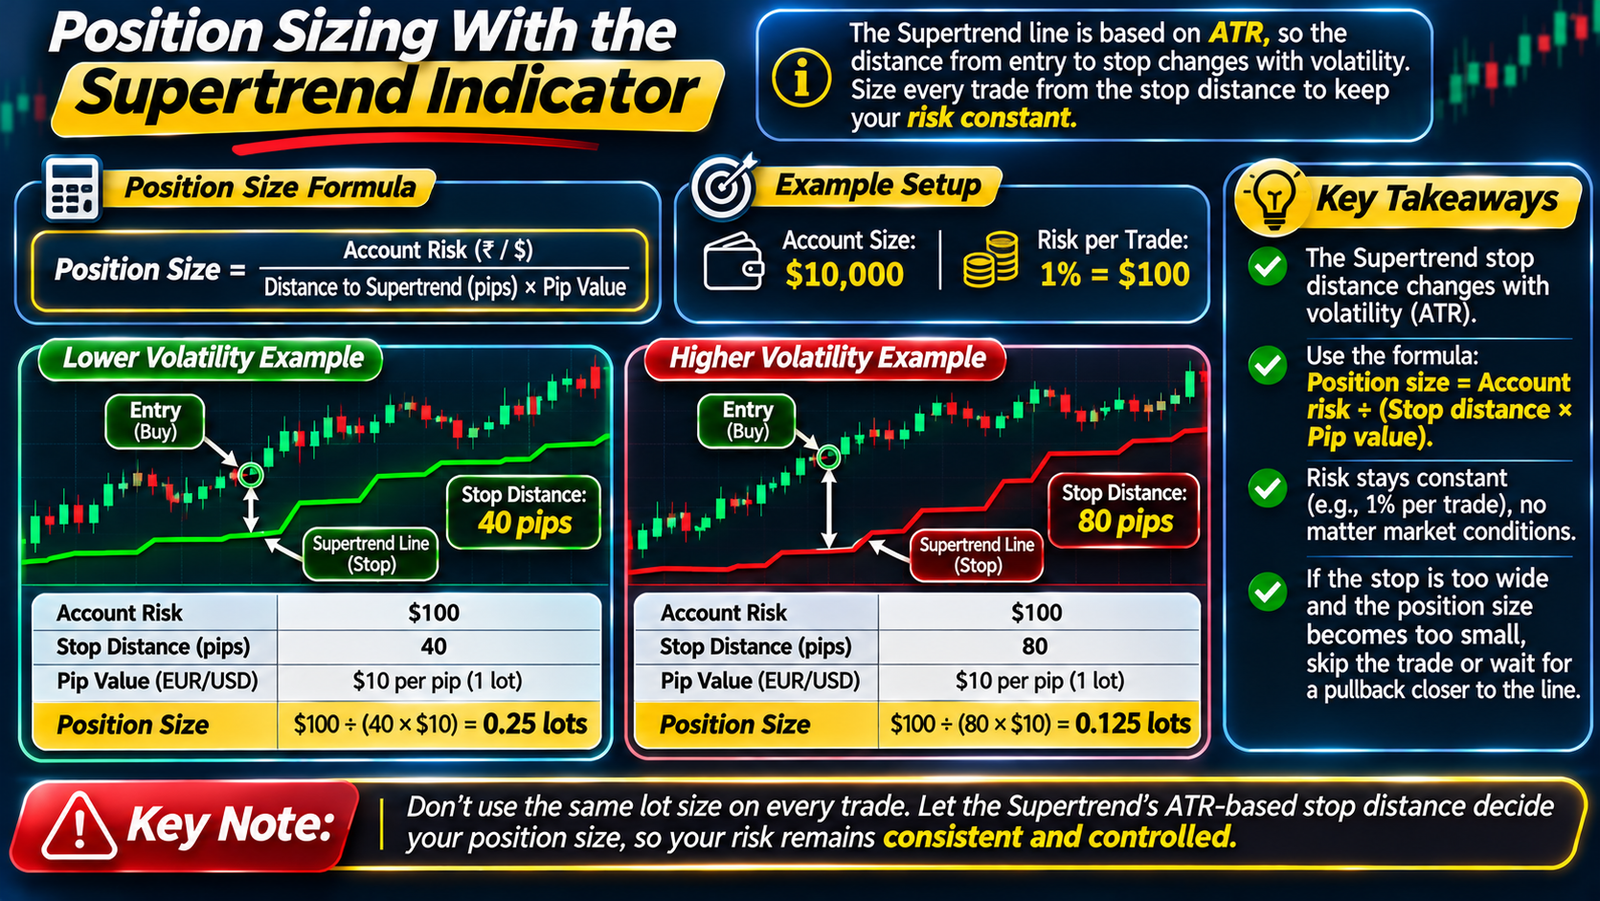
Because the Supertrend line is based on ATR, the distance from entry to stop changes with volatility. In a quiet market, the line may be 30 pips away; in a volatile one, it may be 80 pips away. Using the same lot size on every trade would mean taking much bigger risks on volatile days.
The solution is to size every trade from the stop distance:
Position size = Account risk ÷ (Distance to Supertrend line in pips × Pip value)
For example, with a 10,000accountrisking1%(100):
- If the line is 40 pips away on EUR/USD (about $10 per pip per standard lot), position size is $100 ÷ (40 × $10) = 0.25 lots.
- If the line is 80 pips away, position size falls to 0.125 lots.
This keeps risk constant while letting the Supertrend indicator adapt to market conditions. If the stop distance is so wide that the position becomes too small to be worthwhile, skip the trade or wait for a pullback closer to the line.
Limitations of the Supertrend Indicator
- Whipsaws in ranges: In sideways markets, the line flips often, producing losses.
- Lag: Signals come after the trend has already started, so part of the move is missed.
- Wide stops in volatile markets: ATR-based stops can be large, requiring smaller position sizes.
- Gaps: On instruments that gap, price can jump past the line.
- Not a standalone system: Best used with trend filters, price action and risk management.
Common Supertrend Indicator Mistakes
- Trading every flip: In choppy markets, this leads to many small losses.
- Ignoring the higher-timeframe trend: Use a filter such as the 200 EMA or a higher-timeframe Supertrend.
- Changing settings constantly: Pick settings, test them and stick with them.
- Oversizing with wide stops: Adjust position size so the stop distance matches your risk limit.
- Exiting too early: Let the Supertrend line do its job as a trailing stop in strong trends.
Using the Supertrend Indicator in Indian Markets
The Supertrend is one of the most widely used indicators on Indian trading platforms.
- Nifty and Bank Nifty futures: Many intraday traders use 7,3 or 10,3 on 5 to 15-minute charts, often combined with VWAP.
- Stocks: Swing traders use daily charts with 10,3 to ride trends.
- USD/INR: The pair often trades in ranges because the RBI smooths volatility, so the Supertrend can whipsaw. Use higher timeframes and an ADX filter. Each paise is worth ₹10 per lot.
- Cross-currency futures: EUR/USD, GBP/USD and USD/JPY on NSE trend more, which suits the Supertrend on 1-hour to daily charts.
Indian residents should trade currencies only through recognised exchanges such as NSE and BSE via SEBI-registered brokers. Leveraged forex trading on offshore platforms is not permitted under FEMA.
Supertrend Indicator Checklist
- Is the market trending, confirmed by ADX or higher-timeframe structure?
- Does the Supertrend signal agree with the bigger trend filter?
- Is the entry near the Supertrend line rather than far above or below it?
- Is the stop beyond the Supertrend line?
- Is position size adjusted for the stop distance?
- Will I trail the stop with the line and exit on a flip?
FAQs
What is the Supertrend indicator?
It is an ATR-based trend-following indicator that plots a line below price in uptrends and above price in downtrends, flipping when the trend may be changing.
What are the best Supertrend settings?
The default is 10,3. Intraday traders often use 7,3, while swing and position traders may use 14,3 or 20,4.
Is the Supertrend good for intraday trading?
Yes, it is widely used for intraday trading, especially on index futures, but it works best when combined with a trend filter.
Can I use the Supertrend as a stop-loss?
Yes. Many traders use the Supertrend line as a trailing stop-loss, exiting when price closes beyond it.
Does the Supertrend repaint?
Standard versions do not repaint once a candle closes, but the line can change during an open candle. Wait for the close before acting on a signal.
Conclusion
The Supertrend indicator is a simple, volatility-adjusted trend tool that gives clear buy and sell signals and doubles as a trailing stop. Its ATR-based design helps it adapt to changing market conditions, which is why it is so popular with Indian and global traders alike.
Use it in trending markets, filter signals with a higher-timeframe trend or ADX, size positions according to the stop distance and let the line trail your stops. Test your settings on historical charts and a demo account before trading live.