Introduction
Momentum indicators help traders answer a simple question: is price moving unusually far from its normal level? The Commodity Channel Index, better known as the CCI indicator, was designed to do exactly that.
Despite its name, the CCI is not limited to commodities. Traders use it on forex, stocks, indices and crypto to spot overbought and oversold conditions, confirm trends, find pullback entries and detect divergence.
This guide explains:
- What the CCI is and where it came from
- How it is calculated
- How to read the +100, −100 and zero levels
- The best settings for different styles
- Practical strategies, a worked example and common mistakes
What Is the CCI Indicator?
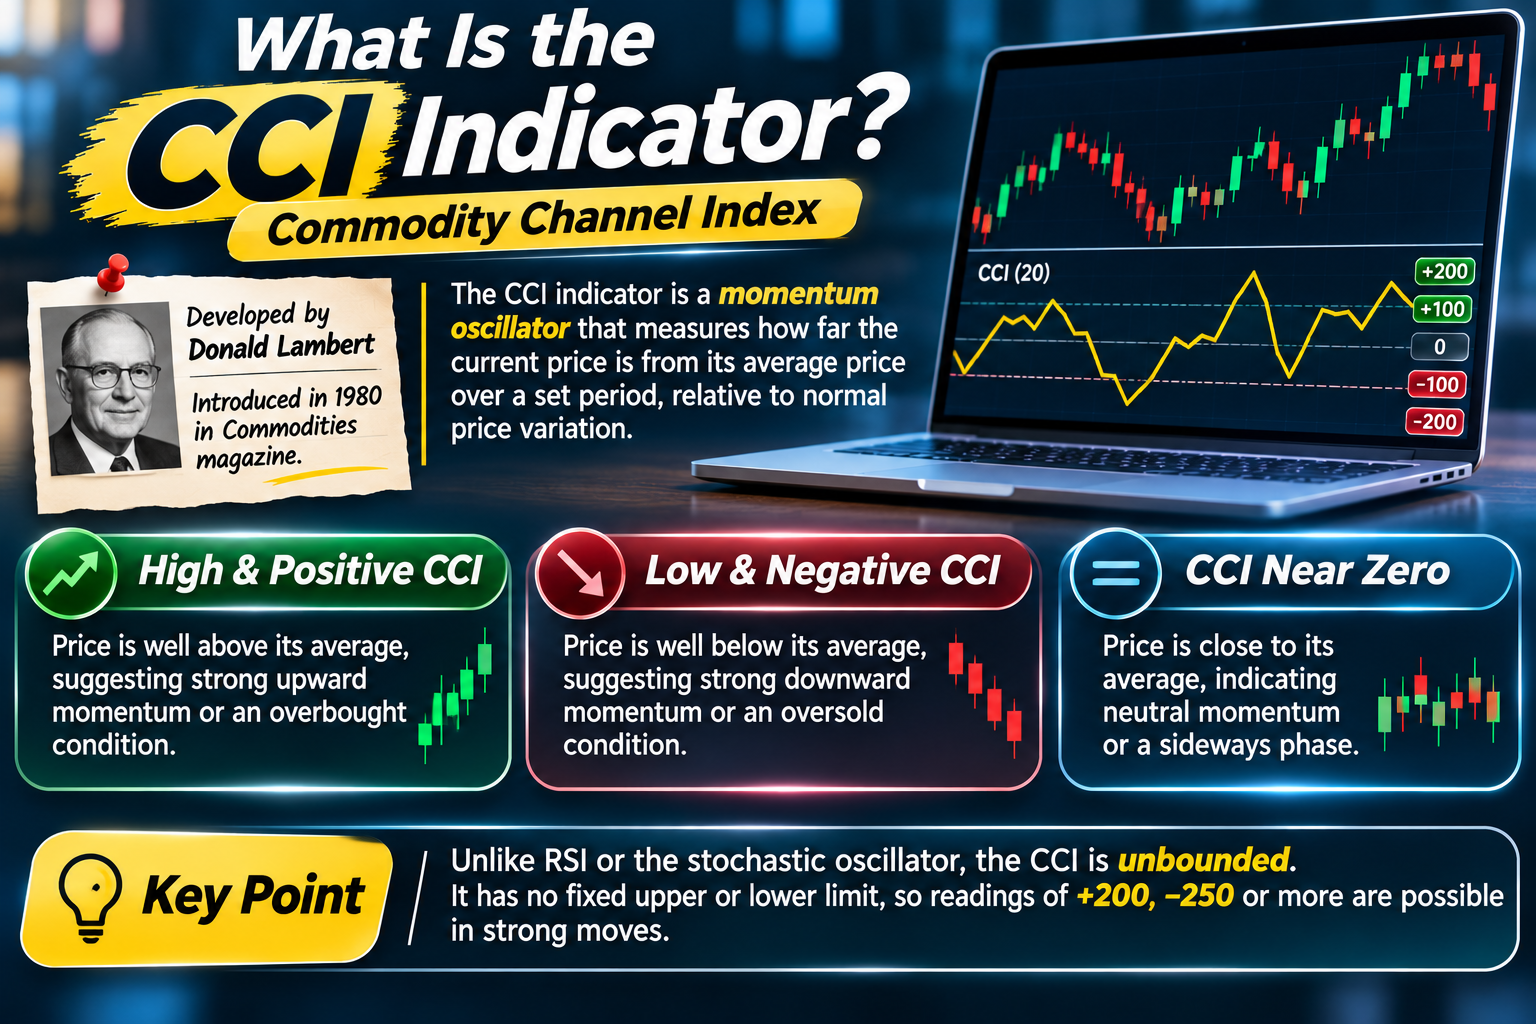
The CCI indicator is a momentum oscillator developed by Donald Lambert and introduced in 1980 in Commodities magazine. It measures how far the current price is from its average price over a set period, relative to normal price variation.
- When the CCI is high and positive, price is well above its average, suggesting strong upward momentum or an overbought condition.
- When the CCI is low and negative, price is well below its average, suggesting strong downward momentum or an oversold condition.
- When the CCI is near zero, price is close to its average.
Unlike RSI or the stochastic oscillator, the CCI is unbounded. It has no fixed upper or lower limit, so readings of +200, −250 or more are possible in strong moves.
The CCI Indicator Formula
The CCI uses the typical price, a moving average and the mean deviation:
| Step | Calculation |
|---|---|
| Typical price (TP) | (High + Low + Close) ÷ 3 |
| Moving average of TP | Simple average of TP over n periods |
| Mean deviation | Average of the absolute differences between each TP and the moving average |
| CCI | (TP − Moving average) ÷ (0.015 × Mean deviation) |
The constant 0.015 was chosen by Lambert so that most CCI values, roughly 70% to 80%, fall between −100 and +100.
Simple calculation example
Using a 5-period CCI for illustration, suppose the last five typical prices on EUR/USD are 1.1600, 1.1610, 1.1620, 1.1615 and 1.1640.
- Average TP: (1.1600 + 1.1610 + 1.1620 + 1.1615 + 1.1640) ÷ 5 = 1.1617
- Absolute deviations: 0.0017, 0.0007, 0.0003, 0.0002 and 0.0023
- Mean deviation: 0.0052 ÷ 5 = 0.00104
- CCI: (1.1640 − 1.1617) ÷ (0.015 × 0.00104) = 0.0023 ÷ 0.0000156 ≈ +147
A reading of about +147 means the latest price is well above its recent average, a sign of strong upward momentum. In practice, your charting platform does this calculation automatically.
4. Zero-line cross
A CCI crossing above zero suggests momentum is turning positive; crossing below zero suggests it is turning negative. Some traders use zero-line crosses as trend filters or exit signals.
5. Divergence
- Bearish divergence: Price makes a higher high while the CCI makes a lower high, warning that upward momentum is fading.
- Bullish divergence: Price makes a lower low while the CCI makes a higher low, warning that downward momentum is fading.
Divergence is a warning, not a trigger. Wait for price confirmation, such as a break of structure or a reversal candle.
How to Read the CCI Indicator
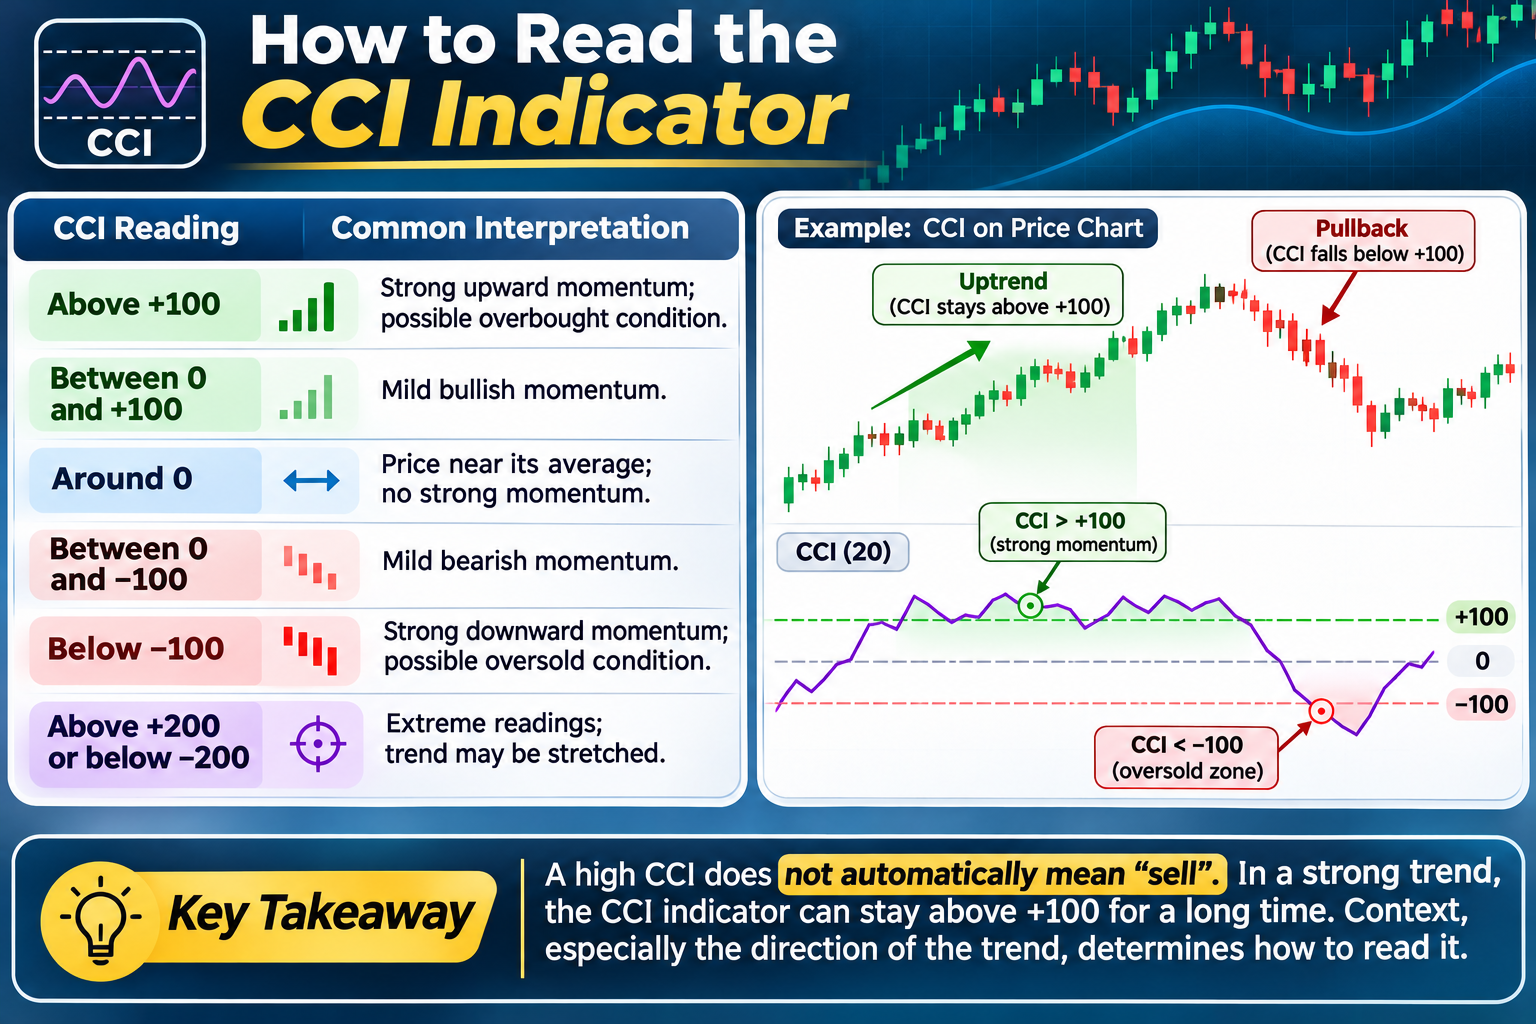
| CCI reading | Common interpretation |
|---|---|
| Above +100 | Strong upward momentum; possible overbought condition |
| Between 0 and +100 | Mild bullish momentum |
| Around 0 | Price near its average; no strong momentum |
| Between 0 and −100 | Mild bearish momentum |
| Below −100 | Strong downward momentum; possible oversold condition |
| Above +200 or below −200 | Extreme readings; trend may be stretched |
The key point is that a high CCI does not automatically mean “sell”. In a strong trend, the CCI indicator can stay above +100 for a long time. Context, especially the direction of the trend, determines how to read it.
Best CCI Indicator Settings
Lambert’s original work used a 20-period setting, and 20 remains the default on most platforms. Some traders prefer 14 to match RSI.
| Setting | Behaviour | Suitable for |
|---|---|---|
| 10–14 | Fast, more signals, more noise | Short-term and intraday traders |
| 20 | Balanced default | Most traders |
| 30–50 | Slower, fewer but smoother signals | Swing and position traders |
Whatever setting you choose, backtest it on your market and timeframe. There is no universally “best” CCI setting.
CCI Indicator Trading Strategies
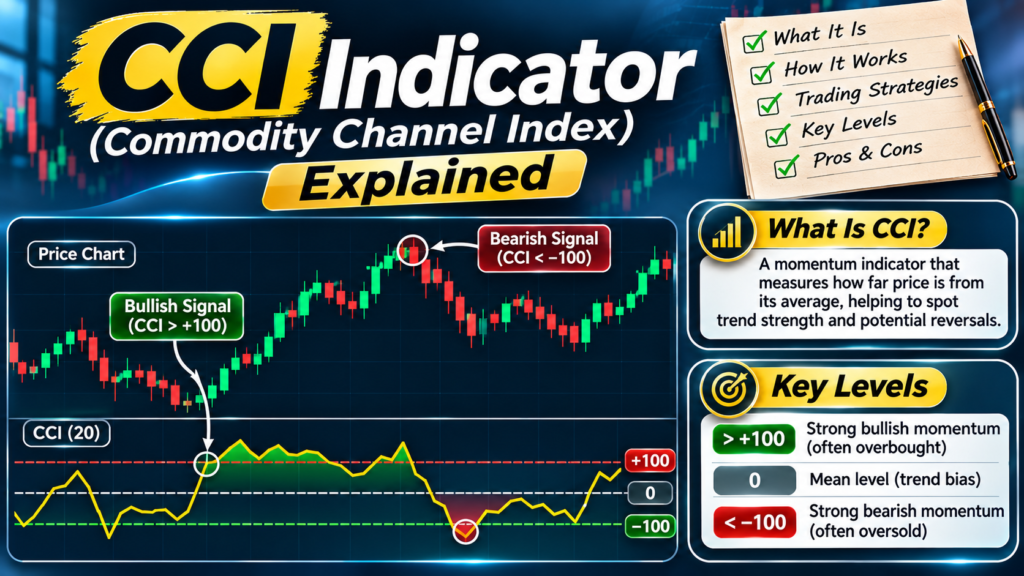
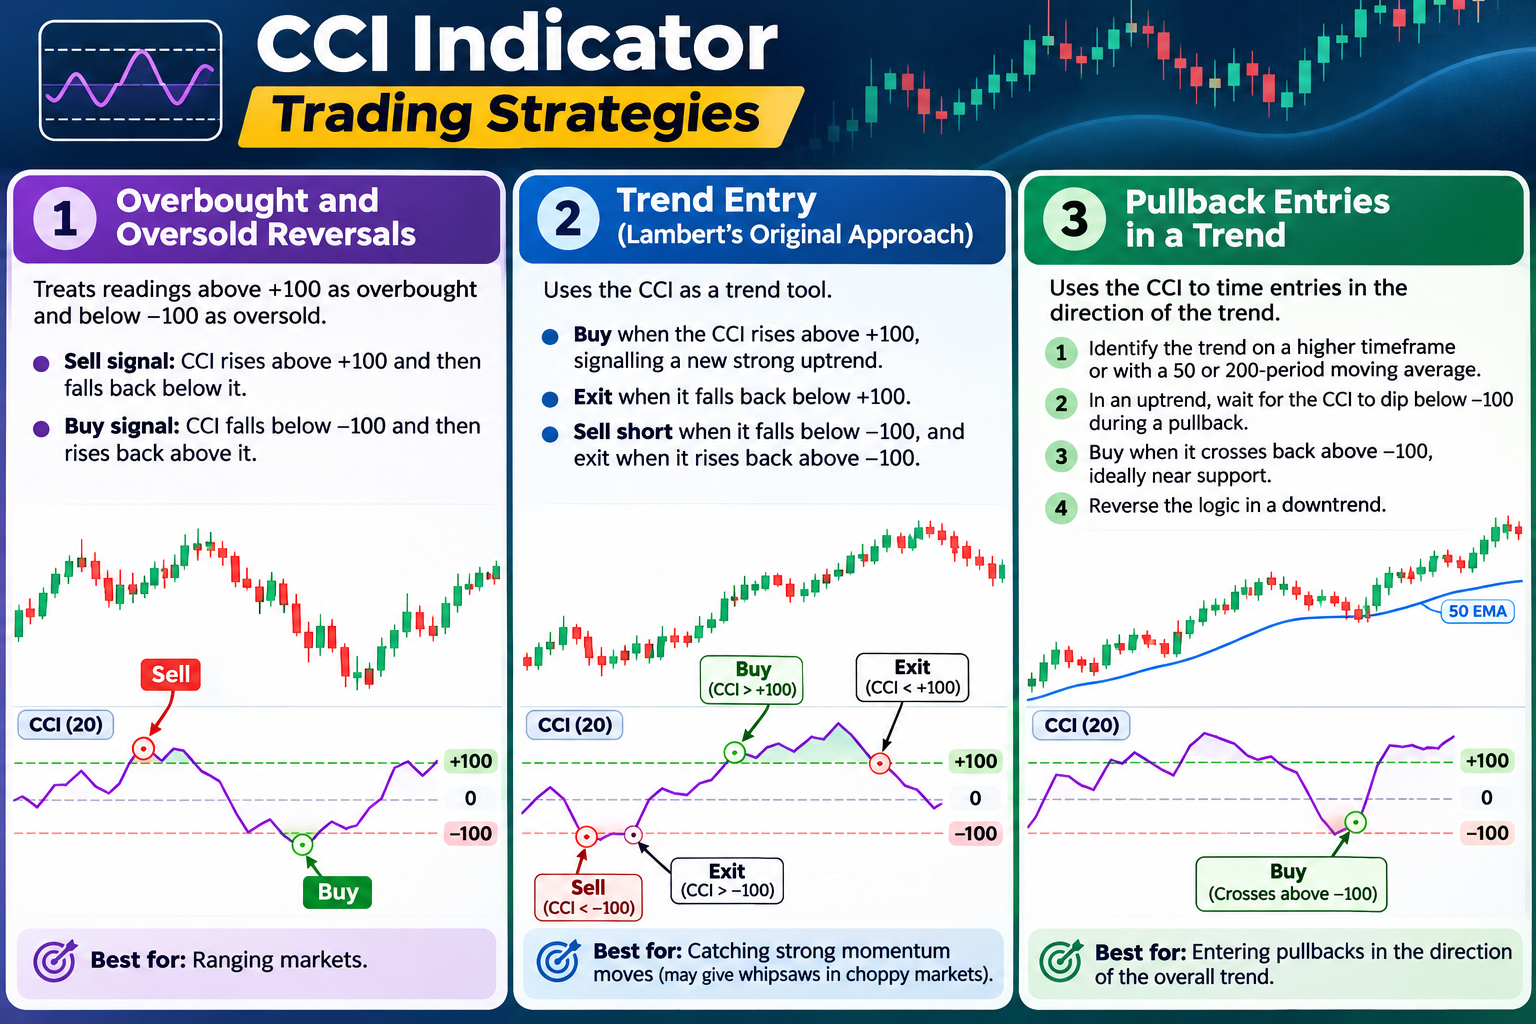
1. Overbought and oversold reversals
The classic approach treats readings above +100 as overbought and below −100 as oversold.
- Sell signal: CCI rises above +100 and then falls back below it.
- Buy signal: CCI falls below −100 and then rises back above it.
This works best in ranging markets. In strong trends it produces many false counter-trend signals, so use it with caution.
2. Trend entry (Lambert’s original approach)
Lambert originally used the CCI as a trend tool:
- Buy when the CCI rises above +100, signalling a new strong uptrend.
- Exit when it falls back below +100.
- Sell short when it falls below −100, and exit when it rises back above −100.
This momentum approach can catch strong moves but may give whipsaws in choppy conditions.
3. Pullback entries in a trend
Many traders combine both ideas:
- Identify the trend on a higher timeframe or with a 50 or 200-period moving average.
- In an uptrend, wait for the CCI to dip below −100 during a pullback.
- Buy when it crosses back above −100, ideally near support.
- Reverse the logic in a downtrend.
This uses the CCI to time entries in the direction of the trend rather than against it.
Worked Example of a CCI Indicator Trade
Suppose the 4-hour EUR/USD chart is in an uptrend, with price above the 50-period EMA.
- Price pulls back to a support zone near 1.1620.
- The 20-period CCI dips to −120, showing a short-term oversold reading within the uptrend.
- A bullish engulfing candle forms at support, and the CCI crosses back above −100.
- The trader buys at 1.1635.
- The stop goes below the support zone at 1.1605 (30 pips of risk).
- The target is the recent swing high at 1.1700 (65 pips).
- Over the next few sessions, price rallies, the CCI moves above +100 and the target is reached.
The trade gains 65 pips on 30 pips of risk, about 2.2 times the risk. The CCI timed the entry, while the trend and support level provided the context.
This example is illustrative and uses hypothetical prices.
Using the CCI Indicator Across Timeframes
The same CCI reading can mean very different things on different charts. A move above +100 on a 5-minute chart may last only a few candles, while the same reading on a daily chart can mark the start of a trend lasting weeks.
- Daily and weekly charts: Use the CCI to judge the broad trend. Sustained readings above zero suggest a bullish backdrop; sustained readings below zero suggest a bearish one.
- 4-hour and 1-hour charts: Look for pullback signals, such as dips below −100 in an uptrend, to time swing entries.
- 15-minute and lower: Signals are frequent and noisy, so use them only to refine entries in the direction of the higher-timeframe trend.
A practical approach is to check the CCI indicator on two timeframes. Trade only when the higher-timeframe reading supports your direction and the lower-timeframe reading gives a clear entry signal. This simple filter removes many low-quality trades.
CCI vs RSI vs Stochastic
| Feature | CCI | RSI | Stochastic |
|---|---|---|---|
| Range | Unbounded | 0 to 100 | 0 to 100 |
| Measures | Distance from average price | Strength of gains vs losses | Close relative to recent range |
| Key levels | +100, −100, 0 | 70, 30, 50 | 80, 20 |
| Best for | Momentum, trend strength, extremes | Overbought/oversold, divergence | Timing in ranges |
Because the CCI indicator is unbounded, it shows the strength of extreme moves more clearly than RSI, which flattens near 0 and 100. On the other hand, the lack of fixed limits makes extremes harder to compare across markets.
Combining the CCI Indicator With Other Tools
- Moving averages: Use a 50 or 200-period moving average to define the trend and only take CCI signals in that direction.
- Support and resistance: CCI signals near key levels are more reliable.
- Candlestick patterns: Pin bars and engulfing patterns confirm CCI turns.
- ADX: An ADX above 20 to 25 suggests a trending market, where CCI trend strategies work better; below 20, reversal signals may suit.
- Multiple timeframes: Use a higher-timeframe CCI for bias and a lower-timeframe CCI for entries.
Limitations of the CCI Indicator
- False signals in trends: Overbought readings can persist for long periods in strong uptrends.
- Lag: The moving average component means signals come slightly after price moves.
- Unbounded scale: Extremes vary by market and volatility, so +200 on one pair may mean something different on another.
- Noise on low timeframes: Short settings on small timeframes produce many whipsaws.
- Not a standalone system: Like any oscillator, the CCI works best with price action and risk management.
Common CCI Indicator Mistakes
- Selling every reading above +100: In a strong trend, this means fighting momentum.
- Ignoring the trend: Use a trend filter before acting on signals.
- Treating divergence as an entry: Wait for price confirmation.
- Over-optimising settings: Settings that fit past data perfectly often fail live.
- No stop-loss: Indicators do not replace risk management.
Using the CCI Indicator in Indian Markets
The CCI is available on all major Indian broker platforms and works on NSE currency futures, Nifty and Bank Nifty futures, and stocks.
- USD/INR: The pair often moves in ranges because the RBI smooths volatility, so overbought and oversold reversals around ±100 can work, but moves are small. Each paise is worth ₹10 per lot.
- Cross-currency futures: EUR/USD, GBP/USD and USD/JPY on NSE trend more, which suits trend and pullback CCI strategies.
- Index futures: Nifty and Bank Nifty can show extended CCI readings during strong trend days.
Indian residents should trade currencies only through recognised exchanges such as NSE and BSE via SEBI-registered brokers. Leveraged forex trading on offshore platforms is not permitted under FEMA.

CCI Indicator Checklist
- What is the higher-timeframe trend?
- Am I using a trend strategy or a range strategy?
- Has the CCI crossed a key level (+100, −100 or zero) in the right direction?
- Is price at a support or resistance level?
- Is there a confirming candlestick?
- Is the stop beyond a logical level, with at least 1:2 reward-to-risk?
FAQs
What is the CCI indicator?
It is a momentum oscillator that measures how far price is from its average over a set period, helping traders spot overbought, oversold and trending conditions.
What are the best CCI settings?
The default is 20 periods. Shorter settings such as 14 give more signals; longer settings such as 30 to 50 give smoother, fewer signals.
What do +100 and −100 mean on the CCI?
Readings above +100 suggest strong upward momentum or overbought conditions; readings below −100 suggest strong downward momentum or oversold conditions.
Is the CCI better than RSI?
Neither is better in all cases. The CCI is unbounded and highlights extreme moves well, while RSI is bounded and easier to compare across markets.
Can I use the CCI indicator alone?
It is best combined with trend analysis, support and resistance and price action, plus strict risk management.
Conclusion
The CCI indicator is a flexible momentum tool that measures how far price has moved from its average. It can highlight overbought and oversold conditions in ranges, confirm strong trends when it moves beyond ±100 and warn of fading momentum through divergence.
Use it with a clear view of the trend, confirm signals with price action at key levels and always manage risk. Test your chosen settings and strategy on historical charts and a demo account before trading live.