Introduction
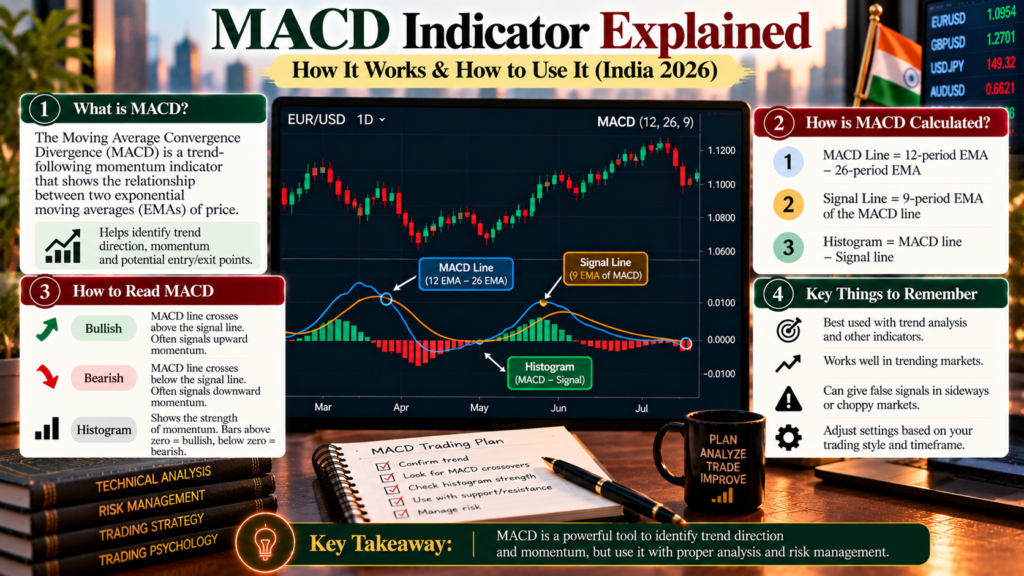
MACD is the indicator with two lines and a bar chart that sits under many forex charts. It looks complicated, but it’s built from something simple: the gap between two moving averages. Once you understand that, the MACD line, signal line and histogram all make sense. With the MACD indicator explained step by step, you’ll be able to read what it’s saying about momentum, and recognise when its signals are likely to mislead.
Quick answer: MACD (Moving Average Convergence Divergence) is the difference between a 12-period and a 26-period exponential moving average (EMA). A 9-period EMA of that line forms the signal line, and the histogram shows the gap between the two. MACD above zero means the short-term average is above the long-term one (upward momentum); below zero means downward momentum. Traders watch signal-line crossovers, zero-line crossovers, histogram shrinking or growing, and divergence. Because MACD is built from moving averages, it lags price and gives false signals in sideways markets, so use it with trend and price structure, not alone.
Why this matters
- MACD combines trend and momentum in one indicator, which makes it popular with beginners.
- Its default settings (12, 26, 9) are used so widely that many traders react to the same signals.
- Indian traders can apply MACD to permitted pairs such as USD/INR futures on NSE or BSE, traded through a SEBI-registered broker.
What is MACD?
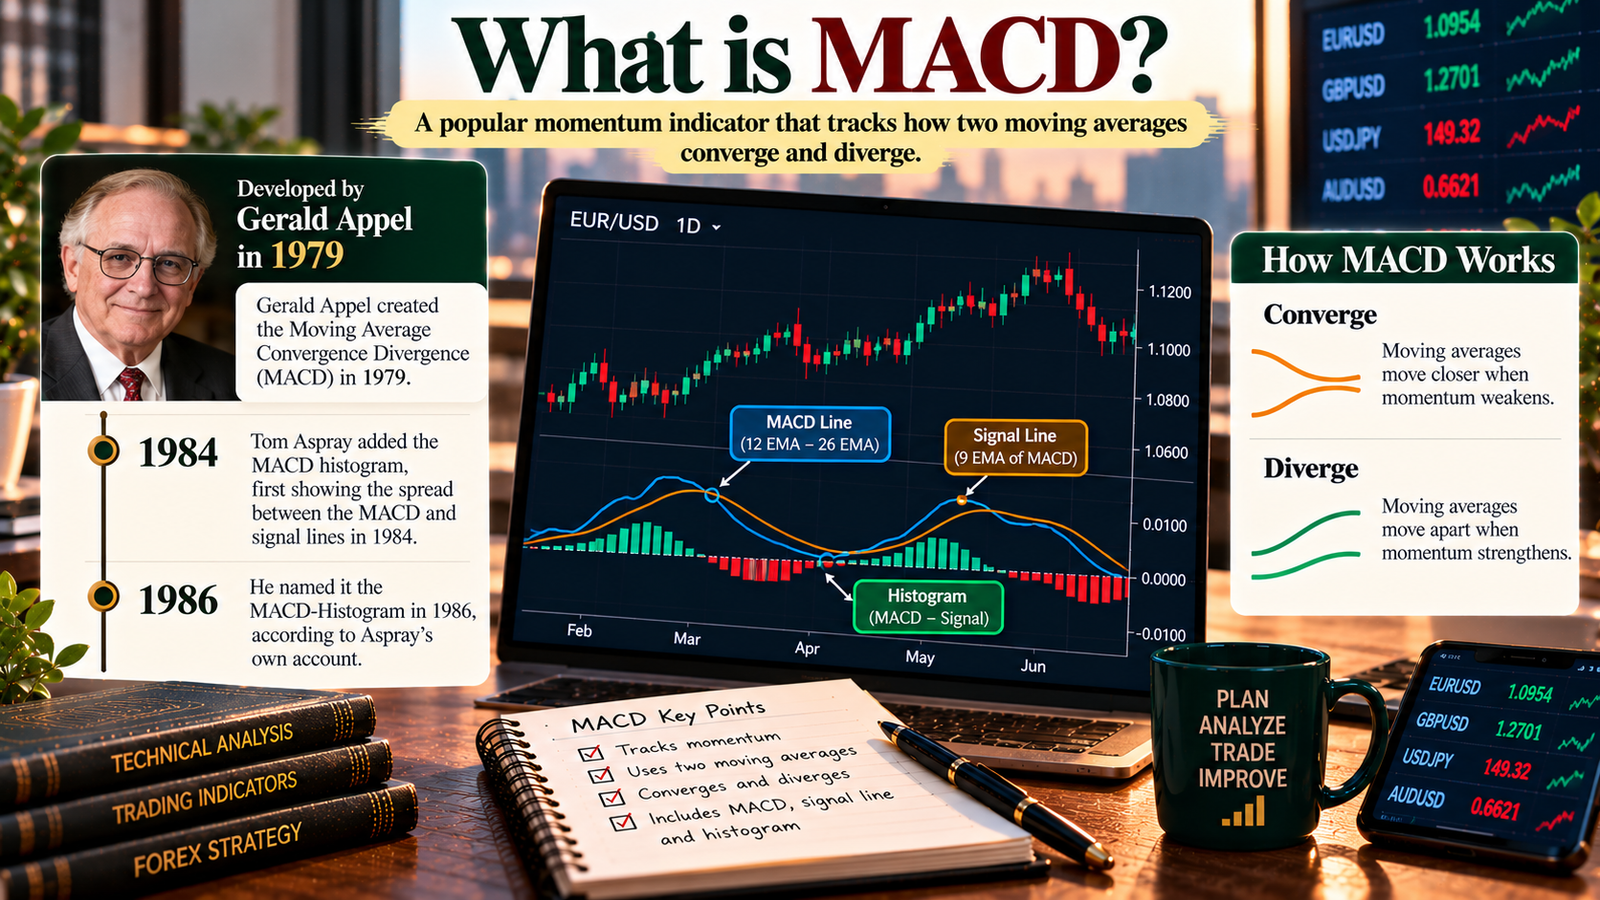
Fact: MACD was developed by Gerald Appel in 1979. Tom Aspray added the MACD histogram, first showing the spread between MACD and signal lines in 1984 and naming it the MACD-Histogram in 1986, according to Aspray’s own account.
MACD tracks how two moving averages converge (move closer) and diverge (move apart), which is where the name comes from.
The three components
| Component | Formula (default settings) | What it shows |
|---|---|---|
| MACD line | 12-period EMA − 26-period EMA | Momentum and trend direction |
| Signal line | 9-period EMA of the MACD line | A smoother version of MACD, used for crossovers |
| Histogram | MACD line − signal line | Whether momentum is strengthening or weakening |
EMA uses the smoothing factor k = 2 ÷ (N + 1), so the 12-period EMA reacts faster than the 26-period one.
Worked calculation (illustrative USD/INR closes)
The prices below come from an illustrative series: a steady rise from 95.00, a push to 95.50, then a pullback. MACD values are in rupees.
| Day | Close | 12 EMA | 26 EMA | MACD | Signal (9 EMA) | Histogram |
|---|---|---|---|---|---|---|
| 34 | 95.50 | 95.3411 | 95.2411 | 0.1000 | 0.0797 | +0.0203 |
| 35 | 95.48 | 95.3624 | 95.2588 | 0.1037 | 0.0845 | +0.0191 |
| 36 | 95.42 | 95.3713 | 95.2707 | 0.1006 | 0.0877 | +0.0128 |
| 37 | 95.35 | 95.3680 | 95.2766 | 0.0914 | 0.0885 | +0.0030 |
| 38 | 95.30 | 95.3575 | 95.2783 | 0.0792 | 0.0866 | −0.0074 |
| 39 | 95.28 | 95.3456 | 95.2784 | 0.0672 | 0.0827 | −0.0156 |
| 40 | 95.25 | 95.3309 | 95.2763 | 0.0546 | 0.0771 | −0.0225 |
Calculated in code using SMA-seeded EMAs; prices are illustrative.
Reading the table: the histogram shrank from day 35 (momentum fading) and turned negative on day 38, when MACD crossed below its signal line. MACD itself stayed above zero, so the short-term average was still above the long-term one. It’s a momentum slowdown, not yet a downtrend.
How to read MACD
| What you see | What it suggests |
|---|---|
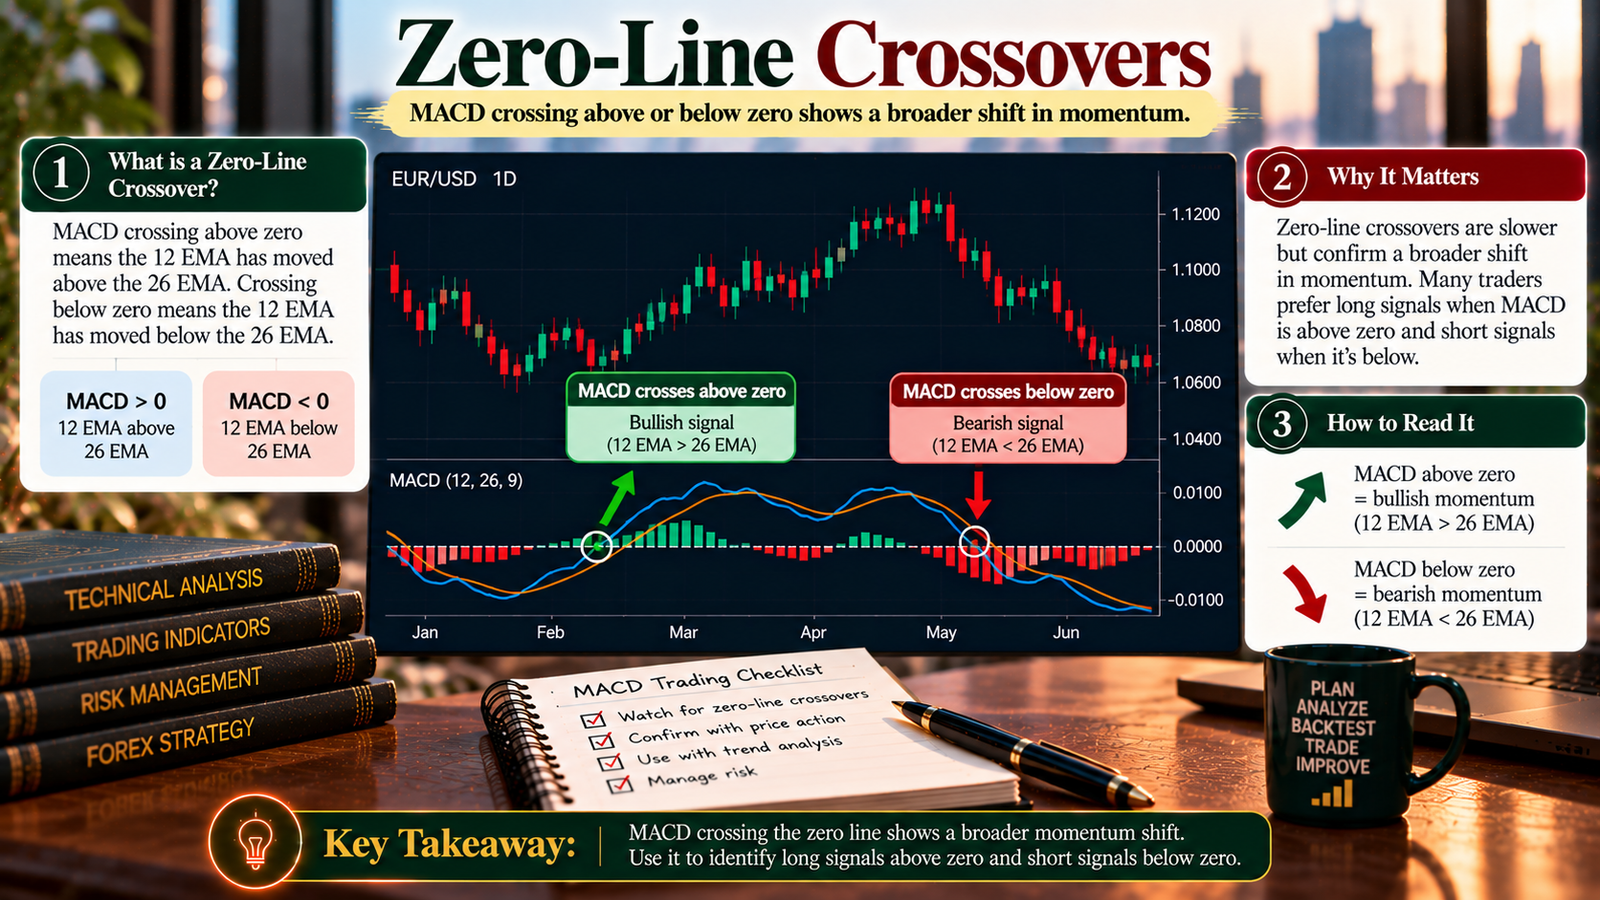
| MACD above zero | 12 EMA above 26 EMA; upward momentum |
| MACD below zero | 12 EMA below 26 EMA; downward momentum |
| MACD crosses above signal | Momentum turning up |
| MACD crosses below signal | Momentum turning down |
| Histogram bars growing | Momentum strengthening in that direction |
| Histogram bars shrinking | Momentum fading; possible crossover ahead |
Settings
The default is 12, 26, 9. Shorter periods give earlier but noisier signals; longer periods give fewer, later signals. Pick one set, test it, and stay consistent.
How traders use MACD
1. Signal-line crossovers
MACD crossing above its signal line suggests momentum turning up; crossing below suggests momentum turning down. These are the most common and the most frequent signals, and they whipsaw in ranges.
2. Zero-line crossovers
MACD crossing above zero means the 12 EMA has moved above the 26 EMA. It’s slower but confirms a broader shift in momentum. Many traders prefer long signals when MACD is above zero and short signals when it’s below.
3. Histogram momentum
Shrinking histogram bars show momentum fading before a crossover happens. Aspray developed the histogram for exactly this purpose: to spot changes earlier than the crossover itself.
4. Divergence
Price makes a higher high while MACD makes a lower high (bearish), or price makes a lower low while MACD makes a higher low (bullish). As with RSI, divergence is a warning, not a timing signal; it can persist for a long time.
What does the evidence say?
Fact: Anghel (2015, Procedia Economics and Finance) tested MACD rules on stocks in 75 countries from 2001 to 2012. Overall, MACD strategies underperformed buy-and-hold, with success rates of roughly 26–38% depending on the measure. Some markets showed significant positive results in particular periods, notably around the 2008 and 2011 crises.
Fact: MACD is built from moving averages. For currencies, Neely, Weller and Ulrich found that excess returns from filter and moving-average rules seen in the 1970s and 1980s had disappeared by the early 1990s in out-of-sample tests.
Analysis: The first study covers equities, and the second covers simple moving-average rules rather than MACD specifically. Together they suggest mechanically trading default MACD crossovers is unlikely to provide a reliable edge. MACD is more useful as a momentum filter within a broader plan.
Worked example: USD/INR futures (illustrative)
USD/INR futures are in an uptrend above a rising 200-day SMA. Price pulls back to support near 95.40, the histogram stops shrinking, and MACD crosses back above its signal line while staying above zero.
| Item | Value |
|---|---|
| Entry (buy) | 95.40 |
| Stop-loss (below the pullback low) | 95.20 |
| Target (prior high) | 95.80 |
| Risk per lot | (95.40 − 95.20) × 1,000 = ₹200 |
| Potential reward per lot | (95.80 − 95.40) × 1,000 = ₹400 |
| Reward-to-risk | 2 : 1 |
| Capital and risk | ₹1,00,000 at 1% = ₹1,000 |
| Position size | ₹1,000 ÷ ₹200 = 5 lots (risk ₹1,000; potential reward ₹2,000) |
One NSE USD/INR lot is $1,000, so a ₹0.01 move equals ₹10 per lot. Figures are before brokerage, charges and slippage.
MACD vs RSI
| MACD | RSI | |
|---|---|---|
| Built from | Difference between two EMAs | Average gains vs average losses |
| Scale | Unbounded; measured in price units | 0–100 |
| Best at | Trend and momentum direction | Momentum extremes, especially in ranges |
| Overbought/oversold levels | None built in | 70/30 by convention |
| Main signals | Signal and zero-line crossovers, histogram, divergence | Extremes, 50 line, divergence, failure swings |
| Weakness | Lags; whipsaws in ranges | Stays at extremes in trends |
Using both can be useful, but they overlap. Don’t treat agreement between two momentum indicators as two independent confirmations.
Step-by-step: using MACD
- Define the trend with price structure or a long moving average.
- Trade in the trend’s direction: longs when MACD is above zero, shorts when below.
- Watch the histogram for fading momentum during pullbacks.
- Use a signal-line crossover in the trend’s direction as a timing cue, with price confirmation.
- Treat divergence as a warning, not an entry.
- Set the stop beyond the pullback swing, and size from your risk per trade.
- Avoid crossovers in obviously sideways markets.
- Record results and review over 50–100 trades.
Expert analysis
Fact: MACD (Appel, 1979) is the 12-period EMA minus the 26-period EMA, with a 9-period EMA signal line and a histogram (Aspray, 1986) showing the gap between them. A study of 75 stock markets found MACD rules generally underperformed buy-and-hold over 2001–2012, and research on currencies found simple moving-average rule profits had faded by the early 1990s.
Analysis: MACD’s strength is combining trend (is the fast average above the slow one?) and momentum (is the gap widening or narrowing?) in one view. Its weakness is that everything is derived from past prices, so it lags and whipsaws when price moves sideways. The histogram is the most useful part for many traders, because it shows momentum fading before a crossover happens.
Opinion: For beginners, a sensible use is as a filter: only take trades in the direction MACD suggests (above or below zero), and use histogram changes to time pullback entries alongside price levels. Avoid trading every crossover, and test one fixed setup over 50–100 trades before changing anything.
Common mistakes
- Trading every signal-line crossover, especially in ranges.
- Ignoring the zero line and taking longs while MACD is well below zero.
- Treating divergence as an immediate reversal signal.
- Constantly changing settings to fit recent price.
- Using MACD and RSI as independent confirmations, when both measure momentum.
- Forgetting that MACD lags, and entering after most of the move has happened.
- Skipping stops because MACD “just crossed”.
Myths vs facts
| Myth | Fact |
|---|---|
| “A MACD crossover is a buy or sell signal on its own.” | Crossovers lag and whipsaw in ranges; they work better as timing cues within a trend. |
| “MACD predicts price.” | It’s calculated from past prices; it describes momentum, it doesn’t forecast. |
| “MACD has overbought and oversold levels.” | Unlike RSI, MACD has no fixed upper or lower bounds. |
| “Default MACD settings are proven profitable.” | Research on stocks found MACD rules generally underperformed buy-and-hold over 2001–2012. |
| “Divergence means the trend is about to reverse.” | Divergence can persist for a long time and often fails. |
Key takeaways
- MACD line = 12 EMA − 26 EMA; signal line = 9 EMA of MACD; histogram = MACD − signal.
- Above zero means upward momentum; below zero means downward momentum.
- A shrinking histogram warns that momentum is fading before a crossover.
- MACD lags and whipsaws in sideways markets; research doesn’t support trading default crossovers mechanically.
- Use MACD as a trend and momentum filter with price structure, stops and fixed risk. In our example, 5 USD/INR lots risked ₹1,000 for a potential ₹2,000.
- MACD and RSI overlap; don’t count them as two independent confirmations.
FAQs
- What is the MACD indicator? Moving Average Convergence Divergence: the difference between a 12-period and 26-period EMA, with a 9-period signal line and a histogram, used to gauge trend and momentum.
- Who created MACD? Gerald Appel developed MACD in 1979. Tom Aspray introduced the MACD histogram, naming it in 1986.
- How is MACD calculated? MACD line = 12 EMA − 26 EMA. Signal line = 9 EMA of the MACD line. Histogram = MACD line − signal line.
- What do the MACD settings 12, 26, 9 mean? The periods for the fast EMA (12), slow EMA (26) and signal-line EMA (9).
- What does MACD above zero mean? The 12-period EMA is above the 26-period EMA, indicating upward momentum.
- What is a MACD signal-line crossover? When the MACD line crosses above (bullish) or below (bearish) its signal line.
- What does the MACD histogram show? The gap between MACD and its signal line. Growing bars show strengthening momentum; shrinking bars show fading momentum.
- What is MACD divergence? When price and MACD move in different directions, such as price making a higher high while MACD makes a lower high.
- Is MACD a leading or lagging indicator? Lagging, because it’s built from moving averages of past prices. The histogram can hint at changes slightly earlier.
- Does MACD work in forex? It can help as a filter, but research suggests mechanically trading moving-average-based signals, including default crossovers, is unlikely to provide a reliable edge on its own.
- Is MACD better than RSI? Neither is better overall. MACD is stronger for trend and momentum direction; RSI for momentum extremes. They overlap, so using both doesn’t double your confirmation.
- Does MACD have overbought and oversold levels? No. Unlike RSI, it has no fixed bounds.
- Which time frame is best for MACD? It works on any time frame. Higher time frames usually give fewer, more meaningful signals.
- Can I use MACD on USD/INR? Yes, on NSE or BSE USD/INR futures traded through a SEBI-registered broker.
- Why does MACD give false signals? In sideways markets, the two EMAs repeatedly cross, creating whipsaws.
- Should I change MACD settings? Only after testing. Start with 12, 26, 9 and stay consistent for at least 50–100 trades.
- How do I test a MACD strategy? Write exact rules (trend filter, entry trigger, stop, target), apply them to 50–100 trades, and review results in R after costs and slippage.