Introduction
Open a trading chart full of indicators and it can look like a cockpit: moving averages, oscillators, bands and lines everywhere. Many beginners eventually realise that all those indicators are calculated from the same thing: price. So why not read price directly?
That is the idea behind price action trading strategy. Instead of relying on lagging indicators, you study how price moves, where it stalls, where it reverses and how candles form. The result is a cleaner chart and decisions based on what the market is actually doing.
This guide covers:
- What price action is and why traders use it
- Market structure and trends
- Support, resistance and key levels
- Important candlestick patterns
- Simple strategies with entry, stop and target rules
- A worked example, common mistakes and a practice plan
What Is Price Action Trading?
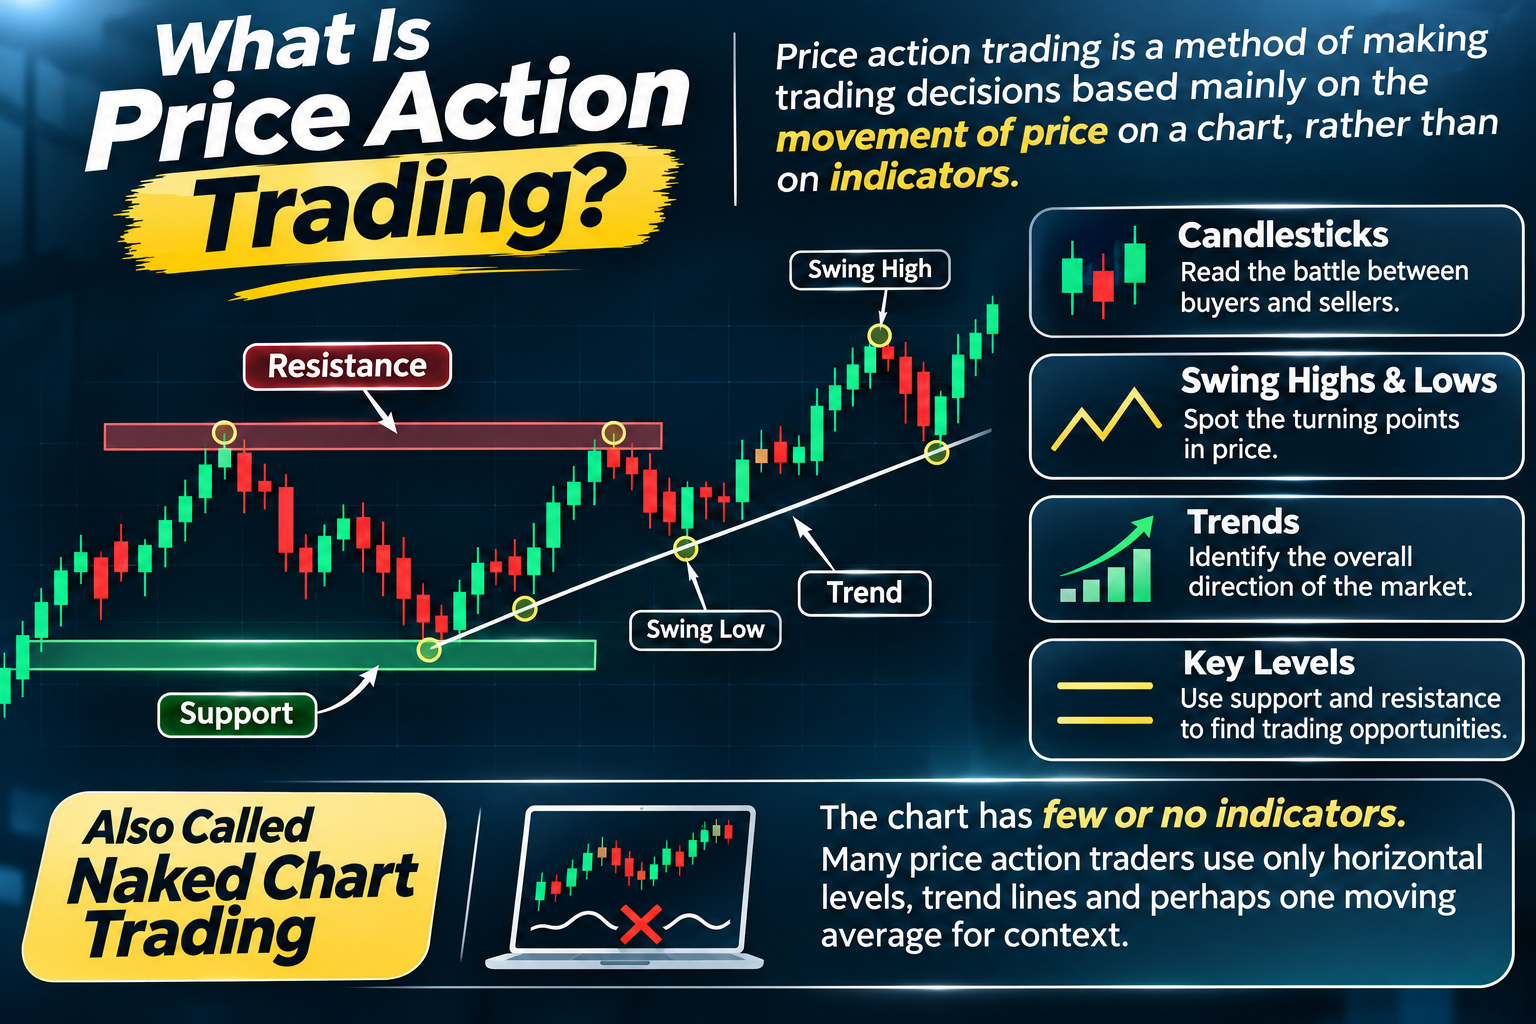
Price action trading is a method of making trading decisions based mainly on the movement of price on a chart, rather than on indicators. Traders look at candlesticks, swing highs and lows, trends and key levels to judge who is in control, buyers or sellers, and where price is likely to go next.
It is sometimes called “naked chart trading” because the chart has few or no indicators. Many price action traders use only horizontal levels, trend lines and perhaps one moving average for context.
Why Traders Use Price Action
- Clarity: A clean chart is easier to read and reduces conflicting signals.
- No lag: Indicators are derived from past prices; price itself is the most current information.
- Works across markets: The same principles apply to forex, stocks, indices, commodities and crypto.
- Works across timeframes: From 5-minute charts to weekly charts.
- Builds market understanding: You learn why price moves, not just when an indicator says so.
The trade-off is that price action trading is partly subjective. Two traders can draw slightly different levels or read a candle differently, so clear rules and practice are essential.
Market Structure: The Foundation of Price Action Trading
Before looking for any setup, identify the market’s structure.
| Structure | What it looks like | What to do |
|---|---|---|
| Uptrend | Higher highs (HH) and higher lows (HL) | Look for buying opportunities on pullbacks |
| Downtrend | Lower highs (LH) and lower lows (LL) | Look for selling opportunities on rallies |
| Range | Price moves sideways between support and resistance | Buy near support, sell near resistance, or wait for a breakout |
A trend changes when the pattern breaks. For example, if an uptrend fails to make a new high and then breaks below its last higher low, the structure has shifted and the trend may be ending.
Always start with a higher timeframe, such as the daily chart, to see the bigger picture, then move to a lower timeframe for entries.
Support and Resistance in Price Action Trading
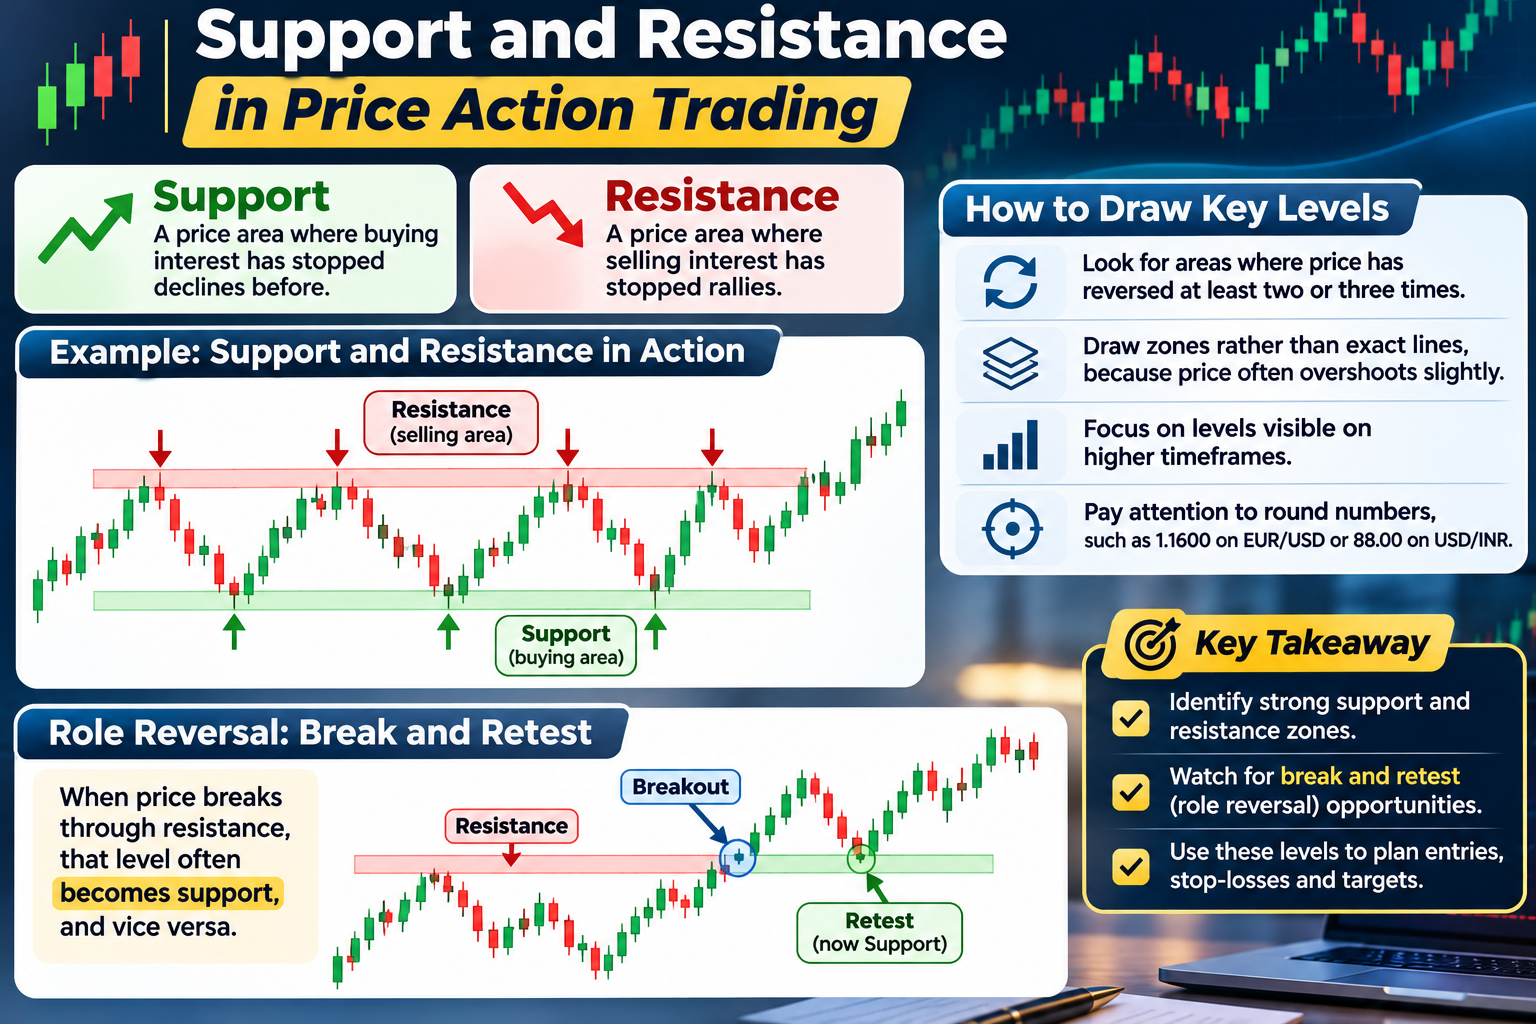
Support is a price area where buying interest has stopped declines before. Resistance is an area where selling interest has stopped rallies.
How to draw key levels
- Look for areas where price has reversed at least two or three times.
- Draw zones rather than exact lines, because price often overshoots slightly.
- Focus on levels visible on higher timeframes.
- Pay attention to round numbers, such as 1.1600 on EUR/USD or 88.00 on USD/INR.
Role reversal
When price breaks through resistance, that level often becomes support, and vice versa. This “break and retest” behaviour is one of the most useful ideas in price action trading.
Trend Lines and Channels
A trend line connects swing lows in an uptrend or swing highs in a downtrend. Two parallel lines form a channel.
- Use at least two clear touches to draw a line; a third touch confirms it.
- Do not force lines through candle bodies to make them fit.
- A break of a long-standing trend line can warn of a change in trend, but wait for structure to confirm it.
Key Candlestick Patterns
Candlesticks show the battle between buyers and sellers in each period. A few patterns are especially useful for price action trading, as long as they appear at meaningful levels.
Pin bar
A candle with a small body and a long wick on one side. A bullish pin bar has a long lower wick, showing that sellers pushed price down but buyers drove it back up. A bearish pin bar has a long upper wick.
Engulfing pattern
A two-candle pattern where the second candle’s body completely covers the first. A bullish engulfing at support suggests buyers have taken control; a bearish engulfing at resistance suggests the opposite.
Inside bar
A candle whose high and low are within the previous candle’s range. It shows consolidation and often precedes a breakout. Traders may enter on a break of the inside bar in the direction of the trend.
Doji
A candle where the open and close are almost equal, showing indecision. A doji after a strong move at a key level can warn of a possible reversal.
Important: A candlestick pattern on its own, in the middle of nowhere, means little. Context, meaning trend and location, is what gives patterns their power.
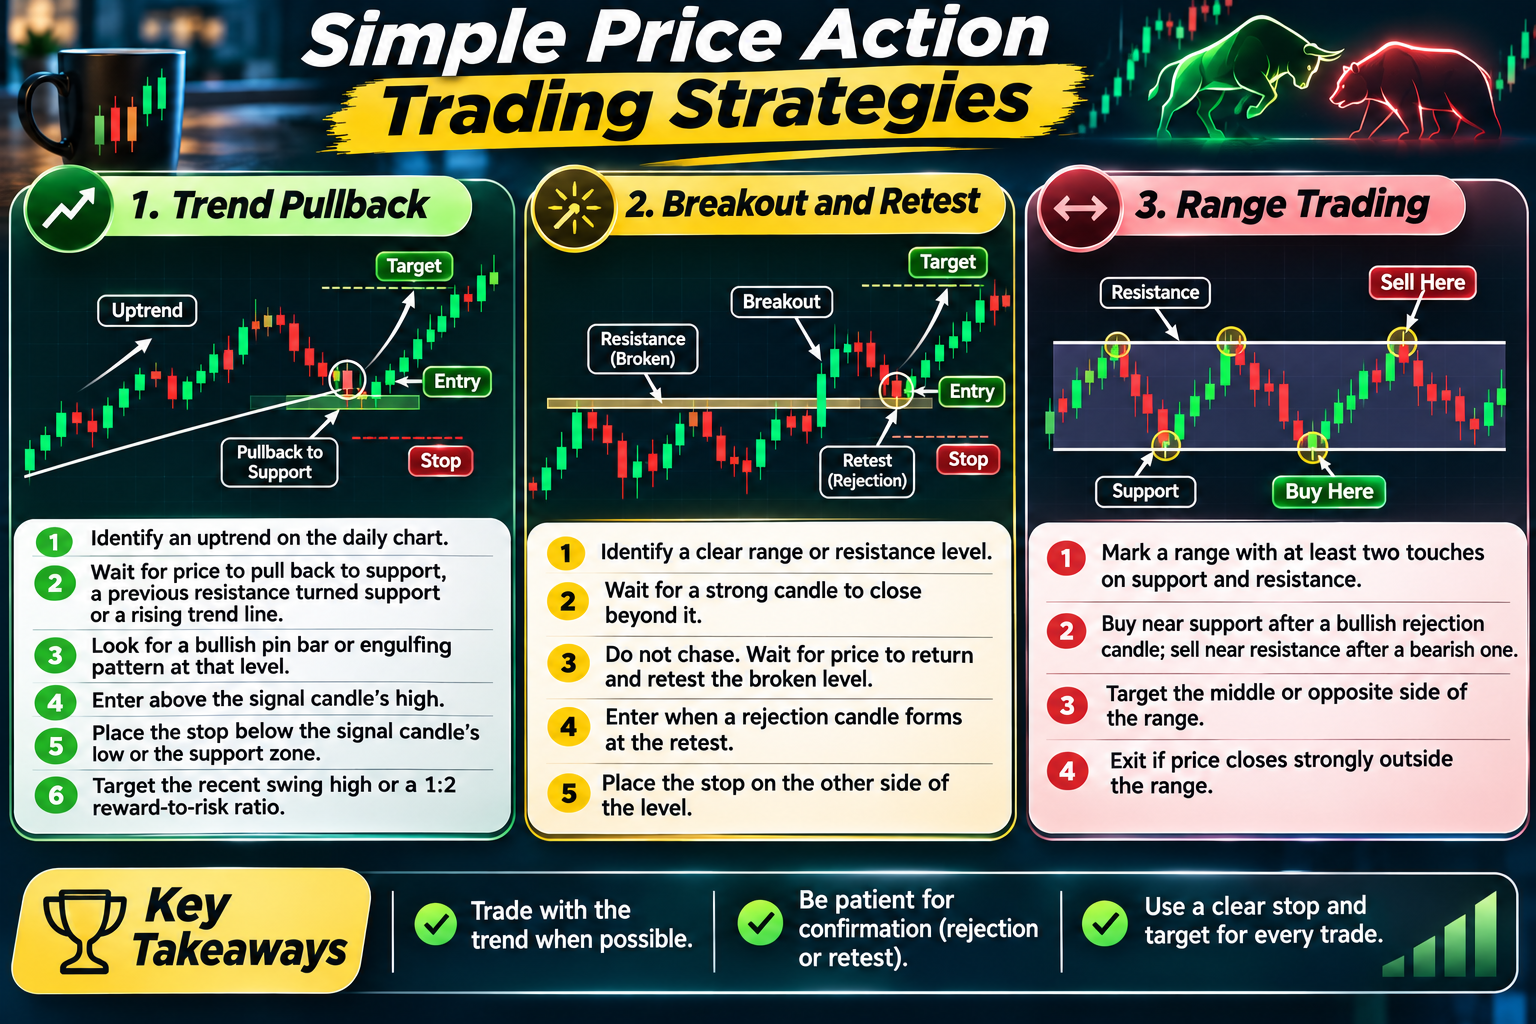
Simple Price Action Trading Strategies
1. Trend pullback
- Identify an uptrend on the daily chart.
- Wait for price to pull back to support, a previous resistance turned support or a rising trend line.
- Look for a bullish pin bar or engulfing pattern at that level.
- Enter above the signal candle’s high.
- Place the stop below the signal candle’s low or the support zone.
- Target the recent swing high or a 1:2 reward-to-risk ratio.
2. Breakout and retest
- Identify a clear range or resistance level.
- Wait for a strong candle to close beyond it.
- Do not chase. Wait for price to return and retest the broken level.
- Enter when a rejection candle forms at the retest.
- Place the stop on the other side of the level.
3. Range trading
- Mark a range with at least two touches on support and resistance.
- Buy near support after a bullish rejection candle; sell near resistance after a bearish one.
- Target the middle or opposite side of the range.
- Exit if price closes strongly outside the range.
 Price Action Trading Rules for Entries, Stops and Targets
- Entries: Enter on confirmation, such as a candle close, rather than guessing in advance.
- Stops: Place stops beyond the level that would prove your idea wrong, not at a random number of pips.
- Targets: Use the next support or resistance level, the recent swing high or low, or a fixed reward-to-risk multiple.
- Risk: Risk no more than 1% of your account per trade, and size your position so the stop distance matches that risk.
Worked Example of Price Action Trading
Suppose the daily EUR/USD chart is in an uptrend with higher highs and higher lows. The last swing high was 1.1720, and 1.1640 was previous resistance that price broke through last week.
- Price pulls back to the 1.1640 zone, now acting as support.
- On the 4-hour chart, a bullish pin bar forms with a low of 1.1628 and a high of 1.1655.
- The trader buys at 1.1657, just above the pin bar’s high.
- The stop goes below the pin bar’s low at 1.1625 (32 pips of risk).
- The target is the previous swing high at 1.1720 (63 pips).
- Price rallies over the next two days and reaches 1.1720.
The trade gains 63 pips on 32 pips of risk, close to a 1:2 reward-to-risk ratio. The decision used only market structure, a key level and one candlestick pattern.
This example is illustrative and uses hypothetical prices.
Best Timeframes for Price Action Trading
| Timeframe | Use | Suitable for |
|---|---|---|
| Weekly and daily | Trend direction and major levels | All traders |
| 4-hour | Swing trade setups | Part-time traders |
| 1-hour and 15-minute | Intraday setups and refined entries | Active traders |
| 5-minute and below | Scalping | Experienced traders only |
Beginners usually do best on the 4-hour and daily charts, where signals are cleaner and there is less noise.
Common Price Action Trading Mistakes
- Trading patterns without context: A pin bar in the middle of a range means little.
- Drawing too many levels: If everything is a level, nothing is. Keep only the clearest zones.
- Fighting the trend: Counter-trend trades have lower odds, especially for beginners.
- Entering before confirmation: Wait for the candle to close.
- Ignoring higher timeframes: A 15-minute setup against the daily trend often fails.
- Moving stops: Widening a stop to avoid a loss turns small losses into large ones.
- Overtrading: Good setups are not available every hour. Patience is part of the strategy.
Price Action Trading in Indian Markets
Price action works on any liquid chart, including NSE currency futures, Nifty and Bank Nifty futures, and stocks.
- USD/INR: The pair often moves in ranges because the RBI smooths sharp moves, which suits range-based price action. Each paise move is worth ₹10 per lot.
- Cross-currency futures: EUR/USD, GBP/USD and USD/JPY futures on NSE follow global prices, so spot charts can guide analysis, but check NSE liquidity and trading hours.
- Index futures: Nifty and Bank Nifty often respect round numbers and previous day highs and lows.
Indian residents should trade currencies only through recognised exchanges such as NSE and BSE via SEBI-registered brokers. Leveraged forex trading on offshore platforms is not permitted under FEMA.

A 30-Day Practice Plan
Reading charts well takes repetition. Many beginners jump between strategies after a few losing trades and never build real skill. A structured plan helps you learn price action trading step by step, with time to see how each concept behaves across different markets and conditions. Spend 30 to 60 minutes a day and keep notes and screenshots of what you find.
- Week 1: Mark market structure and key levels on daily charts of three markets every day.
- Week 2: Study pin bars, engulfing patterns and inside bars at those levels on historical charts.
- Week 3: Choose one strategy and backtest at least 50 past setups, recording results.
- Week 4: Trade the strategy on a demo account with fixed risk and keep a journal.
Only move to real money after you have consistent results and a written plan.
Price Action Trading Checklist
- What is the higher-timeframe trend?
- Is price at a meaningful support or resistance level?
- Is there a clear candlestick signal at that level?
- Does the trade align with market structure?
- Where is the stop that proves me wrong?
- Is the reward-to-risk at least 1:2?
- Is major news due soon?
FAQs
What is price action trading?
It is a trading approach based on reading price movements, candlestick patterns, trends and key levels on a chart, with little or no reliance on indicators.
Is price action trading good for beginners?
Yes. It teaches core market concepts and keeps charts simple, though it takes practice to read price consistently.
Do I need indicators for price action trading?
Not necessarily. Some traders add a moving average for trend context, but the main decisions come from price itself.
Which candlestick pattern is the most reliable?
No pattern is reliable on its own. Pin bars and engulfing patterns work best at strong levels in the direction of the trend.
Which timeframe is best?
Beginners usually find the 4-hour and daily charts easiest, because they have less noise and fewer false signals.
Conclusion
Price action trading strips trading back to its essentials: trend, levels and candles. By learning to read market structure, mark key support and resistance zones and wait for clear candlestick signals in the right places, you can build a simple, flexible approach that works across markets and timeframes.
Start with one strategy, practise on historical charts and a demo account, use strict risk management and keep a journal. Over time, reading price will become second nature.