Introduction
One of the hardest parts of trading is knowing when to get out. Exit too early and you miss the rest of the move. Exit too late and you give back profits you had already earned. Many traders solve this problem with a trailing stop: a stop-loss that follows price as the trade moves in your favour.
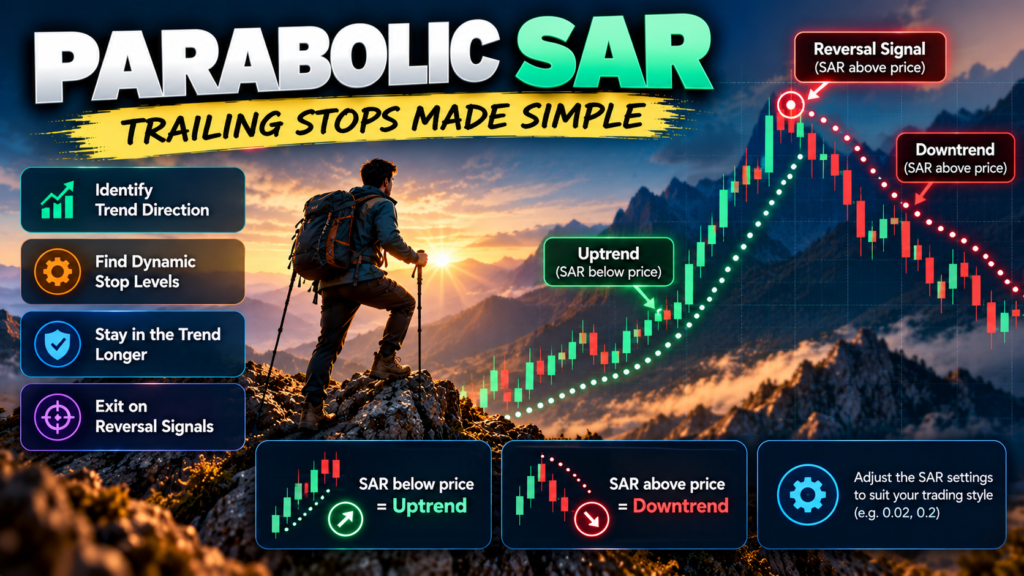
The Parabolic SAR is one of the simplest tools for setting trailing stops. It appears as a series of dots above or below price, and it moves closer to price as a trend develops. When price touches the dots, the indicator flips, signalling a possible exit or reversal.
This guide explains:
- What the indicator is and who created it
- How it is calculated, in simple terms
- How to read the dots on your chart
- How to use it as a trailing stop
- Strategies, settings and filters
- A worked example and common mistakes
What Is the Parabolic SAR?
The Parabolic SAR (Stop and Reverse) is a trend-following indicator developed by J. Welles Wilder and introduced in his 1978 book New Concepts in Technical Trading Systems. That same book introduced the RSI, ADX and Average True Range (ATR).
The indicator plots dots on the price chart:
- Dots below price: The trend is up. The dots act as a rising trailing stop for long positions.
- Dots above price: The trend is down. The dots act as a falling trailing stop for short positions.
The name describes how it works. “Parabolic” refers to the curved path the dots follow as they accelerate towards price. “Stop and reverse” reflects Wilder’s original idea: when price hits the stop, you exit and immediately take a position in the opposite direction.
How the Parabolic SAR Is Calculated
Charting platforms calculate the indicator automatically, but understanding the logic helps you use it well.
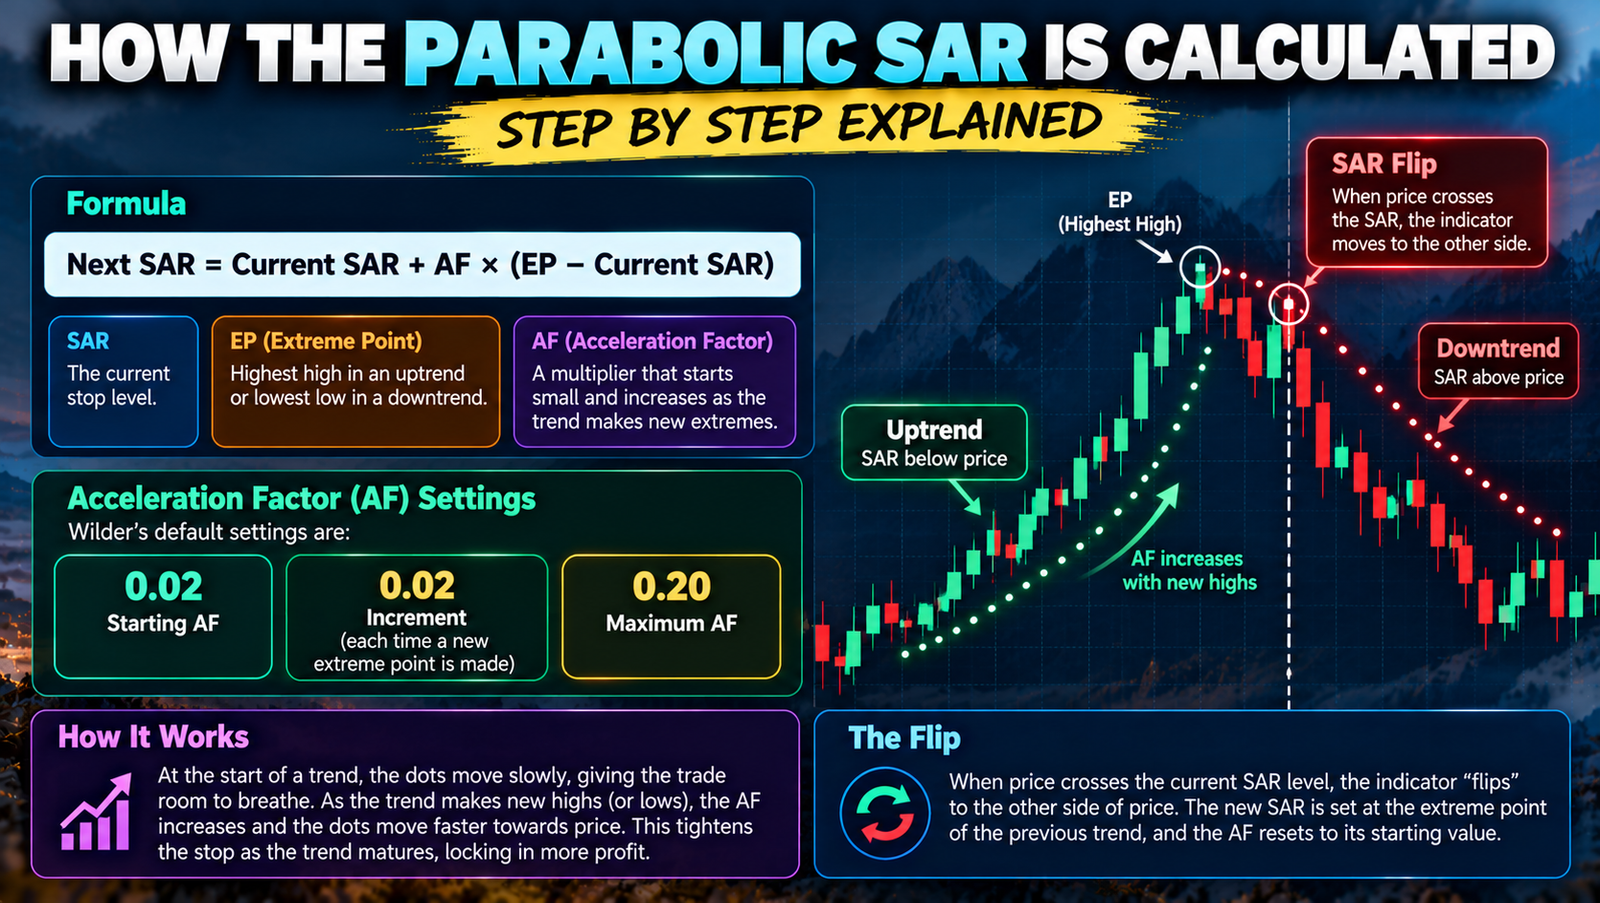
Next SAR = Current SAR + AF × (EP − Current SAR)
- SAR: The current stop level.
- EP (Extreme Point): The highest high reached during the current uptrend, or the lowest low during the current downtrend.
- AF (Acceleration Factor): A multiplier that starts small and increases as the trend makes new extremes.
The acceleration factor
Wilder’s default settings are:
- Starting AF: 0.02
- Increment: 0.02 each time a new extreme point is made
- Maximum AF: 0.20
At the start of a trend, the dots move slowly, giving the trade room to breathe. As the trend makes new highs (or lows), the AF increases and the dots move faster towards price. This tightens the stop as the trend matures, locking in more profit.
The flip
When price crosses the current SAR level, the indicator “flips” to the other side of price. The new SAR is set at the extreme point of the previous trend, and the AF resets to its starting value.
How to Read the Dots
| What you see | What it suggests |
|---|---|
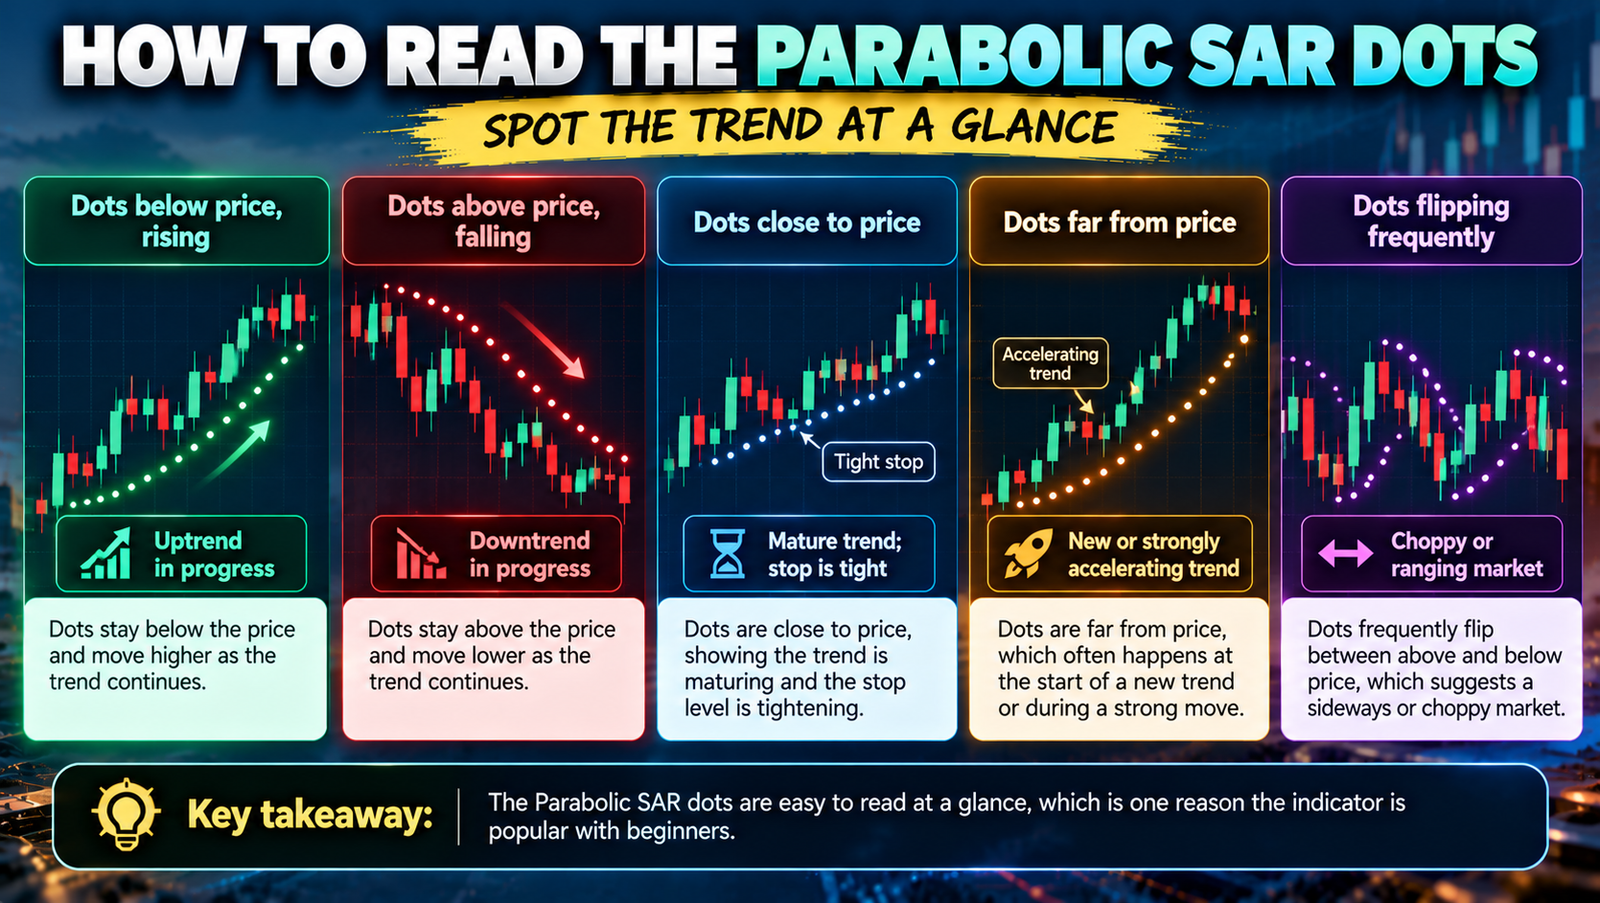
| Dots below price, rising | Uptrend in progress |
| Dots above price, falling | Downtrend in progress |
| Dots close to price | Mature trend; stop is tight |
| Dots far from price | New or strongly accelerating trend |
| Dots flipping frequently | Choppy or ranging market |
The dots are easy to read at a glance, which is one reason the Parabolic SAR is popular with beginners.
Using the Parabolic SAR as a Trailing Stop
The most practical use of the indicator is as a trailing stop for trades you have already entered.
For long trades
- Enter your trade using your normal method.
- Once the dots are below price, place your stop at the latest dot.
- Each new candle, move your stop up to the new dot.
- Exit when price closes below the dots, or when the dots flip above price.
For short trades
- Enter your short trade.
- Place your stop at the latest dot above price.
- Move it down with each new dot.
- Exit when price closes above the dots, or when they flip below price.
Because the stop only moves in the direction of your trade, you never increase risk once you are in profit. This makes trailing with the Parabolic SAR a simple, rules-based way to let winners run.
Intrabar vs close-based exits
Some traders exit as soon as price touches the dot during a candle. Others wait for a candle close beyond the dot to avoid being stopped out by brief spikes. Choose one approach and use it consistently. Touch-based exits protect profit faster but can be triggered by short-lived spikes, especially around news releases. Close-based exits give the trade more room but can result in a slightly worse exit price when the trend genuinely reverses. Record which method you use in your trading plan and review the results after a meaningful number of trades.
Parabolic SAR Trading Strategies
1. Stop-and-reverse (Wilder’s original method)
The trader is always in the market: long when the dots are below price and short when they are above. Each flip closes the current trade and opens one in the opposite direction.
This works well in strong trends, but in ranging markets it leads to many small losses, because the dots flip back and forth. For that reason, most modern traders add filters.
2. Trend filter with a moving average
- Use a 200-period moving average to define the main trend.
- Only take long signals (dots flipping below price) when price is above the moving average.
- Only take short signals when price is below it.
- Trail the stop with the dots.
This avoids trading against the bigger trend.
3. ADX filter
Because the indicator struggles in ranges, many traders only act on its signals when the Average Directional Index (ADX) is above about 20 or 25, which suggests a trending market. This simple filter can remove many false flips.
4. Exit-only use
Some traders use a completely different method for entries, such as breakouts, pullbacks or SMC setups, and use the Parabolic SAR purely for exits. This combines a high-quality entry with an objective trailing stop.
5. Combined with momentum oscillators
Pairing the dots with an oscillator such as RSI or MACD can help confirm momentum. For example, a trader may only take a bullish flip when MACD is also above its signal line.
Best Settings for the Indicator
| Setting | Effect | Suits |
|---|---|---|
| Default (0.02 start, 0.02 step, 0.20 max) | Balanced sensitivity | Most traders and timeframes |
| Lower step (for example 0.01, max 0.10) | Slower dots, wider stops, fewer flips | Swing traders and volatile markets |
| Higher step (for example 0.03, max 0.30) | Faster dots, tighter stops, more flips | Short-term traders who want quick exits |
Lower settings keep you in trends longer but give back more profit at the end. Higher settings lock in profit faster but may exit too early. Test settings on historical data for the market and timeframe you trade.

Worked Example: Trailing a Trend With the Parabolic SAR
Imagine EUR/USD on the 4-hour chart. Price is above the 200 EMA and ADX reads 27, suggesting an uptrend.
- The dots flip below price at 1.1600. A trader buys at 1.1610, with the first dot at 1.1570 as the stop (40 pips of risk).
- Over the next few days, price rises to 1.1700. The dots rise with it, and the stop moves to 1.1650, locking in 40 pips of profit.
- Price continues to 1.1760, and as the AF increases, the dots move faster. The stop reaches 1.1725.
- Price then pulls back and closes below the dots at 1.1720. The trade is closed at about 1.1720.
The trade gains about 110 pips against 40 pips of initial risk, without the trader needing to guess the top.
This example is illustrative and uses hypothetical prices.
Parabolic SAR on Different Timeframes
- Lower timeframes (5 to 15 minutes): The dots flip often, which suits quick intraday exits but produces more noise. Use a higher-timeframe trend filter.
- Intraday swing (1 hour to 4 hours): A good balance for many forex traders, giving clearer trends while still allowing several trades per week.
- Daily and weekly: Fewer signals, wider stops and longer holding periods, suited to swing and position traders.
Whichever timeframe you choose, apply the Parabolic SAR consistently and size your position so the distance to the first dot fits your risk limit.
A Simple Parabolic SAR Checklist
- Is the bigger trend clear on a higher timeframe?
- Is ADX above about 20 or 25, suggesting a trending market?
- Do the dots agree with the trend direction?
- Is the distance to the first dot acceptable for my position size?
- Will I exit on a touch or on a candle close?
- Am I moving the stop only in the direction of the trade?
Running through this list before each trade helps you use the Parabolic SAR in the conditions where it works best and avoid the choppy markets where it struggles.
Advantages and Limitations
Advantages
- Simple, visual and easy to understand
- Provides objective trailing stop levels
- Tightens automatically as trends mature
- Works on any market and timeframe
Limitations
- Many false signals in ranging markets
- Lags at the start of new trends
- Can exit strong trends during normal pullbacks
- Does not measure trend strength on its own
Parabolic SAR vs Other Trailing Stop Methods
| Method | How it trails | Main strength |
|---|---|---|
| Parabolic SAR | Dots that accelerate with the trend | Tightens automatically |
| ATR trailing stop | Fixed multiple of ATR behind price | Adapts to volatility |
| Moving average | Exit on close beyond a moving average | Smooth and simple |
| Swing lows/highs | Stop behind the latest swing point | Based on market structure |
Some traders combine methods, for example using the tighter of an ATR stop and the dots.

Common Mistakes
- Using it in ranges: Frequent flips lead to repeated losses.
- Ignoring the bigger trend: Counter-trend signals often fail.
- Treating every flip as an entry: Flips are better as exit signals unless filtered.
- Not adjusting for volatility: Default settings may be too tight for volatile pairs.
- Moving the stop the wrong way: The stop should only move in the direction of the trade.
- Using it alone: Combine it with trend and strength filters for better results.
Using the Parabolic SAR in Indian Markets
The indicator works on any liquid market, including NSE currency futures such as USD/INR, Nifty and Bank Nifty futures, and MCX commodities. USD/INR often moves in narrow ranges, so the dots can flip frequently; adding an ADX filter or using higher timeframes can help.
Indian residents should trade currencies only through recognised exchanges such as NSE and BSE, via SEBI-registered brokers. Leveraged forex trading through offshore CFD platforms is not permitted under FEMA.
FAQs
What does Parabolic SAR stand for?
SAR stands for “Stop and Reverse”. The indicator was designed to show where to place a stop and when to reverse a position.
What are the default settings?
A starting acceleration factor of 0.02, an increment of 0.02 and a maximum of 0.20.
Is it good for beginners?
Yes. It is simple and visual, but beginners should combine it with a trend filter to avoid false signals in ranges.
Can I use it for entries?
Yes, but entries work best when filtered by the bigger trend and trend strength. Many traders use it mainly for exits.
Which timeframe works best?
It works on any timeframe, but trending timeframes such as 4-hour and daily often give cleaner signals.
Conclusion
The Parabolic SAR turns trailing stops into a simple visual routine: follow the dots, move your stop with each new one and exit when price crosses them. It shines in strong trends and helps you lock in profit as a move matures.
Its weakness is choppy markets, so combine it with a trend filter such as a moving average or ADX, choose settings that suit your market and timeframe, and manage risk carefully. Used this way, the Parabolic SAR can become a reliable part of your exit strategy.