Introduction to the ADX Indicator Strategy
The ADX Indicator Strategy is one of the most effective approaches used by Forex traders to identify the strength of a market trend without focusing on its direction. Developed by J. Welles Wilder, the Average Directional Index (ADX) helps traders determine whether a market is trending strongly enough to justify entering a trade or whether it is better to stay out during ranging conditions. Unlike many technical tools that attempt to predict price direction, the ADX focuses entirely on trend strength, making it an essential component of modern Forex trading.
Many beginner traders lose money because they enter trades during sideways markets where price lacks momentum. The ADX Indicator Strategy helps eliminate this problem by measuring the intensity of a trend before a position is opened. When combined with proper technical indicators, careful momentum trading, and detailed Forex analysis, the ADX becomes one of the most reliable tools for filtering low-quality setups and identifying high-probability opportunities.
Whether you are a day trader, swing trader, or long-term investor, learning the ADX Indicator Strategy can improve your ability to recognize strong market conditions and make more confident trading decisions.
Understanding the ADX Indicator
The Average Directional Index, commonly called ADX, is a technical indicators tool designed to measure the strength of a market trend. Unlike moving averages or oscillators, the ADX does not indicate whether the trend is bullish or bearish. Instead, it simply measures how strong the current trend is.
The ADX indicator works alongside two additional lines known as the Positive Directional Indicator (+DI) and the Negative Directional Indicator (-DI). Together, these three components form the complete Directional Movement System.
The +DI line measures bullish pressure, while the -DI line measures bearish pressure. The ADX line itself calculates overall trend strength, regardless of whether buyers or sellers control the market.
This unique design makes the ADX Indicator Strategy highly effective because traders first identify the direction using +DI and -DI before confirming whether the trend is strong enough through the ADX value.
Why Trend Strength Matters in Forex Trading
One of the biggest mistakes made by beginner traders is assuming every market movement represents a trend. In reality, Forex markets spend a significant amount of time moving sideways without establishing clear direction.
The ADX Indicator Strategy helps traders separate strong trends from weak markets by measuring trend strength objectively. Higher ADX values indicate stronger trends, while lower readings suggest limited momentum and increased market uncertainty.
Understanding trend strength allows traders to avoid entering positions during choppy market conditions where false breakouts and whipsaws occur frequently.
Instead of chasing every price movement, traders focus only on markets where momentum clearly favors one side.
Understanding ADX Values
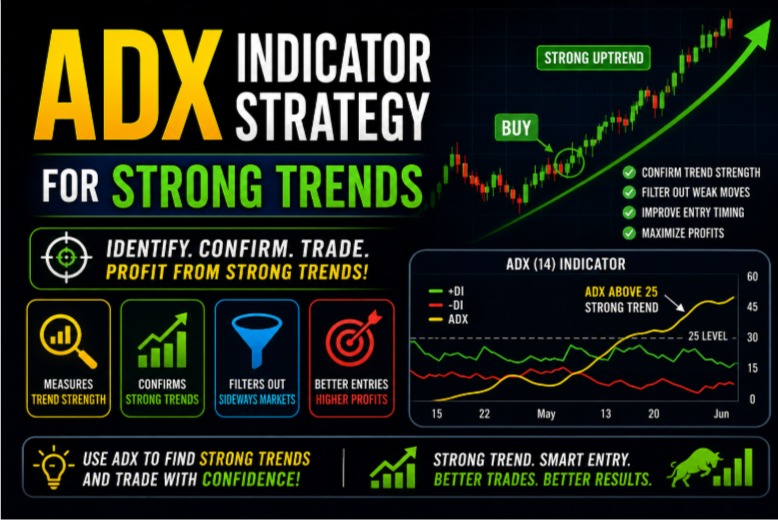
The ADX indicator typically moves between 0 and 100.
An ADX reading below 20 usually indicates a weak or ranging market where trends have not yet developed.
Readings between 20 and 25 often suggest that a new trend may be beginning to emerge.
When the ADX rises above 25, the market generally enters a strong trending phase. Higher readings above 40 indicate exceptionally powerful market momentum.
The ADX Indicator Strategy does not rely solely on these numbers but uses them alongside other technical indicators to confirm market conditions before entering trades.
Using the ADX Indicator Strategy for Bullish Trends
A bullish setup begins when the +DI line crosses above the -DI line while the ADX rises above 25.
This combination suggests buyers have gained control and that the upward movement possesses sufficient trend strength to support continuation.
Many traders wait for minor pullbacks before entering positions because this improves risk-to-reward ratios while allowing the trend to remain intact.
Combining the ADX Indicator Strategy with moving averages, support zones, and candlestick confirmation strengthens overall Forex analysis.
Using the ADX Indicator Strategy for Bearish Trends
Bearish opportunities follow the opposite principle.
When the -DI crosses above the +DI while the ADX continues rising above 25, sellers dominate the market and downward momentum strengthens.
This setup allows traders to participate in established downtrends instead of attempting risky counter-trend positions.
Successful momentum trading often begins by identifying these strong bearish conditions before price accelerates further.
Combining ADX with Technical Indicators
Although the ADX is powerful on its own, combining it with other technical indicators significantly improves trading accuracy.
Moving averages help determine overall market direction. Support and resistance identify important reaction zones. Candlestick patterns provide entry confirmation, while oscillators help evaluate momentum.
Instead of replacing other technical indicators, the ADX Indicator Strategy acts as a filter, allowing traders to focus only on setups supported by strong trend strength.
This combination reduces false signals and improves consistency over time.
ADX Indicator Strategy for Momentum Trading
One of the most effective uses of the ADX Indicator Strategy is momentum trading.
Momentum traders aim to join markets that are already moving strongly rather than predicting reversals. Rising ADX values indicate increasing market participation, which often leads to larger price movements.
Rather than entering trades randomly, momentum trading with ADX encourages traders to wait until the market demonstrates sufficient strength before committing capital.
This disciplined approach improves trade quality while reducing emotional decision-making.
Using ADX in Different Market Conditions
The ADX performs differently depending on overall market structure.
During strong trends, rising ADX values confirm that momentum continues building.
During consolidation periods, falling ADX readings suggest weakening participation and limited trading opportunities.
Experienced traders understand that low ADX values are not necessarily bearish or bullish. Instead, they simply indicate insufficient trend strength for high-probability trend-following trades.
This understanding forms the foundation of effective Forex analysis.
Risk Management While Using the ADX Indicator Strategy
Risk management remains essential regardless of how strong an ADX signal appears.
Stop-loss orders should always be placed beyond logical support or resistance levels rather than relying solely on indicator readings.
Position sizing should remain consistent across all trades to protect trading capital during unavoidable losing streaks.
Even the best technical indicators cannot predict every market movement, making disciplined money management a critical part of every successful ADX Indicator Strategy.
Common Mistakes Traders Make
One of the most common mistakes is assuming a high ADX automatically means the market will continue rising.
The ADX measures trend strength, not trend direction. A strong ADX can accompany either bullish or bearish markets.
Another frequent mistake involves entering trades immediately after ADX rises without confirming the direction using the +DI and -DI lines.
Many traders also ignore broader Forex analysis, relying entirely on the indicator instead of considering price action and overall market structure.
Best Timeframes for the ADX Indicator Strategy
The ADX Indicator Strategy works effectively across multiple trading styles.
Scalpers often apply it to five-minute and fifteen-minute charts, while day traders commonly use one-hour charts.
Swing traders generally prefer four-hour and daily charts because they produce smoother trends and fewer false signals.
Regardless of timeframe, combining ADX with careful momentum trading principles and disciplined execution produces more reliable trading decisions.
Advantages of the ADX Indicator Strategy
The ADX Indicator Strategy offers several advantages for Forex traders.
It objectively measures trend strength, helping traders avoid weak markets and focus on higher-quality opportunities.
It complements many other technical indicators, making it easy to integrate into existing trading systems.
The strategy also improves Forex analysis by separating trending markets from ranging conditions, allowing traders to adapt their approach accordingly.
These benefits make the ADX one of the most respected trend-confirmation tools available.
Limitations of the ADX Indicator Strategy
Despite its strengths, the ADX has limitations.
Because it is a lagging indicator, the ADX often confirms trends after they have already begun.
Rapid market reversals may occur before the indicator has enough time to adjust.
The ADX Indicator Strategy should therefore be used alongside price action, support and resistance, and other technical indicators rather than as a standalone decision-making tool.
Understanding these limitations allows traders to use the indicator more effectively while avoiding unrealistic expectations.
Conclusion
The ADX Indicator Strategy is one of the most valuable trend-following methods available to Forex traders because it focuses on measuring trend strength rather than predicting market direction. By combining the ADX with technical indicators, disciplined momentum trading, and comprehensive Forex analysis, traders can identify stronger opportunities while avoiding low-quality trades during sideways markets. Although no indicator guarantees success, consistent practice, proper risk management, and patience allow traders to maximize the benefits of the ADX Indicator Strategy and build a more disciplined approach to Forex trading.
Frequently Asked Questions
What is the ADX Indicator Strategy?
The ADX Indicator Strategy is a trading method that uses the Average Directional Index to measure trend strength and determine whether market conditions are suitable for trend-following trades.
What does the ADX indicator measure?
The ADX measures trend strength only. It does not indicate whether the market is bullish or bearish but instead shows how strong the current trend is.
Is the ADX good for momentum trading?
Yes. The ADX is widely used for momentum trading because rising ADX values indicate strengthening market participation and increasing trend momentum.
Can beginners use the ADX Indicator Strategy?
Absolutely. Beginners can use the ADX Indicator Strategy to filter weak market conditions and improve their overall Forex analysis, especially when combined with other technical indicators.
Which timeframe works best for the ADX Indicator Strategy?
The strategy works across all timeframes, but many traders prefer the four-hour and daily charts because they provide clearer trends, stronger trend strength readings, and more reliable trading opportunities.