
Introduction
Every currency pair is a tug-of-war between two currencies. When EUR/USD rises, is the euro strong, the dollar weak, or both? A single chart can’t tell you. A currency strength meter tries to answer that by comparing each currency against a basket of others, then ranking them from strongest to weakest.
Quick answer: A currency strength meter measures how each major currency has moved against several others over a chosen period, and ranks them. It usually averages each currency’s percentage change across the pairs it appears in. Traders use it to find pairs that combine a strong currency with a weak one, then confirm the idea on the actual price chart. Strength meters are backward-looking, vary by method and time frame, and aren’t trade signals on their own.
Why this matters
- It helps you see whether a move is driven by one currency (for example, broad dollar weakness) or is specific to one pair.
- It can steer you towards pairs with clearer direction and away from pairs where both currencies are moving together.
- For Indian residents: strength meters usually cover major global currencies. You can apply the idea to rupee pairs (USD/INR, EUR/INR, GBP/INR, JPY/INR) and permitted cross-currency pairs traded on NSE or BSE through a SEBI-registered broker. Offshore platforms offering exotic pairs aren’t permitted for residents.
How a currency strength meter works
Most meters follow the same basic idea:
- Choose a set of currencies (often the eight majors: USD, EUR, GBP, JPY, CHF, CAD, AUD, NZD).
- Take every pair formed from them.
- Measure each pair’s percentage change over the chosen period (for example, the last day or the last 4 hours).
- For each currency, collect the change in every pair it appears in, flipping the sign when it’s the quote (second) currency.
- Average those changes to get a strength score, then rank the currencies.
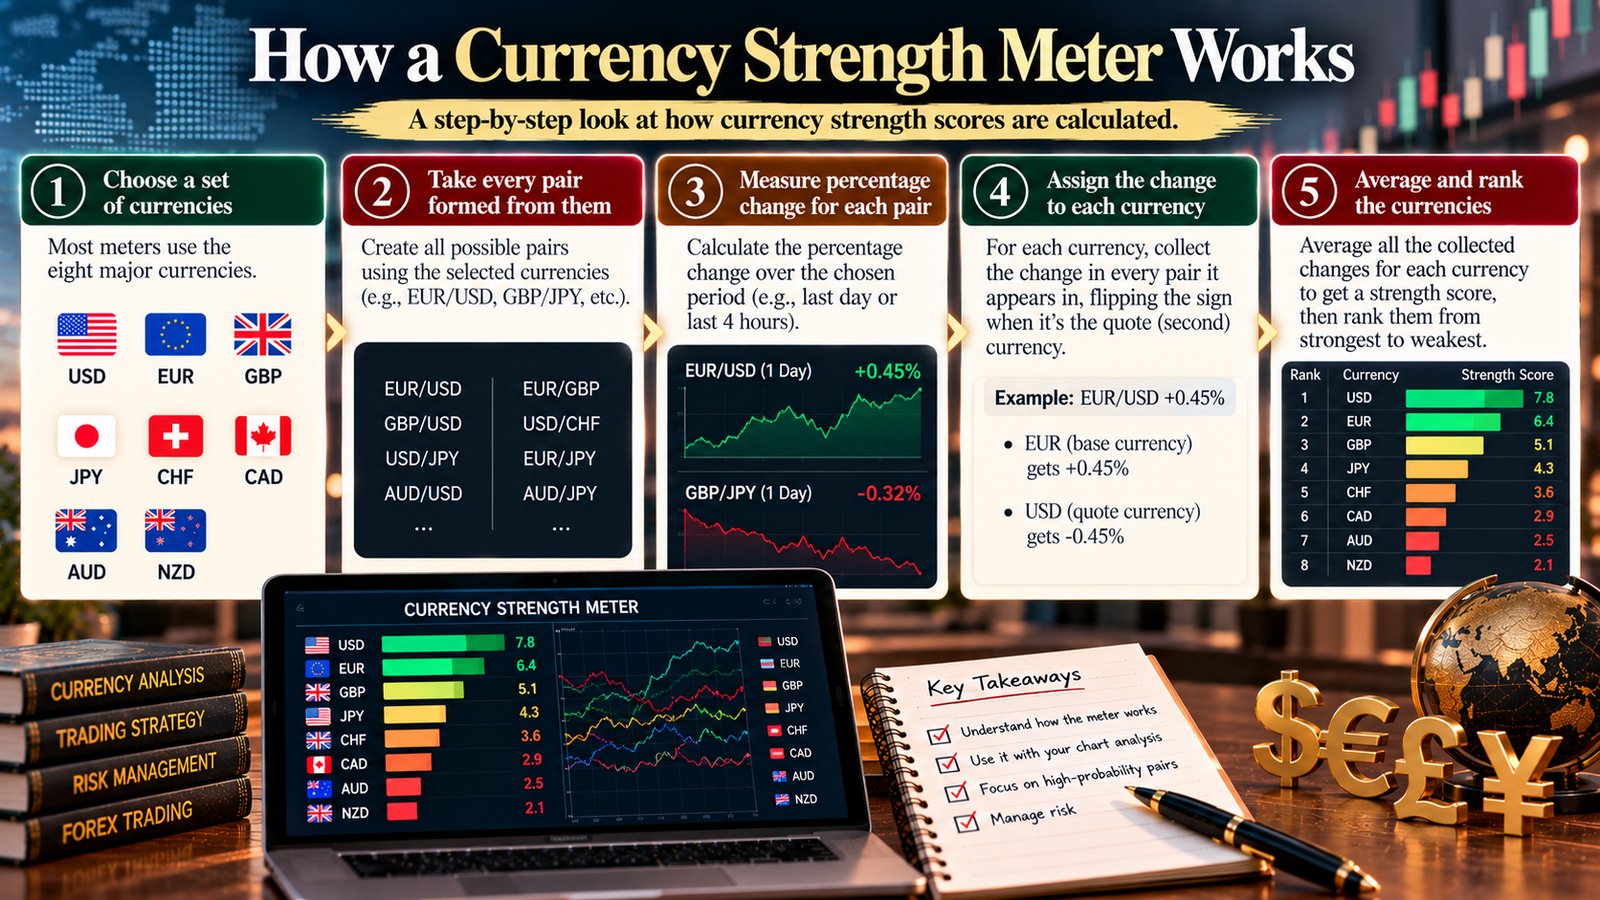
The exact method varies. Some meters use more pairs, weight pairs differently, or use indicators such as RSI or moving averages instead of simple percentage change. That’s why two meters can disagree.
Worked example: four currencies (illustrative)
Suppose over one day the six pairs between USD, EUR, GBP and JPY moved like this:
| Pair | Change |
|---|---|
| EUR/USD | +0.40% |
| GBP/USD | +0.20% |
| USD/JPY | −0.50% |
| EUR/GBP | +0.20% |
| EUR/JPY | −0.10% |
| GBP/JPY | −0.30% |
Now calculate each currency’s average, flipping the sign when it’s the quote currency:
| Currency | Contributions | Strength score | Rank |
|---|---|---|---|
| JPY | +0.50 (USD/JPY flipped), +0.10 (EUR/JPY flipped), +0.30 (GBP/JPY flipped) | +0.30 | 1 (strongest) |
| EUR | +0.40, +0.20, −0.10 | +0.17 | 2 |
| GBP | +0.20, −0.20 (EUR/GBP flipped), −0.30 | −0.10 | 3 |
| USD | −0.40 (EUR/USD flipped), −0.20 (GBP/USD flipped), −0.50 | −0.37 | 4 (weakest) |
Calculated in code; changes are illustrative.
Reading it: the yen was strongest and the dollar weakest, so the biggest move was in USD/JPY (−0.50%). A strong-vs-weak pairing would point to selling USD/JPY, subject to confirmation on the chart.
Related measures: DXY, NEER and REER
| Measure | What it tracks | Use for traders |
|---|---|---|
| Currency strength meter | Short-term relative moves of several currencies | Pair selection and context |
| US Dollar Index (DXY) | USD against six currencies: EUR 57.6%, JPY 13.6%, GBP 11.9%, CAD 9.1%, SEK 4.2%, CHF 3.6% | Broad dollar strength (heavily euro-weighted) |
| RBI NEER | Rupee against a trade-weighted basket (e.g. 40 currencies) | Broad rupee strength, before inflation |
| RBI REER | NEER adjusted for inflation differences | Rupee competitiveness over months and years |
Fact: RBI publishes NEER and REER indices for the rupee. The REER adjusts the NEER for inflation differences between India and its trading partners; a value above 100 suggests the rupee has appreciated in real terms relative to the base period. Business Standard reported the 40-currency REER at 97.6 in September 2025.
Analysis: DXY and REER are slower, more official measures, useful for the big picture. Strength meters are faster and more tactical, but less standardised.
How to use a currency strength meter
1. Pair strong with weak
The core idea: buy the strongest currency against the weakest, or sell the weakest against the strongest. Two currencies moving in opposite directions tend to produce cleaner moves than two currencies both drifting the same way.
2. Match the time frame
A meter based on the last hour tells a different story from one based on the last week. Use the meter’s time frame that matches your trading time frame, and check that a higher time frame isn’t pointing the other way.
3. Look for persistence, not a single snapshot
One reading can flip quickly after news. Currencies that stay strong or weak across several periods are more useful than a one-off spike.
4. Confirm on the chart
The meter suggests which pair; the chart decides whether and where. Look for a trend or setup on the pair itself, and plan entry, stop and target from price structure.
5. Avoid the obvious traps
- Don’t enter a pair that has already moved sharply just because the meter now shows a big gap; the move may be largely done.
- Watch for correlation: trading EUR/JPY and GBP/JPY together because both show “strong vs weak” doubles your yen exposure.
- Check the economic calendar; strength can reverse abruptly on data or central bank news.
The India angle: applying strength to rupee pairs
Resident Indians can trade USD/INR, EUR/INR, GBP/INR and JPY/INR (plus permitted cross-currency pairs) on NSE or BSE. You can extend the same method to the rupee.

Worked example (illustrative)
Continuing the earlier example, suppose the rupee pairs moved like this on the same day:
| Rupee pair | Change | INR’s contribution |
|---|---|---|
| USD/INR | −0.10% | +0.10 |
| EUR/INR | +0.30% | −0.30 |
| GBP/INR | +0.10% | −0.10 |
| JPY/INR | +0.40% | −0.40 |
| INR strength score | −0.175 |
Calculated in code; changes are illustrative and consistent with the earlier pairs.
The rupee sits between GBP (−0.10) and USD (−0.37): weaker than the yen and euro, stronger than the dollar. The largest strong-vs-weak gap among rupee pairs is JPY (+0.30) vs INR (−0.175), suggesting JPY/INR as a pair to study, if the chart agrees.
Trade plan (illustrative)
NSE JPY/INR futures are quoted in rupees per 100 yen, and one lot is ¥100,000, so a ₹1 move in the quote equals ₹1,000 per lot.
| Item | Value |
|---|---|
| Entry (buy JPY/INR on a pullback) | 64.00 |
| Stop-loss (below recent swing low) | 63.70 |
| Target (prior high) | 64.60 |
| Risk per lot | 0.30 × 1,000 = ₹300 |
| Potential reward per lot | 0.60 × 1,000 = ₹600 |
| Capital and risk | ₹1,00,000 at 1% = ₹1,000 |
| Position size | ₹1,000 ÷ ₹300 = 3.3, round down to 3 lots (risk ₹900; potential reward ₹1,800) |
Figures are before brokerage, charges and slippage. RBI rules for rupee-pair derivatives are designed around users with an underlying currency exposure, so check the current requirements with your broker.
Step-by-step: using a strength meter
- Choose one meter and note how it calculates strength.
- Set it to your trading time frame and check a higher one.
- Identify persistently strong and weak currencies.
- Shortlist pairs that combine them, avoiding correlated duplicates.
- Confirm the trend or setup on the pair’s chart.
- Plan entry, stop and target from price structure.
- Size the position from your risk per trade.
- Check the economic calendar, then record the trade in your journal.
Expert analysis
Fact: Currency strength meters typically average each currency’s percentage change across a set of pairs; methods vary between tools. The US Dollar Index measures USD against six currencies, with the euro at 57.6% of the basket. RBI publishes NEER and REER indices that measure the rupee against trade-weighted baskets.
Analysis: A strength meter is essentially a summary of price changes you could see on individual charts. Its value is speed and perspective: it helps you spot whether a move is broad or pair-specific. Its limits come from the same source. It’s backward-looking, its output depends on the time frame and method, and a strong reading often appears after much of the move has already happened.
Opinion: Beginners should treat a strength meter as a filter for choosing pairs, not a trigger for entries. Pick one tool, understand how it’s calculated, and always make the final decision from price structure and a defined risk plan. For rupee pairs, combine short-term strength readings with the broader picture from DXY and RBI’s REER.
Common mistakes
- Treating the meter as a buy or sell signal.
- Chasing a big strength gap after the move has already happened.
- Comparing meters with different methods and getting confused by disagreement.
- Ignoring time frame: a 1-hour reading can contradict the daily trend.
- Stacking correlated pairs, such as several yen pairs at once.
- Ignoring news, which can flip strength rankings in minutes.
- Using offshore platforms to trade exotic pairs a meter highlights; residents may trade only permitted pairs on Indian exchanges.
Myths vs facts
| Myth | Fact |
|---|---|
| “The meter shows where currencies will go next.” | It shows where they have been over the chosen period. |
| “All strength meters give the same result.” | Methods, pairs and time frames differ, so results differ. |
| “Strongest vs weakest always makes the best trade.” | The move may be exhausted; the chart must confirm. |
| “A strong DXY means every currency is weak.” | DXY is heavily euro-weighted; the dollar can be strong against the euro but weak against others. |
| “REER tells you where the rupee will trade tomorrow.” | REER is a slow, inflation-adjusted measure of competitiveness, not a short-term forecast. |
Key takeaways
- A currency strength meter ranks currencies by averaging their moves across several pairs.
- Pair a persistently strong currency with a persistently weak one, then confirm on the chart.
- Match the meter’s time frame to your trading, and watch for correlated positions.
- Meters are backward-looking and method-dependent; they’re filters, not signals.
- DXY and RBI’s NEER and REER give the broader picture for the dollar and the rupee.
- In India, apply the idea to permitted pairs on NSE or BSE and size from fixed risk. In our example, 3 JPY/INR lots risked ₹900 for a potential ₹1,800.
FAQs
- What is a currency strength meter? A tool that ranks currencies from strongest to weakest by comparing each one’s moves against several other currencies over a chosen period.
- How is currency strength calculated? Typically by averaging each currency’s percentage change across the pairs it appears in, flipping the sign when it’s the quote currency. Methods vary between tools.
- How do I use a currency strength meter? Find persistently strong and weak currencies, shortlist pairs that combine them, then confirm the setup on the pair’s chart before trading.
- Is a currency strength meter accurate? It accurately summarises past moves for its chosen method and period, but it doesn’t predict future moves. Different meters can disagree.
- What time frame should I use? The same time frame you trade on, while checking a higher time frame for the broader picture.
- Can I build my own currency strength meter? Yes. A spreadsheet that averages each currency’s percentage change across its pairs, as in this article’s example, is a simple version.
- What’s the difference between a strength meter and the dollar index? A strength meter compares many currencies against each other; DXY measures only the US dollar against six currencies, weighted heavily towards the euro.
- What is the DXY made of? EUR 57.6%, JPY 13.6%, GBP 11.9%, CAD 9.1%, SEK 4.2% and CHF 3.6%.
- What are NEER and REER? RBI’s trade-weighted indices of the rupee. NEER is nominal; REER adjusts for inflation differences with trading partners.
- What does a REER above 100 mean? The rupee has appreciated in real terms relative to the base period, which can make exports less competitive.
- Does a strength meter include the rupee? Most focus on major global currencies. You can apply the same method to rupee pairs yourself.
- Which rupee pairs can Indian residents trade? USD/INR, EUR/INR, GBP/INR and JPY/INR, plus permitted cross-currency pairs, on NSE or BSE through a SEBI-registered broker.
- Why did the strongest currency suddenly become weak? News, central bank decisions or data surprises can reverse short-term strength quickly.
- Should I trade several pairs with the same strong currency? Be careful. Those positions are correlated, so your real exposure to that currency is larger than it looks.
- Is a strength meter useful for beginners? Yes, as a filter for choosing pairs and understanding context, but not as a standalone signal.
- Can a strength meter replace chart analysis? No. It suggests which pairs to look at; the chart decides entry, stop and target.
- How do I size a trade after using a strength meter? The same way as any trade: set the stop from price structure, calculate risk per lot, and divide your fixed rupee risk by it.