Introduction
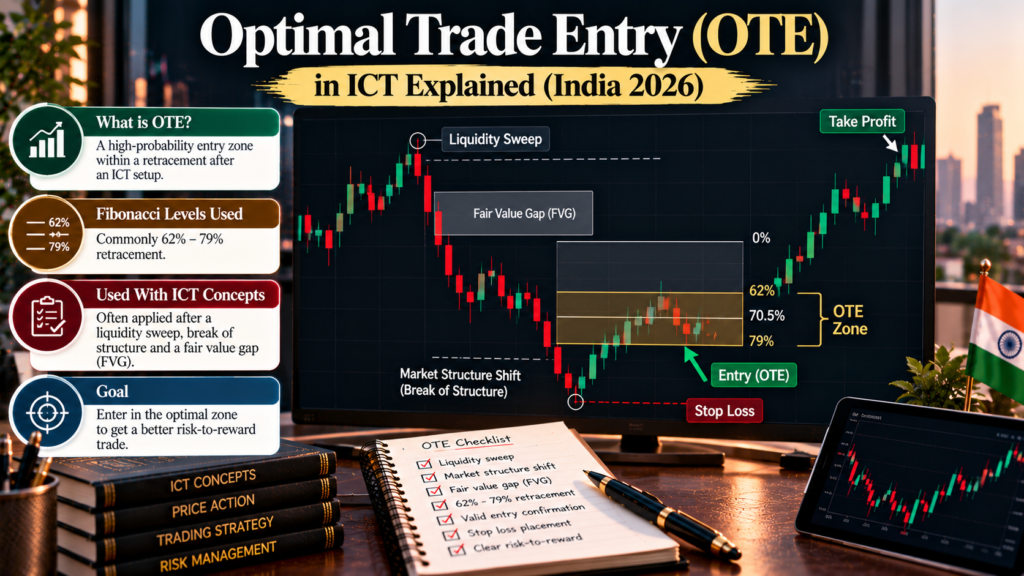
If you follow ICT or smart money concepts (SMC) content, you’ve probably heard traders say they’re waiting for price to reach the “OTE” before entering. Optimal Trade Entry is ICT’s name for a specific pullback zone within a price swing: deep enough to offer a good price, but not so deep that the move has clearly failed. Understanding optimal trade entry ICT style means knowing what the zone is, how to draw it, and what it can and can’t do.
Quick answer: OTE is the zone between the 62% and 79% retracement of a swing, with 70.5% often called the “sweet spot”. In an uptrend, you draw a Fibonacci tool from the swing low to the swing high and look to buy when price pulls back into 62–79%. In a downtrend, you draw from high to low and look to sell in that zone. ICT traders usually want extra confluence (a market structure shift, an order block or fair value gap, a liquidity sweep) before entering. OTE is a way of pricing entries, not a proven edge on its own, so it needs a stop, fixed risk and testing.
Why this matters
- OTE gives beginners a concrete rule for where to enter a pullback, instead of chasing price.
- It connects directly to the ICT idea of buying in discount (below 50%) and selling in premium (above 50%).
- Indian traders can apply OTE to permitted pairs such as USD/INR futures on NSE or BSE, through a SEBI-registered broker. Many ICT examples online use offshore pairs and platforms that aren’t permitted for residents.
What is Optimal Trade Entry?
OTE comes from the ICT (Inner Circle Trader) teaching of Michael J. Huddleston. It uses Fibonacci retracement levels applied to a dealing range, the most recent significant swing, to mark where a pullback is expected to offer the best price.
The OTE levels
| Level | Role in ICT teaching |
|---|---|
| 50% (equilibrium) | Dividing line between premium and discount |
| 62% | Start of the OTE zone; shallower entry, more likely to be reached |
| 70.5% | The “sweet spot”; a balance between price and probability of being reached |
| 79% | Deep end of the zone; best price, least likely to be reached |
| Beyond 79% towards 100% | Many ICT traders treat a sustained move here as weakening or invalidating the setup |
OTE vs a standard Fibonacci retracement
| Standard Fibonacci retracement | ICT OTE | |
|---|---|---|
| Key levels | 23.6%, 38.2%, 50%, 61.8%, 78.6% | 62%, 70.5%, 79% (plus 50% for premium and discount) |
| Focus | Any level as possible support or resistance | One specific deep pullback zone |
| Context | Often used alone or with trend | Used with ICT concepts: structure shift, order blocks, FVGs, liquidity |
| Entry style | Varies | Limit or confirmation entries inside the zone |
The levels are close to the classic Fibonacci 61.8% and 78.6%. The main difference is the framework built around them.
How OTE fits premium and discount
- In a bullish dealing range (low to high), everything below 50% is discount. OTE (62–79%) is a deep discount zone to buy.
- In a bearish dealing range (high to low), everything above 50% is premium. OTE is a deep premium zone to sell.

How to draw the OTE zone
- Identify the dealing range: a clear, recent swing on your chosen time frame. ICT traders often want this swing to include a market structure shift (a break of a prior swing high in an uptrend, or low in a downtrend).
- Bullish setup: drag the Fibonacci tool from the swing low to the swing high.
- Bearish setup: drag from the swing high to the swing low.
- Add custom levels: 0, 0.5, 0.62, 0.705, 0.79 and 1.
- Shade 0.62–0.79 as the OTE zone.
Common ICT confluences
| Confluence | What it means | Why traders want it |
|---|---|---|
| Market structure shift (MSS) | Price breaks a recent swing in the new direction | Suggests the pullback is within a new move |
| Liquidity sweep | Price takes out a prior high or low before reversing | Stops were triggered, adding fuel for the move |
| Order block | The last opposite candle before a strong move | A zone ICT traders expect to react |
| Fair value gap (FVG) | A three-candle imbalance with a gap between wicks | Price often revisits it |
| Time of day (“kill zones”) | Specific session windows in ICT teaching | ICT traders prefer entries during active sessions |
These are ICT concepts and conventions. They add structure to decisions, but they’re not independently proven to improve results.
Worked example: USD/INR futures (illustrative)
USD/INR futures rally from a swing low of 94.80 to a swing high of 96.20, breaking a prior swing high (a market structure shift). The range is ₹1.40. Prices are round illustrative numbers.
Step 1: calculate the zone
| Level | Calculation | Price |
|---|---|---|
| 50% (equilibrium) | 96.20 − 1.40 × 0.50 | 95.500 |
| 62% (OTE start) | 96.20 − 1.40 × 0.62 | 95.332 |
| 70.5% (sweet spot) | 96.20 − 1.40 × 0.705 | 95.213 |
| 79% (OTE end) | 96.20 − 1.40 × 0.79 | 95.094 |
The OTE zone is roughly 95.09–95.33, all below 95.50 (discount).
Step 2: look for confluence
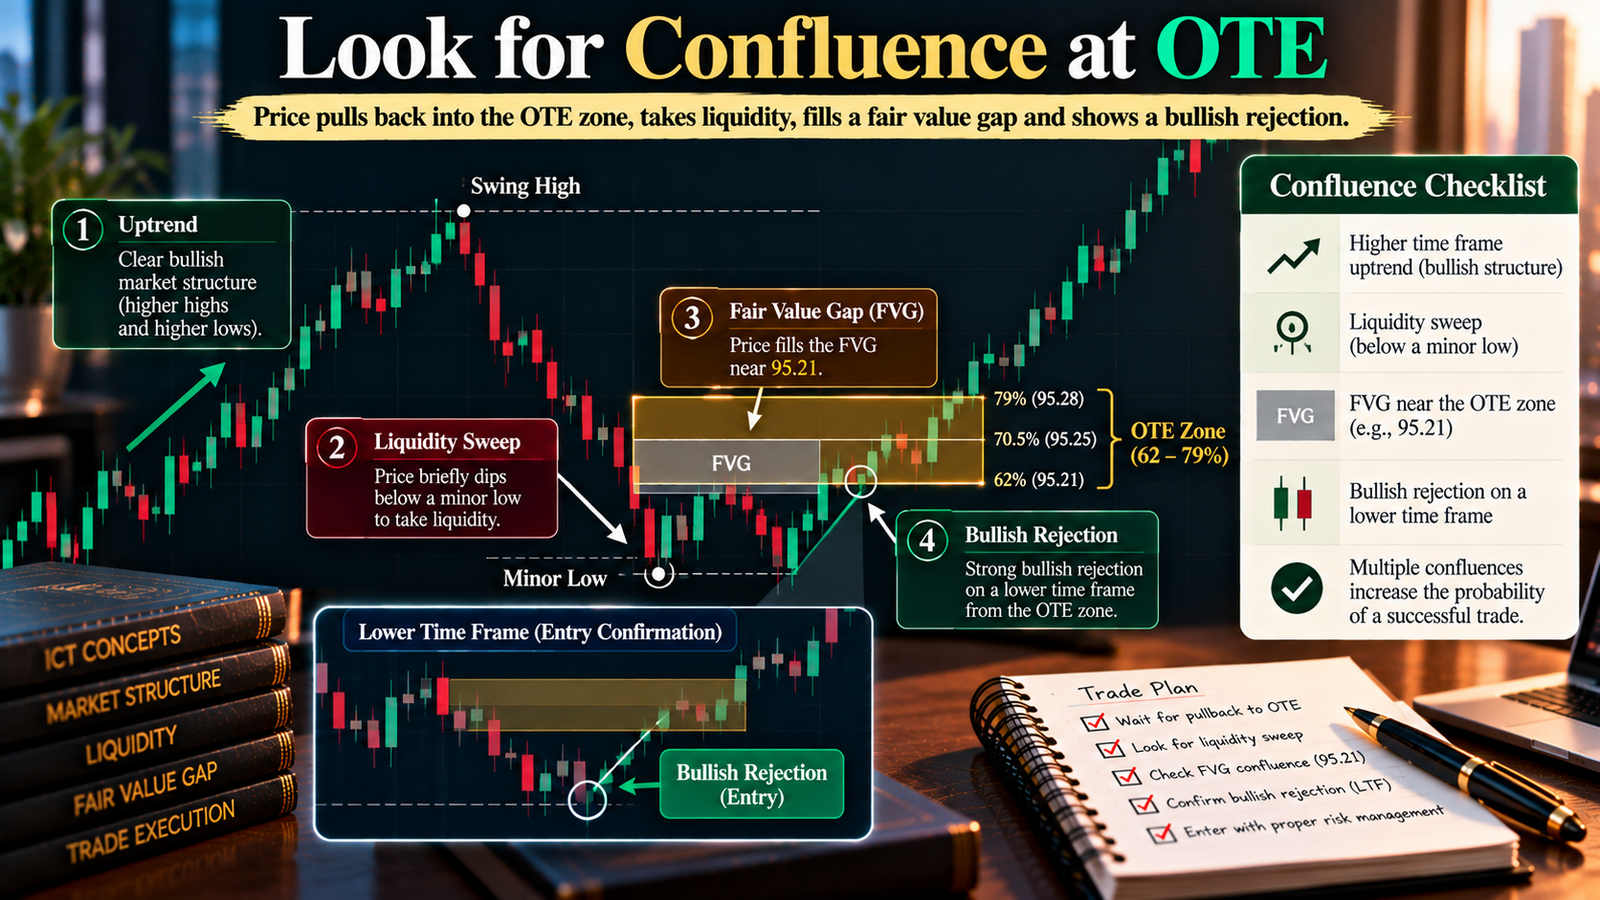
Suppose price pulls back into the zone, briefly dips below a minor low (a liquidity sweep), then fills a fair value gap near 95.21 and shows a bullish rejection on a lower time frame.
Step 3: plan the trade
NSE USD/INR: one lot = $1,000, so a ₹0.01 move = ₹10 per lot. Tick size is ₹0.0025.
| Item | Value |
|---|---|
| Entry (buy limit at 70.5%, rounded to tick) | 95.2125 |
| Stop-loss (just below the 94.80 swing low) | 94.75 |
| Target (back to the 96.20 swing high) | 96.20 |
| Risk per lot | (95.2125 − 94.75) × 1,000 = ₹462.50 |
| Potential reward per lot | (96.20 − 95.2125) × 1,000 = ₹987.50 |
| Reward-to-risk | About 2.1 : 1 |
| Capital and risk | ₹1,00,000 at 1% = ₹1,000 |
| Position size | ₹1,000 ÷ ₹462.50 = 2.2, round down to 2 lots (risk ₹925; potential reward ₹1,975) |
Calculated in code; before brokerage, charges and slippage.
Some traders set targets beyond the swing high using Fibonacci extensions; beginners may prefer the prior high as a simpler first target. The limit order may never fill if price doesn’t pull back that deep, which is part of the trade-off.
What does the evidence say?
Fact: OTE builds on Fibonacci retracement levels. A 2022 study by Tsinaslanidis, Guijarro and Voukelatos in Expert Systems with Applications, covering Dow Jones, NASDAQ-100 and DAX stocks, found that prices were no more likely to bounce at Fibonacci zones than at other, non-Fibonacci zones.
Fact: We found no peer-reviewed research testing ICT’s OTE model specifically.
Analysis: That doesn’t mean OTE can’t be part of a profitable plan. It means the zone itself isn’t a proven edge, so any edge must come from the full system: context, confluence, entry rules, risk management and execution. That can only be established by testing your exact rules over many trades.
Step-by-step OTE checklist
- Confirm the higher-time-frame direction.
- Identify a clear dealing range with a market structure shift.
- Draw the Fibonacci tool in the direction of the move.
- Mark 62%, 70.5% and 79%, and check the zone is in discount (longs) or premium (shorts).
- Look for at least one confluence: liquidity sweep, order block, FVG or lower-time-frame shift.
- Set a limit or confirmation entry inside the zone.
- Place the stop beyond the swing that defines the range.
- Set the target at the opposite swing or a planned extension.
- Size from fixed risk per trade.
- Journal the setup, including screenshots, and review after 50–100 trades.
Expert analysis
Fact: ICT’s OTE zone spans the 62%–79% retracement of a dealing range, with 70.5% as the “sweet spot”. It sits within discount for longs and premium for shorts. Research on stock indices found Fibonacci zones were no more likely to hold than other zones, and we found no peer-reviewed tests of ICT’s OTE model.
Analysis: OTE’s practical strength is discipline: it stops you from chasing moves and pushes you to buy pullbacks at a better price with a clearly defined invalidation point. Its main risks are subjectivity (which swing counts as the dealing range?) and confirmation bias (it’s easy to find an order block or FVG somewhere in any zone). Deep entries also mean some trades never fill, and those you miss can feel like losses.
Opinion: Beginners who like the ICT framework should keep it simple. Use one time frame for the dealing range, one clear confluence rule, a fixed stop beyond the swing and fixed risk per trade, then test for at least 50–100 trades. Treat claims that OTE is a “high-probability” entry with caution until your own journal supports them.
Common mistakes
- Choosing the dealing range after the fact to make the zone fit.
- Entering at 62% without any confluence, because price “is in OTE”.
- Ignoring the higher-time-frame direction and buying OTE in a downtrend.
- Placing the stop inside the zone rather than beyond the swing that defines it.
- Stacking too many ICT concepts until every chart has a reason to trade.
- Chasing after a missed fill, instead of accepting that some limit orders won’t execute.
- Trading offshore pairs from ICT videos on platforms not permitted for Indian residents.
Myths vs facts
| Myth | Fact |
|---|---|
| “OTE is a proven high-probability entry.” | We found no peer-reviewed tests of OTE, and research on Fibonacci zones in stocks found no special bounce advantage. |
| “70.5% is a magic number.” | It’s the midpoint of the 62–79% zone, a convention rather than a law. |
| “If price reaches OTE, it will reverse.” | Many pullbacks continue through the zone; that’s why stops matter. |
| “OTE is completely different from Fibonacci.” | OTE uses Fibonacci-based levels within a broader ICT framework. |
| “More ICT confluences always mean a better trade.” | More concepts also make it easier to justify any trade. |
Key takeaways
- OTE is ICT’s pullback zone between the 62% and 79% retracement of a dealing range, with 70.5% as the “sweet spot”.
- Draw from swing low to high for longs (buy in discount) and from high to low for shorts (sell in premium).
- ICT traders add confluence: market structure shift, liquidity sweep, order block or FVG.
- Evidence doesn’t show that Fibonacci-based zones have a special edge; any edge must come from your full, tested system.
- Always use a stop beyond the swing and fixed risk. In our example, 2 USD/INR lots risked ₹925 for a potential ₹1,975.
- Test one simple OTE rule set over 50–100 trades before trusting it.
FAQs
- What is Optimal Trade Entry (OTE) in ICT? A pullback zone between the 62% and 79% retracement of a price swing, used by ICT traders to enter in the direction of the move at a favourable price.
- Who created the OTE concept? It comes from the ICT (Inner Circle Trader) teaching of Michael J. Huddleston.
- What is the OTE sweet spot? The 70.5% retracement level, the midpoint of the 62–79% zone.
- How do I draw the OTE zone? For a bullish setup, draw the Fibonacci tool from the swing low to the swing high; for bearish, from high to low. Add custom levels at 0.62, 0.705 and 0.79.
- How is OTE different from standard Fibonacci retracement? It focuses on one deep zone (62–79%) and is used within ICT’s framework of structure shifts, order blocks, FVGs and liquidity.
- How does OTE relate to premium and discount? In a bullish range, OTE sits in discount (below 50%); in a bearish range, it sits in premium (above 50%).
- Where should I place the stop-loss? Beyond the swing low (for longs) or swing high (for shorts) that defines the dealing range, with a small buffer.
- Where should I take profit? A common first target is the opposite end of the range (the prior swing). Some traders use Fibonacci extensions beyond it.
- What confluence do ICT traders look for in OTE? A market structure shift, a liquidity sweep, an order block or fair value gap in the zone, and sometimes specific session times.
- Does OTE work? There’s no peer-reviewed evidence specific to OTE, and research on Fibonacci zones in stocks found no special bounce advantage. Test your rules before relying on them.
- What if price goes beyond 79%? Many ICT traders treat a sustained move beyond 79% as weakening or invalidating the setup; the stop beyond the swing limits the loss.
- Can I use OTE on USD/INR? Yes, on NSE or BSE USD/INR futures traded through a SEBI-registered broker.
- Which time frame is best for OTE? It can be used on any time frame. Beginners often find higher time frames give clearer dealing ranges.
- Should I use a limit order in OTE? Many traders do, at 62% or 70.5%. Others wait for confirmation inside the zone. Limit orders may not fill.
- Is OTE the same as the golden pocket? They overlap. The “golden pocket” usually refers to roughly 61.8–65%, while OTE spans 62–79%.
- What is a dealing range? The swing, from a significant low to a high or vice versa, that you apply the Fibonacci tool to.
- How do I test an OTE strategy? Define exact rules for the dealing range, confluence, entry, stop and target, apply them to 50–100 trades, and review results in R after costs.