Introduction
“The trend is your friend” is one of the oldest sayings in trading. It reflects a simple observation: markets often move in sustained directions for weeks or months, driven by interest rates, economic data and investor sentiment. Traders who align with those moves, rather than fight them, can capture large gains while keeping losses small.
A trend following strategy is built on that idea. Instead of predicting tops and bottoms, trend followers wait for a trend to establish itself, join it and stay in until it ends. The approach is used by individual traders and some large systematic funds alike.
This guide explains:
- What trend following is and why it works
- How to identify a trend
- Popular trend following systems
- Entry, exit and stop-loss rules
- Position sizing and risk management
- A worked example and common mistakes
What Is a Trend Following Strategy?
A trend following strategy is a systematic approach that aims to profit from sustained price movements. The trader buys when the market is rising and sells (or goes short) when it is falling, and holds the position until the trend shows signs of ending.
Key features include:
- Reacting, not predicting: Trend followers respond to what price is doing, rather than forecasting what it will do.
- Cutting losses quickly: Small losses are accepted when a trend fails to develop.
- Letting winners run: Profitable trades are held as long as the trend continues.
- Rules-based: Many trend followers use clear, mechanical rules to reduce emotional decisions.
Why a Trend Following Strategy Works in Forex
Currency markets are well suited to trend following because they are often driven by slow-moving fundamental forces:
- Interest rate differences: When one central bank raises rates while another holds or cuts, currency trends can last for months.
- Economic cycles: Growth and inflation trends shape currency demand over long periods.
- Capital flows: Large investors move money gradually, creating sustained buying or selling pressure.
- Investor behaviour: Herding and delayed reactions can extend moves further than fundamentals alone suggest.
That said, currencies also spend long periods in ranges. A trend following strategy will have losing periods during these choppy phases, which is why risk management is essential.

How to Identify a Trend for Your Trend Following Strategy
1. Price structure
The simplest method is to look at swing points:
- Uptrend: Higher highs and higher lows
- Downtrend: Lower highs and lower lows
- Range: No clear pattern of higher or lower swings
2. Moving averages
Moving averages smooth price and make the direction easier to see.
- Price above a rising 50-period or 200-period moving average suggests an uptrend.
- Price below a falling moving average suggests a downtrend.
- A faster moving average above a slower one (for example, 50 above 200) supports a bullish view.
3. ADX
The Average Directional Index (ADX) measures trend strength. Readings above about 25 often indicate a trending market, while readings below 20 suggest a range.
4. Higher-timeframe confirmation
A trend is more reliable when it appears on multiple timeframes. Many traders use the daily chart to set direction and a lower timeframe, such as the 4-hour chart, for entries.
Popular Trend Following Strategy Systems
1. Moving average crossover
This is one of the most widely used trend following strategy approaches.
- Buy signal: A fast moving average (such as the 50 EMA) crosses above a slow moving average (such as the 200 EMA).
- Sell signal: The fast moving average crosses below the slow one.
- Exit: When the opposite crossover occurs, or via a trailing stop.
Crossovers are simple and objective, but they lag and can produce false signals in ranges.
2. Breakout systems (Donchian channels)
A breakout system enters when price breaks the highest high or lowest low of a set period, such as the last 20 or 55 days. This approach was famously associated with the “Turtle Traders” experiment in the 1980s.
- Buy: Price breaks above the 20-day high.
- Sell: Price breaks below the 20-day low.
- Exit: Price breaks the opposite 10-day level.
3. Pullback entries in a trend
Instead of entering on a breakout, traders wait for a trend to pull back to support, such as a moving average or previous breakout level, and then enter in the direction of the trend. This often gives better prices and tighter stops.
4. Price action and market structure
Some traders follow trends using pure price action: buying after a higher low forms in an uptrend, or selling after a lower high in a downtrend, often confirmed by a break of structure.
| System | Entry trigger | Strengths | Weaknesses |
|---|---|---|---|
| MA crossover | Fast MA crosses slow MA | Simple, objective | Lags; whipsaws in ranges |
| Donchian breakout | New N-day high or low | Catches big trends early | Many false breakouts |
| Pullback | Retest of support in trend | Better prices, tighter stops | May miss fast trends |
| Price structure | Higher low or lower high | Flexible, no indicators | More subjective |
Entry Rules: A Simple Trend Following Strategy
Here is a straightforward framework many traders start with:
- Define the trend: On the daily chart, price is above the 200 EMA and the 50 EMA is above the 200 EMA for an uptrend (reverse for a downtrend).
- Check strength: ADX is above 20 or 25.
- Wait for a pullback: On the 4-hour chart, price pulls back to the 50 EMA or a previous support level.
- Enter on confirmation: Buy when a bullish candle (such as an engulfing pattern) forms at support.
- Set the stop: Place it below the pullback low, or 1.5 to 2 times ATR from entry.
Trend Following Strategy Exit Rules and Trailing Stops
Exits are where trend following really earns its returns. The aim is to stay in the trade for as long as the trend lasts.
- Trailing stop behind swing lows: Move the stop below each new higher low in an uptrend.
- ATR trailing stop: Keep the stop a fixed multiple of ATR, such as 3 times ATR, behind the highest price reached.
- Moving average exit: Exit when price closes below a chosen moving average, such as the 50 EMA.
- Opposite signal: Exit when the system gives a signal in the other direction.
Many trend followers avoid fixed profit targets, because the biggest gains come from a small number of trades that run much further than expected. A trend following strategy with tight profit targets often cuts off those big winners.
Position Sizing in a Trend Following Strategy
Trend following typically has a modest win rate, sometimes well below 50%. Profits come from a few large winners that outweigh many small losses. That makes risk control essential.
- Risk a fixed percentage: Many traders risk 0.5–1% of their account per trade.
- Size by volatility: Use ATR to set stop distances, then calculate position size so each trade risks the same amount.
- Limit correlated positions: Being long EUR/USD, GBP/USD and AUD/USD is effectively one large bet against the US dollar.
- Expect drawdowns: Long losing streaks are normal during ranging markets.
Position sizing example
Your account is $10,000 and you risk 1%, or $100. The ATR-based stop is 80 pips on EUR/USD, where one pip on a standard lot is $10. Each standard lot would risk $800, so your position size is $100 ÷ $800 = 0.125 standard lots, or about 1.25 mini lots.

Worked Example of a Trend Following Strategy
Imagine USD/JPY has been rising for several weeks. On the daily chart, price is above the 200 EMA, the 50 EMA is above the 200 EMA, and ADX reads 28.
- On the 4-hour chart, price pulls back to the 50 EMA near 150.20.
- A bullish engulfing candle forms, and the trader buys at 150.40.
- The stop is placed at 149.60, below the pullback low (80 pips of risk).
- Instead of a fixed target, the trader trails the stop below each new higher low on the 4-hour chart.
- Over the next three weeks, the trend continues to 153.80. The trailing stop is finally hit at 153.00.
The trade gains 260 pips against 80 pips of risk, a reward of more than 3 times the risk.
This example is illustrative and uses hypothetical prices.
Best Timeframes and Pairs for a Trend Following Strategy
- Timeframes: Trend following generally works best on 4-hour, daily and weekly charts, where trends are clearer and less affected by noise.
- Pairs: Liquid major pairs such as EUR/USD, GBP/USD, USD/JPY and AUD/USD are popular. Pairs strongly influenced by interest rate differences often trend well.
- Diversification: Some trend followers trade a basket of currencies, commodities and indices to increase the chance of catching a strong trend somewhere.
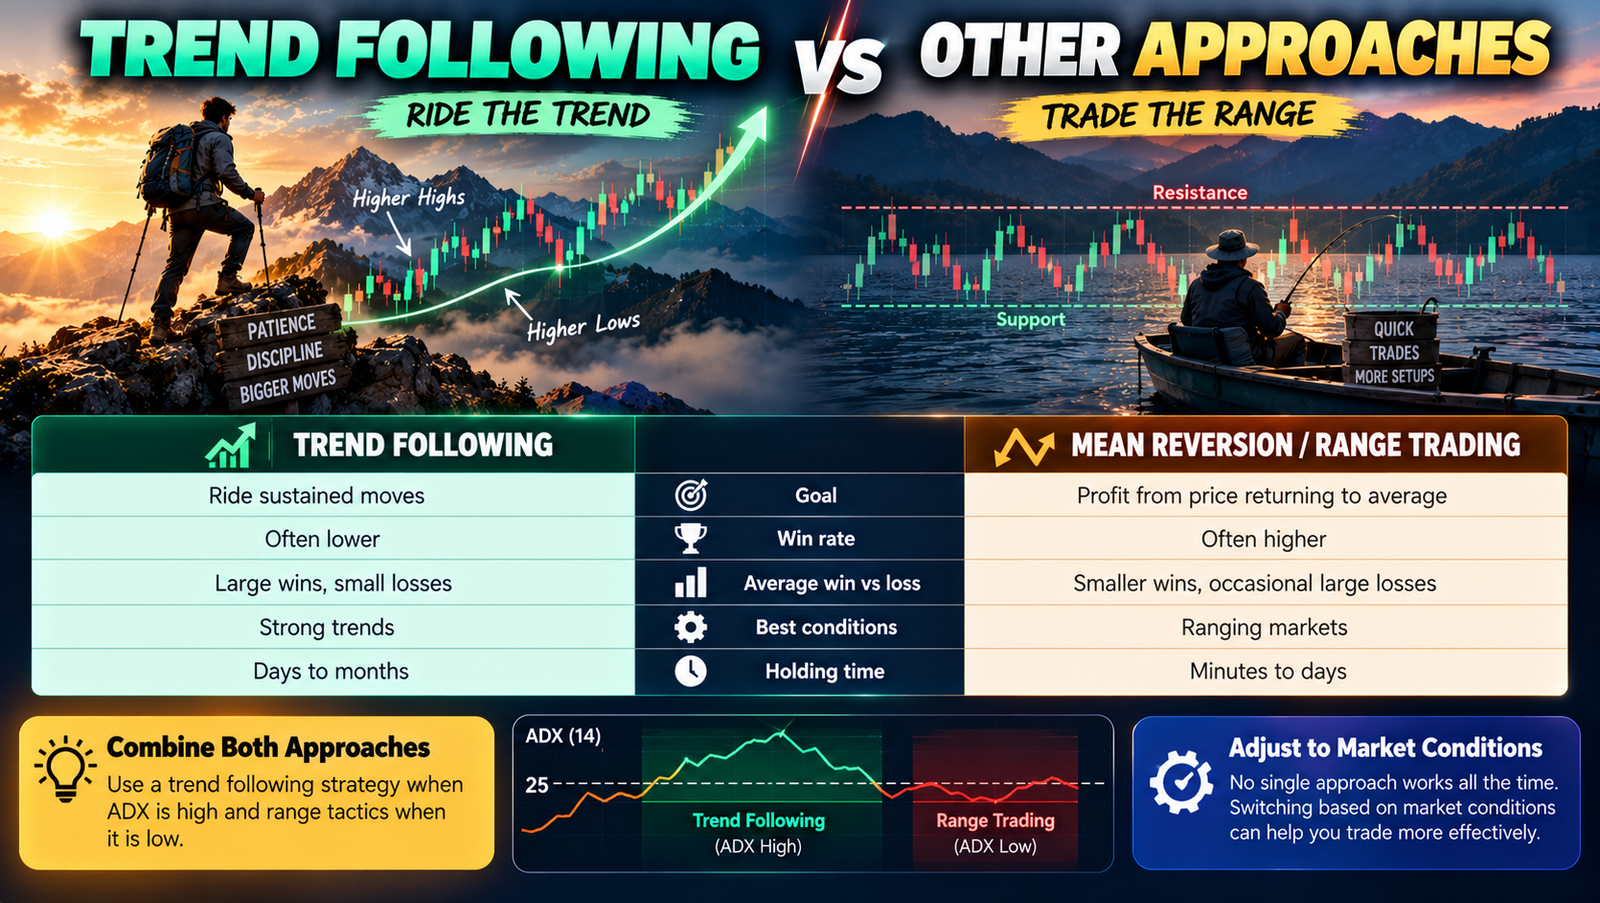
Trend Following vs Other Approaches
| Feature | Trend following | Mean reversion / range trading |
|---|---|---|
| Goal | Ride sustained moves | Profit from price returning to average |
| Win rate | Often lower | Often higher |
| Average win vs loss | Large wins, small losses | Smaller wins, occasional large losses |
| Best conditions | Strong trends | Ranging markets |
| Holding time | Days to months | Minutes to days |
Many traders combine both, using a trend following strategy when ADX is high and range tactics when it is low.
Common Trend Following Strategy Mistakes
- Taking profits too early: Cutting winners short removes the big gains that make trend following work.
- Trading in ranges: Ignoring filters such as ADX leads to repeated whipsaws.
- Moving stops away: Widening a stop to avoid a loss breaks the system’s logic.
- Over-optimising: Constantly changing settings to fit past data rarely works in the future.
- Giving up during drawdowns: Losing streaks are normal; abandoning the system often happens just before a big trend.
- Overexposure: Holding many correlated positions increases risk sharply.
The Psychology of a Trend Following Strategy
Trend following is simple in theory but difficult in practice. It requires accepting many small losses, sitting through pullbacks in winning trades and resisting the urge to take quick profits. Keeping a trading journal, following written rules and reviewing results weekly can help traders stay disciplined through difficult periods. It also helps to judge performance over a large number of trades, perhaps 50 or more, rather than reacting to every losing week. Small, consistent position sizes make it far easier to follow the rules when results are temporarily poor.
A Trend Following Strategy for Indian Traders
The same principles apply to NSE currency futures such as USD/INR, as well as Nifty futures and MCX commodities. USD/INR often trends slowly with occasional sharp moves, and RBI intervention can interrupt trends, so higher timeframes and wider ATR-based stops are usually more suitable.
Indian residents should trade currencies only through recognised exchanges such as NSE and BSE, via SEBI-registered brokers. Leveraged forex trading through offshore CFD platforms is not permitted under FEMA.
FAQs
What is a trend following strategy?
It is an approach that aims to profit from sustained price movements by entering in the direction of an established trend and staying in until the trend shows signs of ending.
Which indicator is best for trend following?
Moving averages, ADX and Donchian channels are popular. Many traders combine a moving average for direction with ADX for strength.
What win rate should I expect?
Trend following often has a win rate below 50%, but profits come from large winners that outweigh smaller losses.
What is the best timeframe?
4-hour, daily and weekly charts generally work best, as trends are clearer on higher timeframes.
Should I use profit targets?
Many trend followers prefer trailing stops instead of fixed targets, to let winning trades run.
Conclusion
A trend following strategy offers a clear, rules-based way to trade forex: identify the trend, enter in its direction, cut losses quickly and let winners run. It does not require predicting tops and bottoms, but it does require patience and discipline, especially during ranging periods.
Start with a simple system, such as moving averages with an ADX filter and pullback entries, size positions carefully and use trailing stops to capture big moves. Test your approach on historical data and a demo account, and keep a journal to track your progress.