Introduction
One of the hardest questions in trading is not “which way is the market going?” but “is the market trending at all?” Many strategies work well in strong trends and fail badly in sideways markets. Others do the opposite. Knowing which kind of market you are in can make the difference between profit and frustration.
The ADX indicator was designed to answer exactly that question. Short for Average Directional Index, it measures the strength of a trend, regardless of its direction. Used well, it helps traders decide when to follow trends, when to trade ranges and when to stay out.
This guide covers:
- What the ADX indicator is and who created it
- The three lines: ADX, +DI and -DI
- How it is calculated, in simple terms
- How to read ADX values
- Practical ADX strategies with examples
- Settings, limitations and common mistakes
What Is the ADX Indicator?
The ADX indicator is a technical tool that measures trend strength on a scale from 0 to 100. It was developed by J. Welles Wilder and introduced in his 1978 book New Concepts in Technical Trading Systems, the same book that introduced the RSI, Parabolic SAR and Average True Range (ATR).
The key point to understand is that ADX does not show direction. A rising ADX means the trend is getting stronger, whether price is going up or down. A falling ADX means the trend is weakening or the market is moving into a range.
ADX is part of a wider system called the Directional Movement Index (DMI), which includes two other lines that do show direction.
The Three Lines of the ADX Indicator
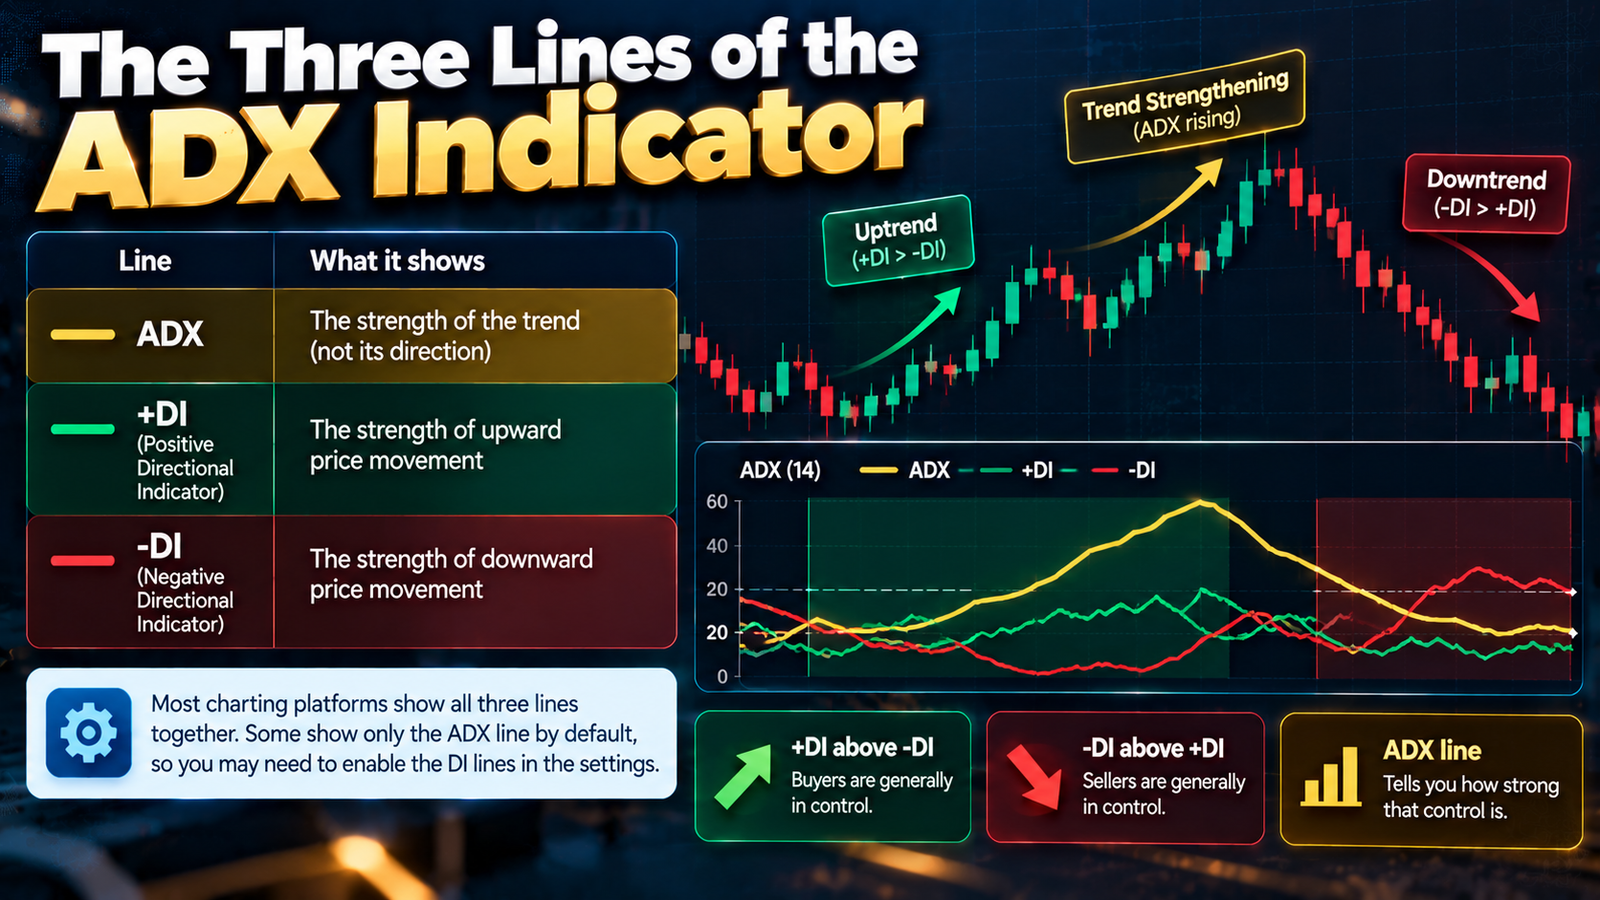
| Line | What it shows |
|---|---|
| ADX | The strength of the trend (not its direction) |
| +DI (Positive Directional Indicator) | The strength of upward price movement |
| -DI (Negative Directional Indicator) | The strength of downward price movement |
- When +DI is above -DI, buyers are generally in control.
- When -DI is above +DI, sellers are generally in control.
- The ADX line tells you how strong that control is.
Most charting platforms show all three lines together. Some show only the ADX line by default, so you may need to enable the DI lines in the settings.
How the ADX Indicator Is Calculated
You do not need to calculate ADX by hand, because every major platform does it automatically. But understanding the steps helps you interpret it correctly.
- Directional movement: For each candle, compare today’s high with yesterday’s high (upward movement) and today’s low with yesterday’s low (downward movement). Only the larger of the two counts, and only if it is positive.
- True Range: Calculate the True Range, the largest of: high minus low, high minus previous close, or previous close minus low.
- Smoothing: Smooth the directional movements and True Range over a period, usually 14, using Wilder’s smoothing method.
- +DI and -DI: Divide smoothed upward and downward movement by the smoothed True Range, then multiply by 100.
- DX: Calculate the Directional Index: the absolute difference between +DI and -DI, divided by their sum, multiplied by 100.
- ADX: Smooth the DX values over the same period to get the ADX line.
Because ADX is a smoothed average of an already smoothed value, it reacts slowly. That makes it good at filtering noise, but it also means it lags behind price.
How to Read ADX Values
Traders commonly use these broad guidelines:
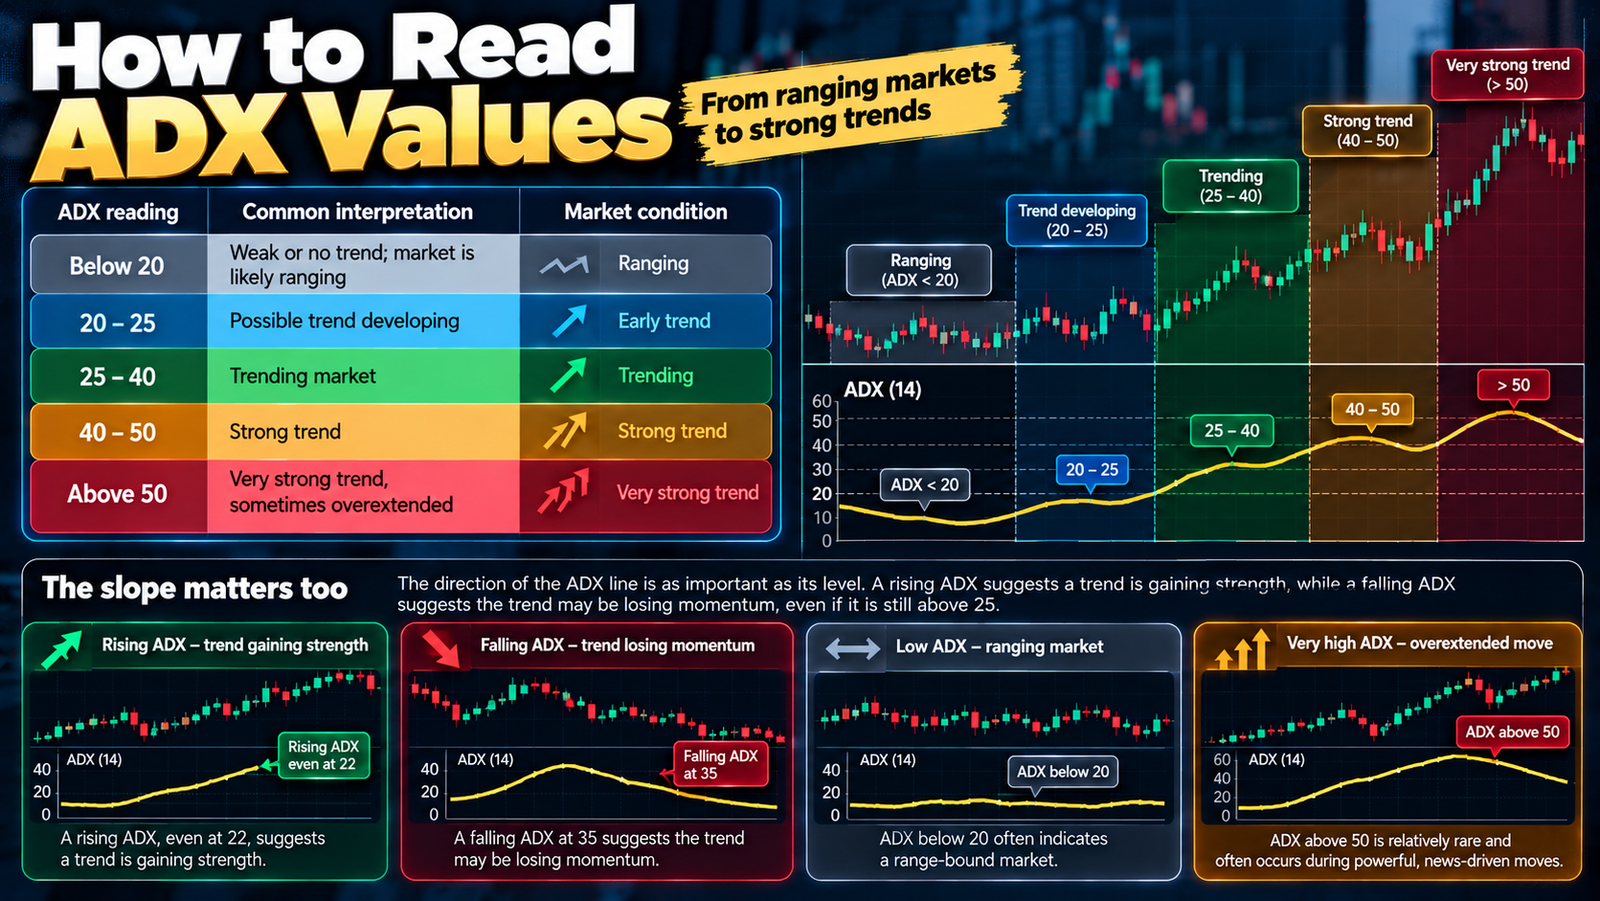
| ADX reading | Common interpretation |
|---|---|
| Below 20 | Weak or no trend; market is likely ranging |
| 20 – 25 | Possible trend developing |
| 25 – 40 | Trending market |
| 40 – 50 | Strong trend |
| Above 50 | Very strong trend, sometimes overextended |
These levels are guidelines, not fixed rules. Some traders use 20 as the trend threshold, others 25. Readings above 50 are relatively rare and often occur during powerful, news-driven moves.
The slope matters too
The direction of the ADX line is as important as its level. A rising ADX indicator reading, even at 22, suggests a trend is gaining strength. A falling ADX at 35 suggests the trend may be losing momentum, even though it is still above 25.
Why Traders Use the ADX Indicator
- Choosing the right strategy: Trend-following methods suit high ADX readings; range trading suits low readings.
- Filtering signals: Many traders only take trend trades when ADX is above a certain level.
- Spotting trend exhaustion: A turning-down ADX after a very high reading can warn that a trend is maturing.
- Identifying breakouts: A rising ADX from low levels can confirm that a range is breaking into a new trend.
ADX Indicator Strategies
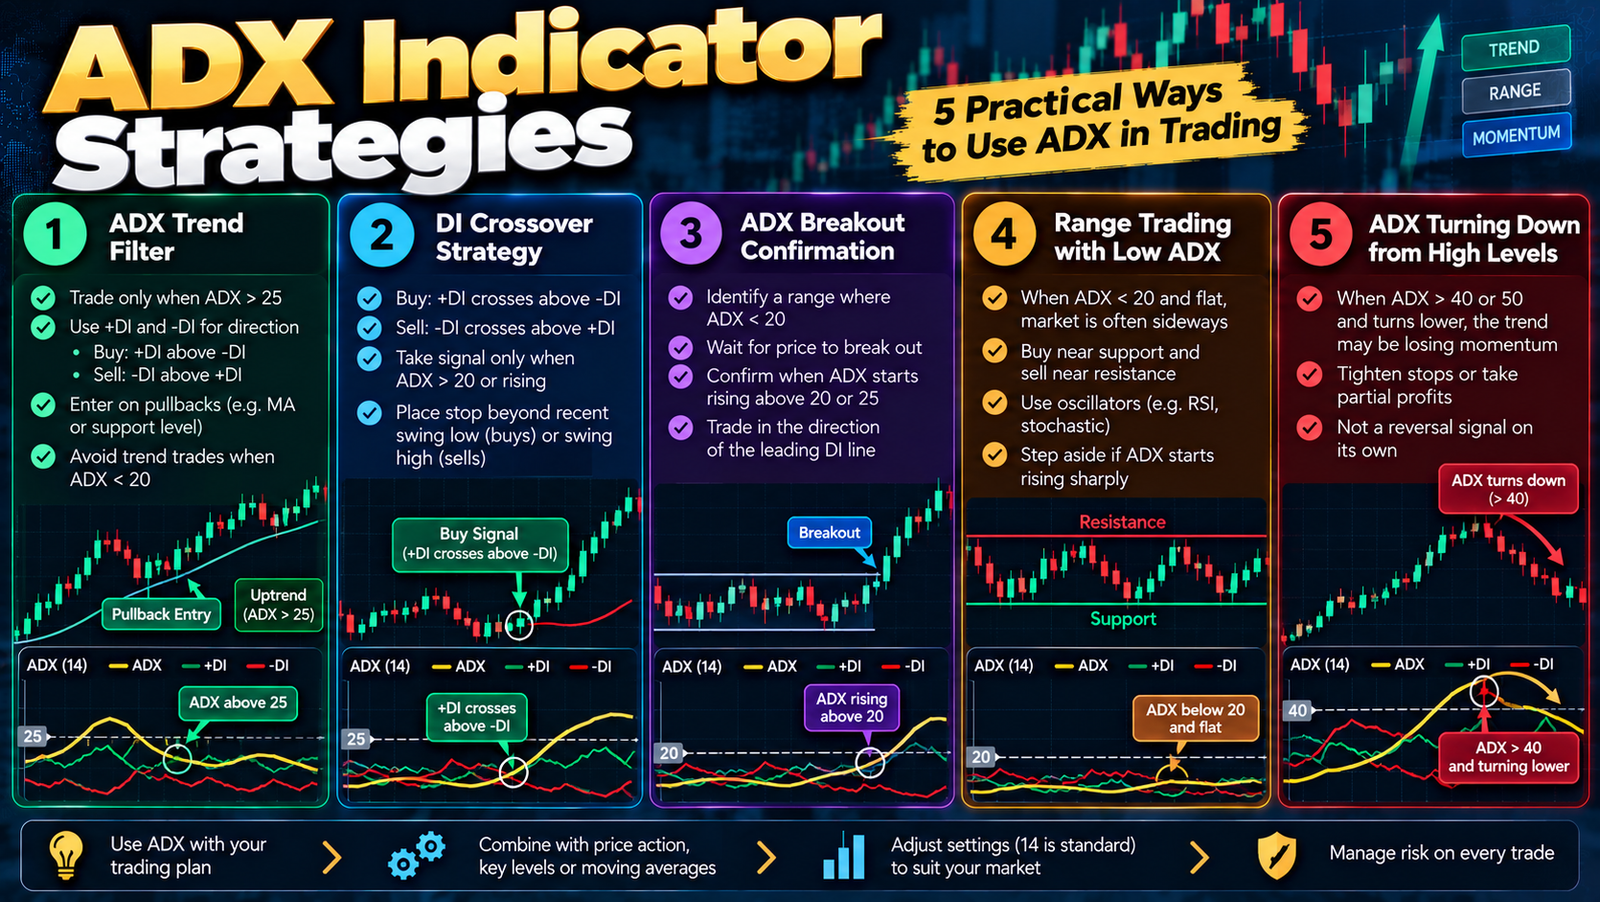
1. ADX trend filter
This is the simplest and most popular use of the ADX indicator.
- Only look for trend trades when ADX is above 25.
- Use +DI and -DI to choose direction: buy when +DI is above -DI, sell when -DI is above +DI.
- Enter on pullbacks using your usual method, such as a moving average or support level.
- Avoid trend trades when ADX is below 20.
This keeps you out of choppy markets where trend strategies often fail.
2. DI crossover strategy
- A buy signal occurs when +DI crosses above -DI.
- A sell signal occurs when -DI crosses above +DI.
- Only take the signal if ADX is above 20 or 25, or rising.
- Place the stop beyond the recent swing low (for buys) or swing high (for sells).
Wilder also suggested an “extreme point” rule: after a crossover, use the high or low of the crossover candle as a trigger level and stop reference.
3. ADX breakout confirmation
- Identify a range where ADX has stayed below 20.
- Wait for price to break out of the range.
- Confirm the breakout when ADX starts rising above 20 or 25.
- Trade in the direction shown by the leading DI line.
This combination helps filter false breakouts, because genuine breakouts are usually followed by a rising ADX.
4. Range trading with low ADX
When ADX is below 20 and flat, the market is often moving sideways. Range traders buy near support and sell near resistance, often using oscillators such as the RSI or stochastic. If ADX begins to rise sharply, they step aside, because a breakout may be starting.
5. ADX turning down from high levels
When ADX climbs above 40 or 50 and then turns lower, the trend may be losing momentum. Trend traders may tighten stops or take partial profits. This is not a reversal signal on its own; price can continue in the same direction with less strength, or move into a range.
Worked Example
Imagine GBP/USD has been ranging on the 4-hour chart, with ADX around 16. Price breaks above resistance at 1.3300 with a strong candle.
- Over the next few candles, ADX rises from 16 to 24.
- +DI crosses above -DI and stays clearly above it.
- Price pulls back to 1.3310, just above the old resistance.
A trader buys at 1.3315, with a stop at 1.3270, below the breakout level. The target is 1.3405, giving a risk of 45 pips and a potential reward of 90 pips, a 1:2 ratio. As the trend develops, ADX climbs above 30, supporting the decision to hold the trade.
This example is illustrative and uses hypothetical prices.
Best Settings for the ADX Indicator
- 14 periods: Wilder’s original setting and the default on most platforms. A good starting point for most traders.
- Shorter periods (7–10): More responsive, but produce more noise and false signals. Popular with some intraday traders.
- Longer periods (20–30): Smoother and slower, suited to swing and position traders.
Whatever setting you choose, test it on historical data for the market and timeframe you trade. Keep the trend threshold consistent with your period: shorter settings tend to produce higher, jumpier readings, so a level of 25 on a 7-period ADX does not mean the same as 25 on a 14-period ADX. Record your settings in your trading plan so your results stay comparable over time.
Combining ADX With Other Tools
- Moving averages: Use a 50 or 200 EMA for trend direction, and the ADX indicator for strength.
- RSI or stochastic: Use oscillators for timing entries in ranges or on pullbacks.
- ATR: Set stops based on current volatility.
- Support and resistance: Combine ADX signals with key levels for better entries.
- Price action: Use candlestick patterns to confirm entries.
ADX vs Other Trend Tools
| Tool | What it tells you | Shows direction? |
|---|---|---|
| ADX | Trend strength | No (DI lines do) |
| Moving averages | Trend direction and dynamic support or resistance | Yes |
| MACD | Momentum and trend changes | Yes |
| RSI | Momentum and overbought or oversold conditions | Partly |
| Ichimoku Cloud | Trend direction, momentum and support or resistance | Yes |
The main advantage of the ADX indicator is that it focuses on one job: telling you whether a trend is worth trading. Most other tools mix direction and momentum together. That is why many traders pair ADX with a directional tool rather than replacing one with the other. For example, a moving average tells you the trend is up, and ADX tells you whether that uptrend has enough strength to trade.
Limitations of the ADX Indicator
- It lags: Because of double smoothing, ADX often confirms a trend after it has already started.
- No direction on its own: You need the DI lines or price action to know which way to trade.
- Whipsaws: DI crossovers can produce many false signals in choppy markets.
- Not a reversal tool: A falling ADX does not necessarily mean price will reverse.
- Market differences: Typical ADX readings vary between markets and timeframes.
Common ADX Indicator Mistakes
- Treating a high ADX as a buy signal, even in a downtrend
- Ignoring the slope of the ADX line
- Trading every DI crossover without an ADX filter
- Assuming a falling ADX means price will reverse
- Using ADX alone, without price action or key levels
- Changing settings constantly instead of testing one approach
Using the ADX Indicator in Indian Markets
The ADX indicator works on any liquid market, including NSE currency futures such as USD/INR, Nifty and Bank Nifty futures, and MCX commodities. USD/INR often spends long periods in narrow ranges, partly because of RBI activity, so low ADX readings are common. A rising ADX from low levels can be a useful sign that a larger move is beginning.
Indian residents should trade currencies only through recognised exchanges such as NSE and BSE, via SEBI-registered brokers. Leveraged forex trading through offshore CFD platforms is not permitted under FEMA.
FAQs
What does the ADX indicator measure?
It measures the strength of a trend on a scale of 0 to 100, regardless of whether price is rising or falling.
What is a good ADX value?
Many traders treat readings above 25 as a trending market and below 20 as a weak or ranging market.
Does ADX show trend direction?
No. Use the +DI and -DI lines, or price action, to judge direction.
What is the best ADX setting?
The default 14-period setting works well for most traders. Shorter settings are more responsive; longer settings are smoother.
Can I use ADX for day trading?
Yes. Many day traders use ADX on 15-minute or 1-hour charts as a trend filter, often combined with a higher-timeframe view.
Is ADX the same as DMI?
ADX is one part of the Directional Movement Index system, which also includes +DI and -DI.
Conclusion
The ADX indicator is one of the most useful tools for answering a key trading question: is this market trending, and how strongly? By reading the ADX line alongside +DI and -DI, you can choose the right strategy for current conditions, filter out weak signals and avoid trading trend setups in sideways markets.
Remember that ADX lags and does not show direction on its own. Combine it with price action, key levels and sound risk management. Test your approach on a demo account, and the ADX indicator can become a reliable part of your trading toolkit.