Introduction
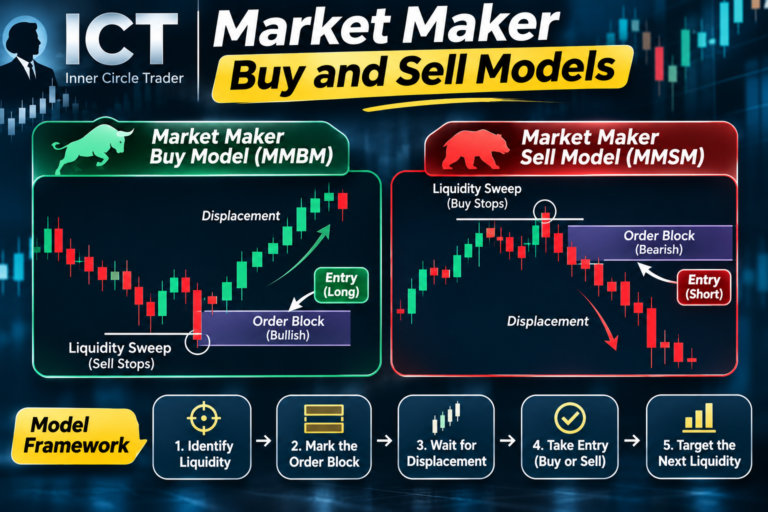
Smart Money Concepts (SMC) traders spend a lot of time looking for clues about what large players are doing. One of the most useful clues comes not from a single chart but from comparing two related markets. When markets that normally move together suddenly disagree at a key turning point, it can be an early warning that a reversal is coming.
That disagreement is called SMT divergence. The term was popularised by ICT (The Inner Circle Trader), where SMT stands for “Smart Money Technique” or “Smart Money Tool”. It is now a core part of many SMC trading plans.
This guide explains:
- What SMT divergence is and why it works
- Bullish and bearish SMT, with simple examples
- Which correlated pairs to use, including inverse pairs such as DXY
- How to combine SMT with liquidity sweeps, market structure and kill zones
- A step-by-step entry model and common mistakes
- How Indian traders can apply it legally
What Is SMT Divergence?
SMT divergence is a non-confirmation between two correlated instruments at matching swing points. In simple terms, one market makes a new high or low, but its correlated partner does not.
For example, EUR/USD and GBP/USD usually move in the same direction because both are priced against the US dollar. If EUR/USD makes a lower low but GBP/USD makes a higher low at the same time, the two pairs are “diverging”. That crack in correlation suggests the move lower may not be genuine, and that buyers could be stepping in.
It is important not to confuse this with indicator divergence. RSI or MACD divergence compares price with an oscillator on one chart. SMT divergence compares price with price, across two related markets.
Why SMT Divergence Works
The logic behind SMT comes from liquidity. Above old highs and below old lows sit clusters of stop-loss orders and breakout orders. Large participants need that liquidity to fill big positions.
When one market sweeps a key low, triggering stops, while its correlated partner refuses to make a new low, it hints that the sweep was a liquidity grab rather than real selling pressure. In other words, the weakness was not confirmed across the wider market. Smart money may have used the stop run in one pair to accumulate positions.
That is why many traders see SMT as an “institutional footprint”. It does not tell you everything, but it can show you where a move lacks support.
Bullish and Bearish SMT Divergence
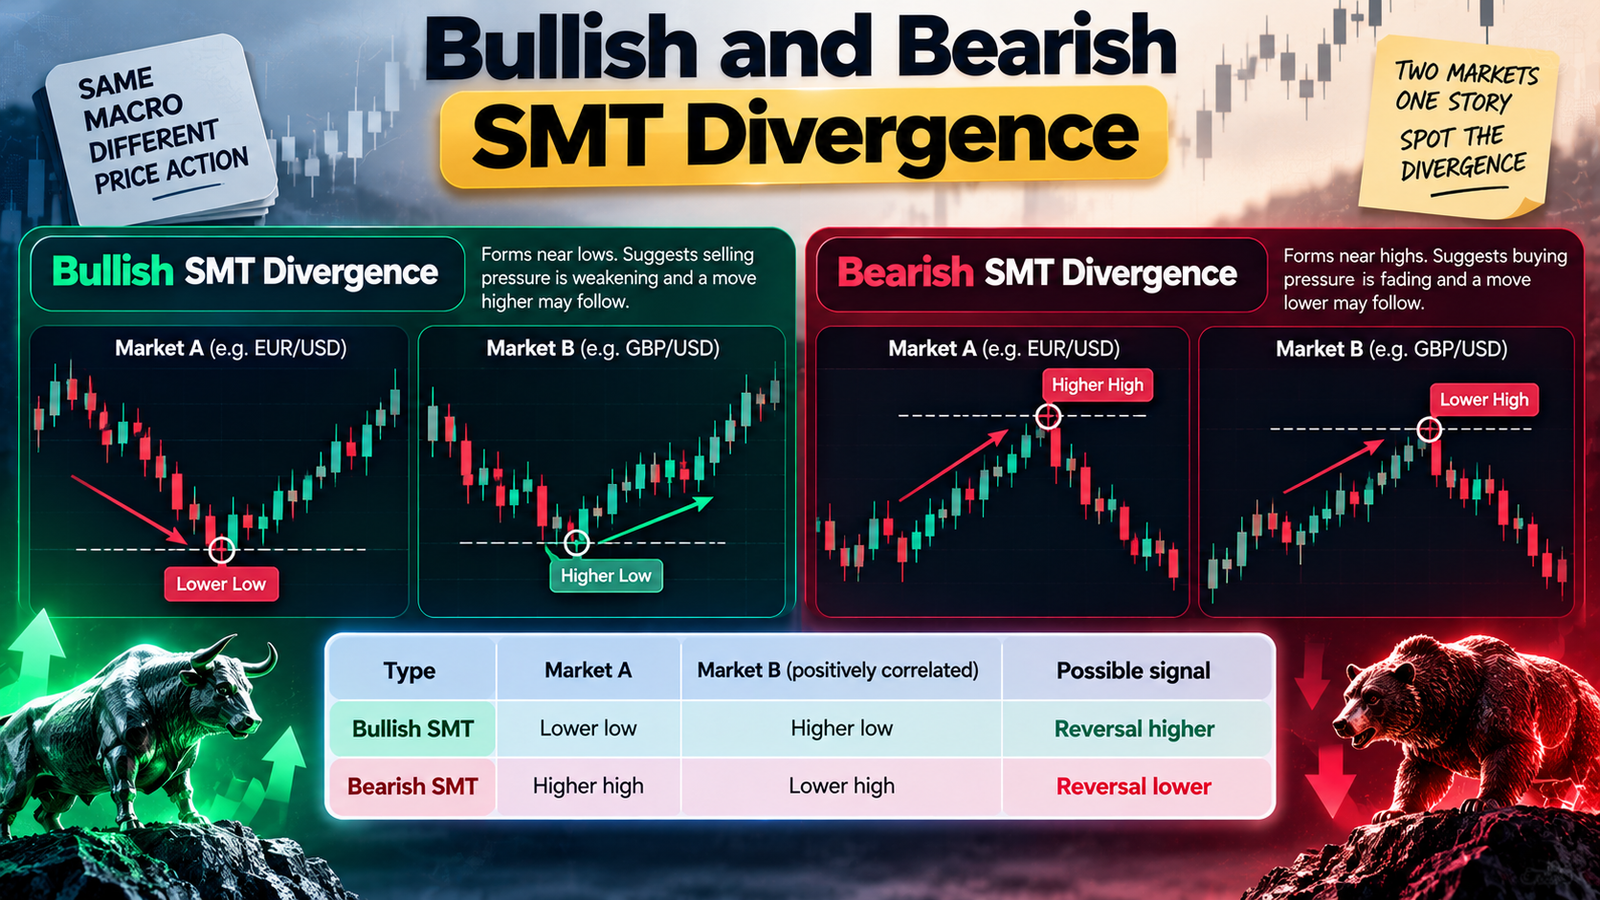
Bullish SMT divergence
A bullish SMT forms near lows:
- Market A makes a lower low, sweeping its previous low.
- Market B makes a higher low, failing to break its previous low.
This suggests selling pressure is weakening and a move higher may follow.
Bearish SMT divergence
A bearish SMT forms near highs:
- Market A makes a higher high, sweeping its previous high.
- Market B makes a lower high, failing to break its previous high.
This suggests buying pressure is fading and a move lower may follow.
| Type | Market A | Market B (positively correlated) | Possible signal |
|---|---|---|---|
| Bullish SMT | Lower low | Higher low | Reversal higher |
| Bearish SMT | Higher high | Lower high | Reversal lower |
Best Correlated Pairs for SMT Divergence
SMT only works when the two markets are genuinely correlated at the time you are trading. Common combinations include:
Positively correlated pairs
- EUR/USD and GBP/USD: The most popular forex combination, because both are major pairs against the dollar.
- AUD/USD and NZD/USD: Closely linked commodity currencies.
- Gold (XAU/USD) and silver (XAG/USD): Precious metals that often move together.
- ES and NQ: S&P 500 and Nasdaq 100 futures, widely used by index traders.
Inversely correlated pairs
- EUR/USD and DXY: The US Dollar Index usually moves opposite to EUR/USD.
- GBP/USD and DXY: Similar inverse relationship.
With inverse pairs, the logic flips. For a bearish SMT on EUR/USD, you would look for EUR/USD making a higher high while DXY makes a higher low (rather than the lower low you would expect). For a bullish SMT, EUR/USD makes a lower low while DXY makes a lower high.
| Type | EUR/USD | DXY (inverse) |
|---|---|---|
| Bullish SMT | Lower low | Lower high |
| Bearish SMT | Higher high | Higher low |
Check the correlation first
Correlations change. Events such as a Bank of England surprise can temporarily decouple GBP/USD from EUR/USD. If the pairs have drifted apart for fundamental reasons, an apparent divergence may simply reflect that news rather than smart money activity. Many traders check recent correlation, or simply confirm visually that the two charts have been moving together, before using SMT.
Where SMT Divergence Matters Most
Not every divergence is worth trading. SMT carries more weight when it appears:
- At key liquidity levels: Previous day high or low, Asian session high or low, weekly highs and lows, or equal highs and lows.
- At higher-timeframe points of interest: Order blocks, fair value gaps or major support and resistance zones.
- During kill zones: The most active trading windows, when large orders are filled.
- In line with higher-timeframe bias: A bullish SMT in a higher-timeframe uptrend is generally stronger than one against the trend.
Kill zones in IST
For traders in India, the main kill zones fall in the afternoon and evening. With the UK on winter time from 25 October 2026 and the US moving to winter time on 1 November 2026, approximate times are:
| Kill zone | Approximate IST (winter) |
|---|---|
| London open | About 12:30 pm – 3:30 pm |
| New York open | About 5:30 pm – 8:30 pm |
Kill zone definitions vary between traders. During UK and US summer time, these windows move about one hour earlier. Between 25 October and 1 November 2026, the New York window starts about an hour earlier than shown.
Step-by-Step SMT Divergence Entry Model
Most traders use SMT as a confirmation tool, not as a standalone entry trigger. A typical sequence looks like this:
- Set the bias: Use the daily or 4-hour chart to decide whether you favour longs or shorts.
- Mark liquidity: Identify key highs and lows on both correlated charts, such as the previous day’s high and low.
- Wait for the sweep: Watch for one market to take out a key level during a kill zone.
- Check for SMT: Confirm that the correlated market failed to take out its matching level.
- Wait for a market structure shift: On a lower timeframe, such as the 5-minute or 15-minute chart, look for a break of the most recent swing in the new direction, ideally with strong displacement.
- Enter on a pullback: Enter on a retracement into a fair value gap or order block created by the displacement.
- Place the stop: Put your stop beyond the swept high or low.
- Set targets: Aim for opposing liquidity, such as the other side of the range or the previous session’s high or low.
The key point is that the divergence tells you the move may be weak, while the market structure shift tells you price has actually started to turn.

Worked Example: Bullish SMT on EUR/USD and GBP/USD
Imagine the higher-timeframe bias is bullish. During the Asian session, EUR/USD forms a low at 1.1600 and GBP/USD forms a low at 1.3300.
At the London open, EUR/USD drops to 1.1590, sweeping the Asian low. At the same time, GBP/USD only falls to 1.3310, holding above its Asian low. That is a bullish SMT.
A few minutes later, EUR/USD rallies strongly and breaks above a recent 5-minute swing high at 1.1612, leaving a fair value gap between 1.1603 and 1.1607. A trader buys at 1.1605 as price pulls back into the gap, with a stop at 1.1585, below the sweep low. The target is the Asian session high at 1.1645.
The trade risks 20 pips to make 40, a 1:2 risk-reward ratio.
Notice what made this SMT divergence worth trading: it formed at a clear liquidity level (the Asian low), during the London kill zone, in line with the bullish bias, and it was followed by a market structure shift. An SMT divergence without those ingredients would deserve far less confidence.
This example is illustrative and uses hypothetical prices.
Choosing Timeframes
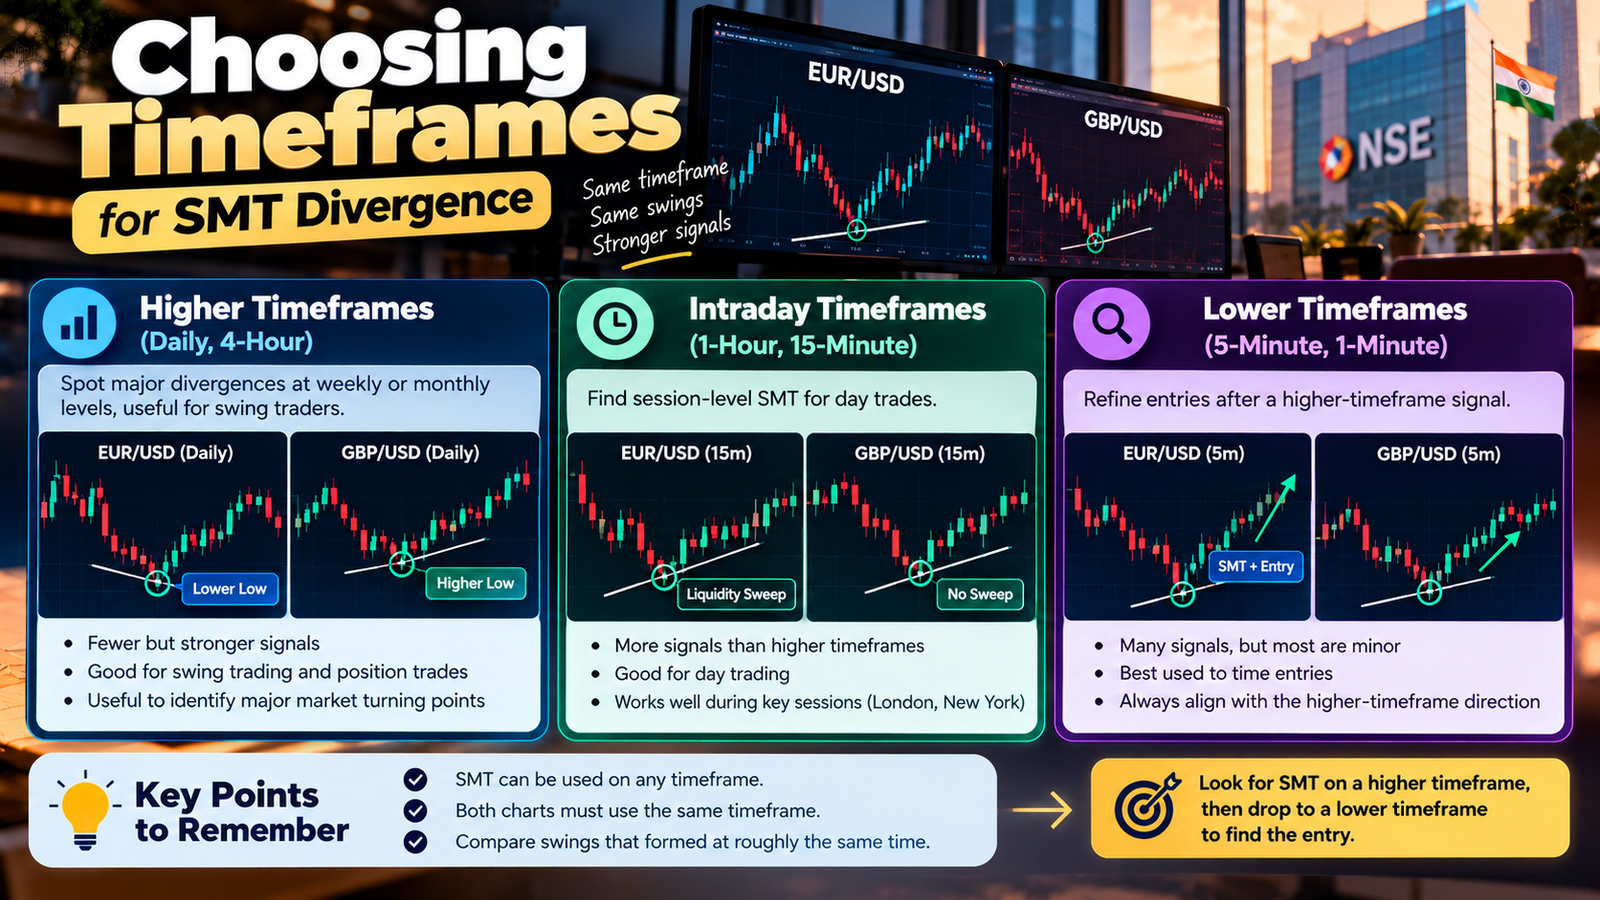
Timeframe choice affects how often you see signals and how reliable they are. Lower timeframes produce many signals, but most are minor. Higher timeframes produce fewer signals, but each one usually matters more.
SMT can be used on any timeframe, but both charts must use the same timeframe and you must compare swings that formed at roughly the same time.
- Higher timeframes (daily, 4-hour): Spot major divergences at weekly or monthly levels, useful for swing traders.
- Intraday timeframes (1-hour, 15-minute): Find session-level SMT for day trades.
- Lower timeframes (5-minute, 1-minute): Refine entries after a higher-timeframe signal.
A good habit is to look for SMT on a higher timeframe and then drop to a lower timeframe to look for the entry.
Common SMT Divergence Mistakes
- Trading every divergence: Small, mid-range divergences are often noise. Focus on key levels.
- Ignoring correlation breakdowns: Pair-specific news can decouple markets.
- Comparing mismatched swings: The two highs or lows must form at about the same time.
- Getting inverse pairs backwards: Remember that the logic flips with DXY.
- Entering without confirmation: Wait for a market structure shift before entering.
- Using different timeframes on each chart: Always compare like with like.
- Ignoring the higher-timeframe bias: Counter-trend SMT setups fail more often.
Tools and Indicators
Many charting platforms offer free or paid scripts that automatically mark SMT divergence between two symbols. These can save time, but they are not perfect. They may mark divergences at unimportant levels or miss context such as kill zones and higher-timeframe bias. Use them as a helper, and always confirm signals with your own analysis.
A simple manual method works well too: open the two correlated charts side by side, use the same timeframe, and draw lines at key highs and lows on both.
How Indian Traders Can Apply SMT Divergence
Indian residents should note that leveraged forex trading through offshore CFD platforms is not permitted under FEMA, and the RBI maintains an Alert List of unauthorised forex platforms.
There is, however, a legal way to apply SMT ideas:
- Cross-currency futures on NSE: NSE offers EUR/USD and GBP/USD futures and options, which are cash-settled in rupees. Traders can compare these two contracts for SMT, though liquidity is lower than in global spot markets.
- Use global charts for analysis: Many traders study spot EUR/USD, GBP/USD and DXY charts for analysis, and then trade the exchange-listed contracts through a SEBI-registered broker.
Check contract specifications and trading hours with your broker before trading.
FAQs
What does SMT stand for?
SMT is commonly expanded as “Smart Money Technique” or “Smart Money Tool”, terms associated with ICT.
What is the best pair for SMT divergence?
EUR/USD and GBP/USD are the most widely used forex pair. Index traders often use ES and NQ, and metals traders use gold and silver.
Can SMT divergence be used alone?
It is best used as confirmation alongside liquidity sweeps, market structure shifts and higher-timeframe bias.
How is SMT different from RSI divergence?
RSI divergence compares price with an indicator on one chart. SMT compares price action across two correlated markets.
Which timeframe is best?
Intraday traders often look for SMT on the 15-minute or 1-hour chart and refine entries on the 5-minute chart. Swing traders use daily and 4-hour charts.
Conclusion
SMT divergence is a simple but powerful idea: when correlated markets disagree at key highs or lows, the move may not be genuine. Used at important liquidity levels, during active kill zones and in line with the higher-timeframe bias, it can help you spot liquidity sweeps and potential reversals before they become obvious.
Treat it as a confirmation tool rather than a standalone signal. Combine it with a market structure shift, a clear entry point and sound risk management. Practise marking SMT on historical charts and a demo account before you trade it with real money.