Introduction
The Relative Strength Index, or RSI, is the line that sits below the price chart and moves between 0 and 100. It’s one of the most popular indicators in forex, and one of the most misused. Many beginners see “RSI above 70” and sell, only to watch price keep climbing. Learning to use the RSI indicator in forex properly means understanding what it measures, and when its signals are likely to mislead.
Quick answer: RSI measures the speed and size of recent price gains versus losses over a set period (usually 14), on a 0–100 scale. Readings above 70 are traditionally called “overbought” and below 30 “oversold”, but in strong trends RSI can stay at those extremes for a long time. RSI is most useful for spotting momentum shifts: fading momentum at range edges, divergences between price and RSI, and whether RSI holds above or below 50 in a trend. Use it with price structure and a stop-loss, not as an automatic buy or sell signal.
Why this matters
- RSI comes with almost every charting platform, so beginners use it early, often with default settings and no plan.
- Research on currencies is mixed. One study found the textbook 30/70 rule lost money on USD/CHF, while another found RSI-based rules held up better than moving-average rules in recent years.
- Indian traders can apply RSI to permitted pairs such as USD/INR futures on NSE or BSE, traded through a SEBI-registered broker.
What is RSI?
RSI was introduced by J. Welles Wilder in his 1978 book New Concepts in Technical Trading Systems. It’s a momentum oscillator: it compares the size of recent up-moves with recent down-moves.
The formula
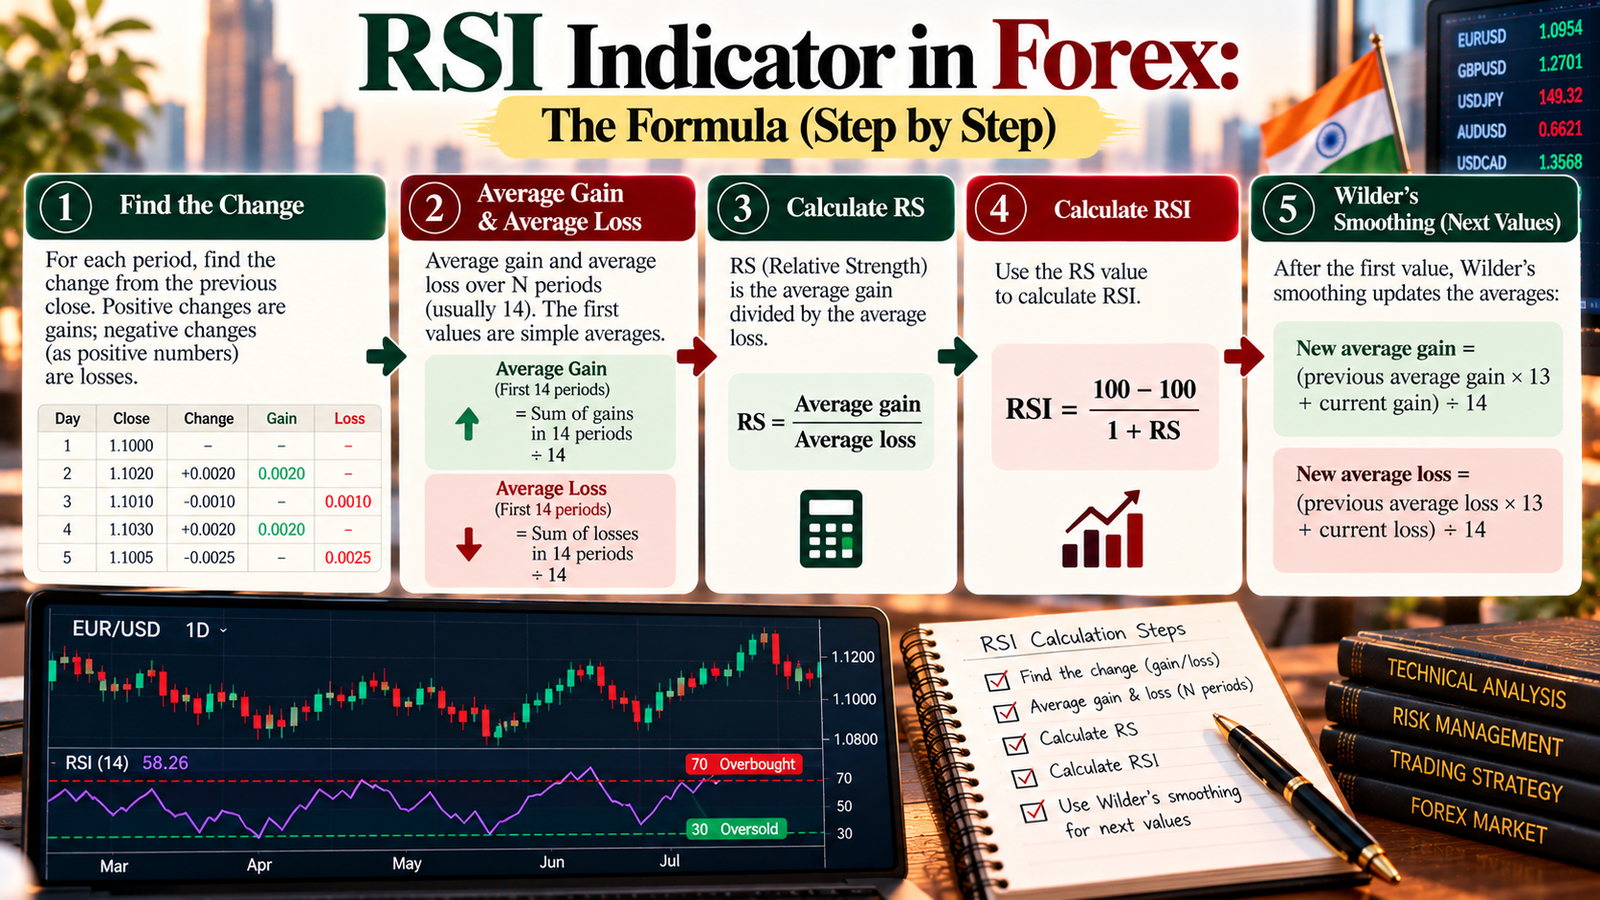
- For each period, find the change from the previous close. Positive changes are gains; negative changes (as positive numbers) are losses.
- Average gain and average loss over N periods (usually 14). The first values are simple averages.
- RS = Average gain ÷ Average loss
- RSI = 100 − 100 ÷ (1 + RS)
- After the first value, Wilder’s smoothing updates the averages: new average gain = (previous average gain × 13 + current gain) ÷ 14, and the same for losses.
Worked calculation: 14-period RSI (illustrative USD/INR closes)
Fifteen closes from 95.00 to 95.90 give 14 price changes. Ten are gains (total ₹1.15) and four are losses (total ₹0.25).
| Step | Calculation | Result |
|---|---|---|
| Average gain | 1.15 ÷ 14 | 0.0821 |
| Average loss | 0.25 ÷ 14 | 0.0179 |
| RS | 0.0821 ÷ 0.0179 | 4.60 |
| RSI | 100 − 100 ÷ (1 + 4.60) | 82.1 |
| Next close falls 15 paise (95.90 → 95.75) | New avg gain = (0.0821 × 13 + 0) ÷ 14 = 0.0763; new avg loss = (0.0179 × 13 + 0.15) ÷ 14 = 0.0273 | RSI ≈ 73.6 |
Calculated in code; prices are illustrative.
One 15-paise drop pulled RSI down about 8.5 points, showing how RSI reacts to changes in momentum, not just price level.
How to read RSI
| RSI reading | Traditional interpretation | Practical caution |
|---|---|---|
| Above 70 | “Overbought”: strong recent gains | In an uptrend, RSI can stay above 70 while price keeps rising |
| 50–70 | Bullish momentum | Pullbacks often hold above 40–50 in uptrends |
| 50 | Neutral; gains and losses balanced | Crossing 50 can signal a momentum shift |
| 30–50 | Bearish momentum | Rallies often fail below 50–60 in downtrends |
| Below 30 | “Oversold”: strong recent losses | In a downtrend, RSI can stay below 30 while price keeps falling |
Settings
- Period: 14 is Wilder’s default and the most common. Shorter periods (e.g. 7 or 9) are more sensitive; longer ones (e.g. 21) are smoother.
- Levels: 70/30 is standard. Some traders use 80/20 to reduce signals in strong markets, or 60/40 to judge trend momentum.
Changing settings changes the signals, so choose one set and test it rather than switching after every trade.
How traders use RSI
1. Overbought and oversold, in ranges
RSI’s 70/30 signals work best when price is moving sideways between clear support and resistance. RSI above 70 near the top of a range, or below 30 near the bottom, can suggest the move is running out of steam.
2. Trend momentum, using the 50 line
In trends, traders often ignore 70/30 and watch whether RSI holds above about 40–50 on pullbacks (uptrend) or fails below about 50–60 on rallies (downtrend). This keeps you aligned with momentum instead of fighting it.
3. Divergence
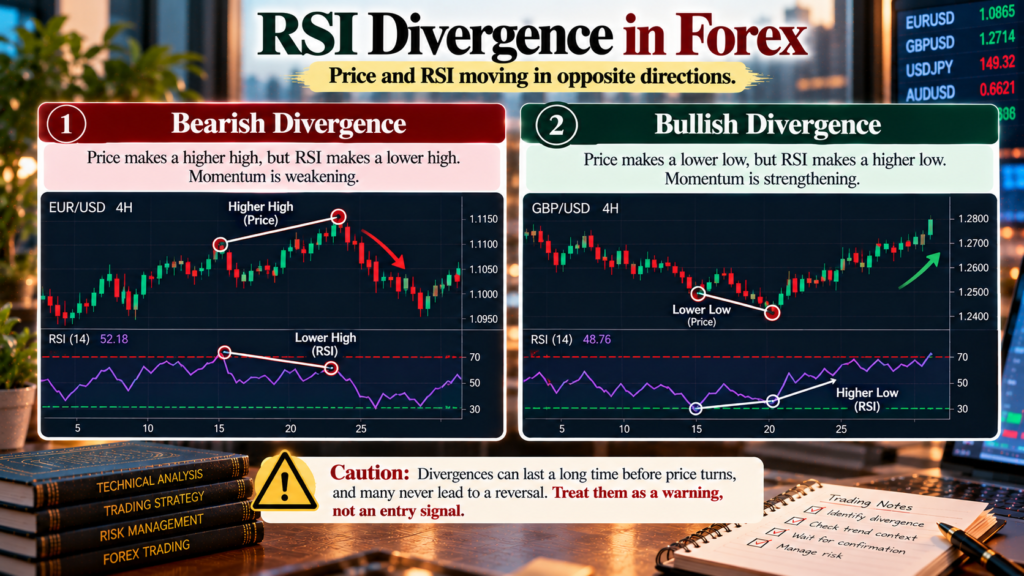
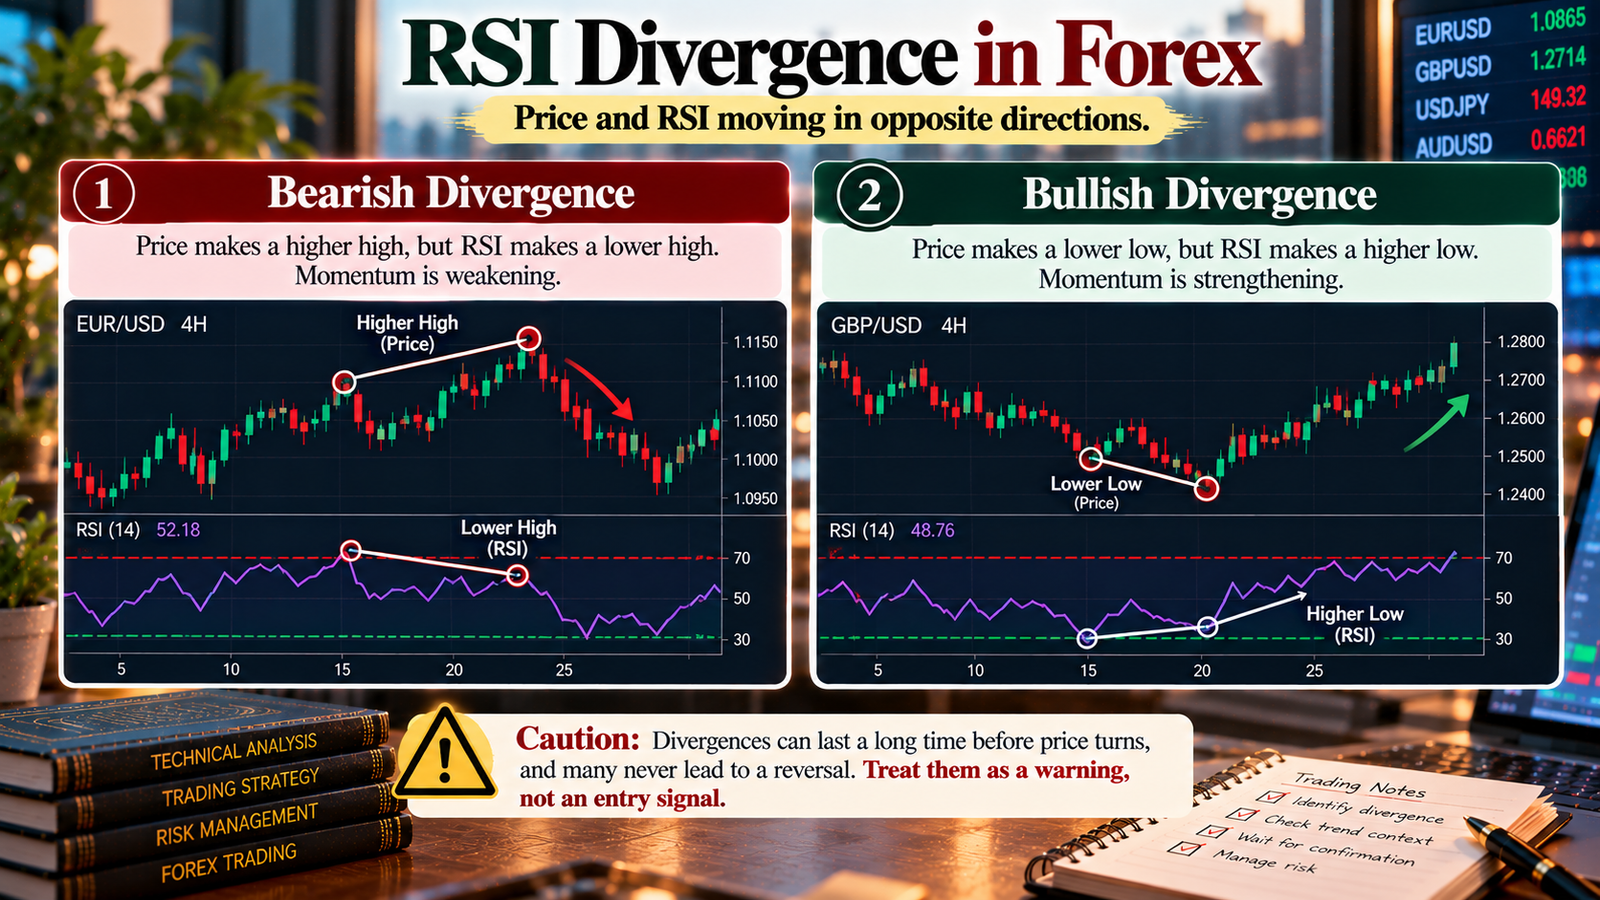
- Bearish divergence: price makes a higher high, but RSI makes a lower high. Momentum is weakening.
- Bullish divergence: price makes a lower low, but RSI makes a higher low.
- Caution: divergences can last a long time before price turns, and many never lead to a reversal. Treat them as a warning, not an entry signal.
4. Failure swings
Wilder also described failure swings: for example, RSI rises above 70, pulls back, fails to make a new high, and then breaks below its previous pullback low. That’s a momentum shift within the indicator itself, independent of price.
What does the evidence say?
Fact: Anderson and Li (2015, Banks and Bank Systems) tested RSI on daily USD/CHF data from 1998 to 2009. The standard 30/70 strategy lost 3,009 pips over 53 trades, while some non-standard thresholds (such as 35/65, 40/60 and 20/80) were profitable. The authors suggested that once a standard setting is widely used, its profitability fades.
Fact: Coakley, Marzano and Nankervis (2016, International Review of Financial Analysis) tested 113,148 technical rules across 22 currencies. After adjusting for data snooping, classic moving-average rules were insignificant in 2006–2015, while some rules based on Bollinger Bands and RSI remained profitable in that period.
Analysis: The evidence is mixed. Default RSI settings used mechanically may not work, and finding “better” settings on past data risks overfitting. The safest takeaway is to use RSI as a momentum tool within a tested plan, not as a standalone rule.
Worked example: USD/INR range trade (illustrative)
Suppose USD/INR futures have ranged between about 95.50 and 96.30 for several weeks. Price rallies to 96.20 near the top of the range, RSI is above 70 and shows bearish divergence, and a bearish rejection candle forms.
| Item | Value |
|---|---|
| Entry (sell) | 96.20 |
| Stop-loss (above the range) | 96.40 |
| Target (towards the range bottom) | 95.70 |
| Risk per lot | (96.40 − 96.20) × 1,000 = ₹200 |
| Potential reward per lot | (96.20 − 95.70) × 1,000 = ₹500 |
| Reward-to-risk | 2.5 : 1 |
| Capital and risk | ₹1,00,000 at 1% = ₹1,000 |
| Position size | ₹1,000 ÷ ₹200 = 5 lots (risk ₹1,000; potential reward ₹2,500) |
One NSE USD/INR lot is $1,000, so a ₹0.01 move equals ₹10 per lot. Figures are before brokerage, charges and slippage. If price breaks above the range instead, RSI “overbought” won’t save the trade; the stop will.
Step-by-step: using RSI
- Decide whether the market is trending or ranging, using price structure and a moving average.
- In a range: watch for RSI extremes near support and resistance.
- In a trend: use the 40–50 (uptrend) or 50–60 (downtrend) zones to time pullbacks in the trend’s direction.
- Look for divergence only as a warning, and wait for price confirmation.
- Set the stop beyond the level that would prove you wrong.
- Size the position from your risk per trade.
- Avoid trading RSI signals just before major news.
- Record results and review after 50–100 trades.
Expert analysis
Fact: RSI, introduced by Wilder in 1978, compares average gains and losses over a period (usually 14) on a 0–100 scale. On USD/CHF, the standard 30/70 rule lost money over 1998–2009 in one study; across 22 currencies, another study found some RSI-based rules remained profitable in 2006–2015 after adjusting for data snooping.
Analysis: RSI measures momentum, not value. “Overbought” means prices have risen quickly, not that they must fall. That’s why RSI tends to work better at range extremes and as a trend-momentum filter than as a reversal signal in strong trends. Mixed research results reflect this: how and where RSI is used matters more than the indicator itself.
Opinion: Beginners should start with the default 14-period RSI, decide first whether the market is trending or ranging, and use RSI only to confirm what price structure already suggests. Resist the urge to optimise settings on past data until you’ve logged at least 50–100 trades with one fixed setup.
Common mistakes
- Selling just because RSI is above 70 in a strong uptrend.
- Buying just because RSI is below 30 in a strong downtrend.
- Treating divergence as an immediate entry, when it can last a long time.
- Constantly changing settings to fit recent price.
- Ignoring the bigger trend on higher time frames.
- Using RSI without a stop-loss because “it’s oversold, it has to bounce”.
- Stacking several oscillators (RSI, Stochastic, CCI) that all measure similar momentum.
Myths vs facts
| Myth | Fact |
|---|---|
| “RSI above 70 means sell.” | It means strong recent gains. In trends, RSI can stay overbought while price keeps rising. |
| “RSI predicts reversals.” | RSI shows momentum; reversals need confirmation from price. |
| “The default 30/70 settings are proven to work.” | A USD/CHF study found the standard 30/70 rule lost money over 1998–2009. |
| “Divergence always leads to a reversal.” | Many divergences fail or take a long time to play out. |
| “Better settings will fix a losing RSI strategy.” | Optimising on past data can overfit and fail in live markets. |
Key takeaways
- RSI = 100 − 100 ÷ (1 + average gain ÷ average loss), usually over 14 periods with Wilder smoothing.
- 70/30 are traditional overbought and oversold levels, but in trends RSI can stay at extremes.
- Use RSI at range edges, as a trend-momentum filter around 50, and for divergence warnings.
- Research on currencies is mixed: default settings used mechanically may not work.
- Always combine RSI with price structure, a stop-loss and fixed risk. In our example, 5 USD/INR lots risked ₹1,000 for a potential ₹2,500.
- Test one fixed setup over 50–100 trades before changing it.
FAQs
- What is the RSI indicator in forex? A momentum oscillator that measures the size of recent gains versus losses on a 0–100 scale, usually over 14 periods.
- How is RSI calculated? RSI = 100 − 100 ÷ (1 + RS), where RS is average gain ÷ average loss over the period, updated with Wilder’s smoothing.
- What does RSI above 70 mean? Prices have risen strongly recently (“overbought”). It doesn’t guarantee a fall; in strong uptrends RSI can stay above 70.
- What does RSI below 30 mean? Prices have fallen strongly recently (“oversold”). In downtrends, RSI can stay below 30 while prices keep falling.
- What is the best RSI setting for forex? 14 is the standard. Shorter periods are more sensitive and give more signals; longer periods are smoother. Test one setting consistently.
- What is RSI divergence? When price and RSI move in different directions, for example price makes a higher high while RSI makes a lower high, suggesting weakening momentum.
- Is RSI divergence reliable? It’s a warning, not a signal. Divergences can persist or fail, so wait for price confirmation.
- What is the RSI 50 line used for? It separates bullish and bearish momentum. In uptrends, RSI often holds above 40–50 on pullbacks; in downtrends it often fails below 50–60.
- What is an RSI failure swing? A pattern described by Wilder where RSI fails to make a new extreme and then breaks its previous swing, signalling a momentum shift.
- Does RSI work in forex? Research is mixed. One study found the standard 30/70 rule lost money on USD/CHF, while another found some RSI-based rules remained profitable in recent years across 22 currencies.
- Can I use RSI on USD/INR? Yes, on NSE or BSE USD/INR futures traded through a SEBI-registered broker.
- Which time frame is best for RSI? It depends on your style. Higher time frames usually give more reliable signals than very short ones.
- Should I use RSI alone? No. Combine it with price structure, support and resistance, trend direction and risk management.
- Who created RSI? J. Welles Wilder, in his 1978 book New Concepts in Technical Trading Systems.
- What’s the difference between RSI and the Stochastic oscillator? Both measure momentum. RSI compares average gains and losses; the Stochastic compares the close with the recent high-low range.
- Can RSI be used for stop-loss placement? Not directly. Place stops based on price levels, such as beyond a range or swing, and use RSI for timing and context.
- How do I test an RSI strategy? Define exact rules (market type, RSI levels, entry trigger, stop and target), apply them to 50–100 trades, and review results in R after costs.