
Introduction
Scroll through trading content on social media and you’ll see screenshots of 10% days, “₹1 lakh a month from ₹50,000” and courses promising financial freedom within a year. It’s no surprise that beginners arrive with expectations the maths can’t support. Setting realistic trading returns as your goal isn’t pessimism; it’s what keeps you from taking the oversized risks that wipe out most new accounts.
Quick answer: Realistic expectations for a beginner are to lose little while learning in year one, then aim for consistency before profit. For context, a 1-year SBI fixed deposit pays around 6.25%, and the Nifty 50 Total Return Index has compounded at about 12.4% a year over 20 years, with deep drawdowns along the way. Claims of 1% a day imply over 1,000% a year and aren’t realistic. Your actual return depends on your edge (expectancy), the number of trades, risk per trade, and costs.
Why this matters in India
- Fact: SEBI found that over 91% of individual equity F&O traders made net losses in FY25, and 71% of individual intraday traders in the equity cash segment made net losses in FY23.
- Analysis: These figures suggest that for most individual traders, the realistic starting outcome is a loss. Setting goals around process and risk control, rather than monthly income, is the more honest approach.
- Note: Past returns of any benchmark don’t guarantee future returns. The figures here are for comparison, not predictions.
Benchmarks: what “normal” returns look like
Before setting a trading goal, compare it with what you could earn with far less effort and risk.
| Option | Return (annualised) | Risk | Source and date |
|---|---|---|---|
| SBI fixed deposit, 1 year | About 6.25% | Very low | SBI rates reported for September 2026 |
| SBI fixed deposit, 2–3 years | About 6.40% | Very low | Same |
| Nifty 50 Total Return Index, 20 years | 12.44% CAGR | High; fell about 59% during the 2008 crisis | NSE Indices, data to 27 February 2026 |
| Nifty 50 TRI, since inception (1995) | 12.74% CAGR | High | Same |
| Active individual F&O trading | Most traders lost money in FY25 | Very high | SEBI study |
What this means: a beginner trader competes not just against the market but against these simple alternatives. If your trading can’t beat a fixed deposit after costs and taxes, the time and stress may not be worth it.
Fact: NSE Indices notes that the Nifty 50 TRI hasn’t recorded a negative return over any 7-year or 10-year period in its available history. That’s a historical observation, not a guarantee.
The maths behind “too good to be true” claims
Small daily or monthly percentages sound modest, but compounding makes them enormous.
| Claim | What it implies over a year | Starting with ₹1,00,000 |
|---|---|---|
| 1% a day (250 trading days) | About 12× your money (+1,103%) | About ₹12.0 lakh |
| 10% a month | About 3.1× (+214%) | About ₹3.1 lakh |
| 5% a month | About 1.8× (+80%) | About ₹1.8 lakh |
| 2% a month | About 1.27× (+27%) | About ₹1.27 lakh |
| Nifty 50 TRI, 20-year average | +12.4% | About ₹1.12 lakh |
Calculated by compounding the stated rate; before costs and taxes.
Analysis: sustaining 5–10% a month would put a trader far above long-run market returns, year after year. When someone advertises these numbers, ask for audited, multi-year records and how much risk was taken to get them. High returns usually come with high risk of large losses.
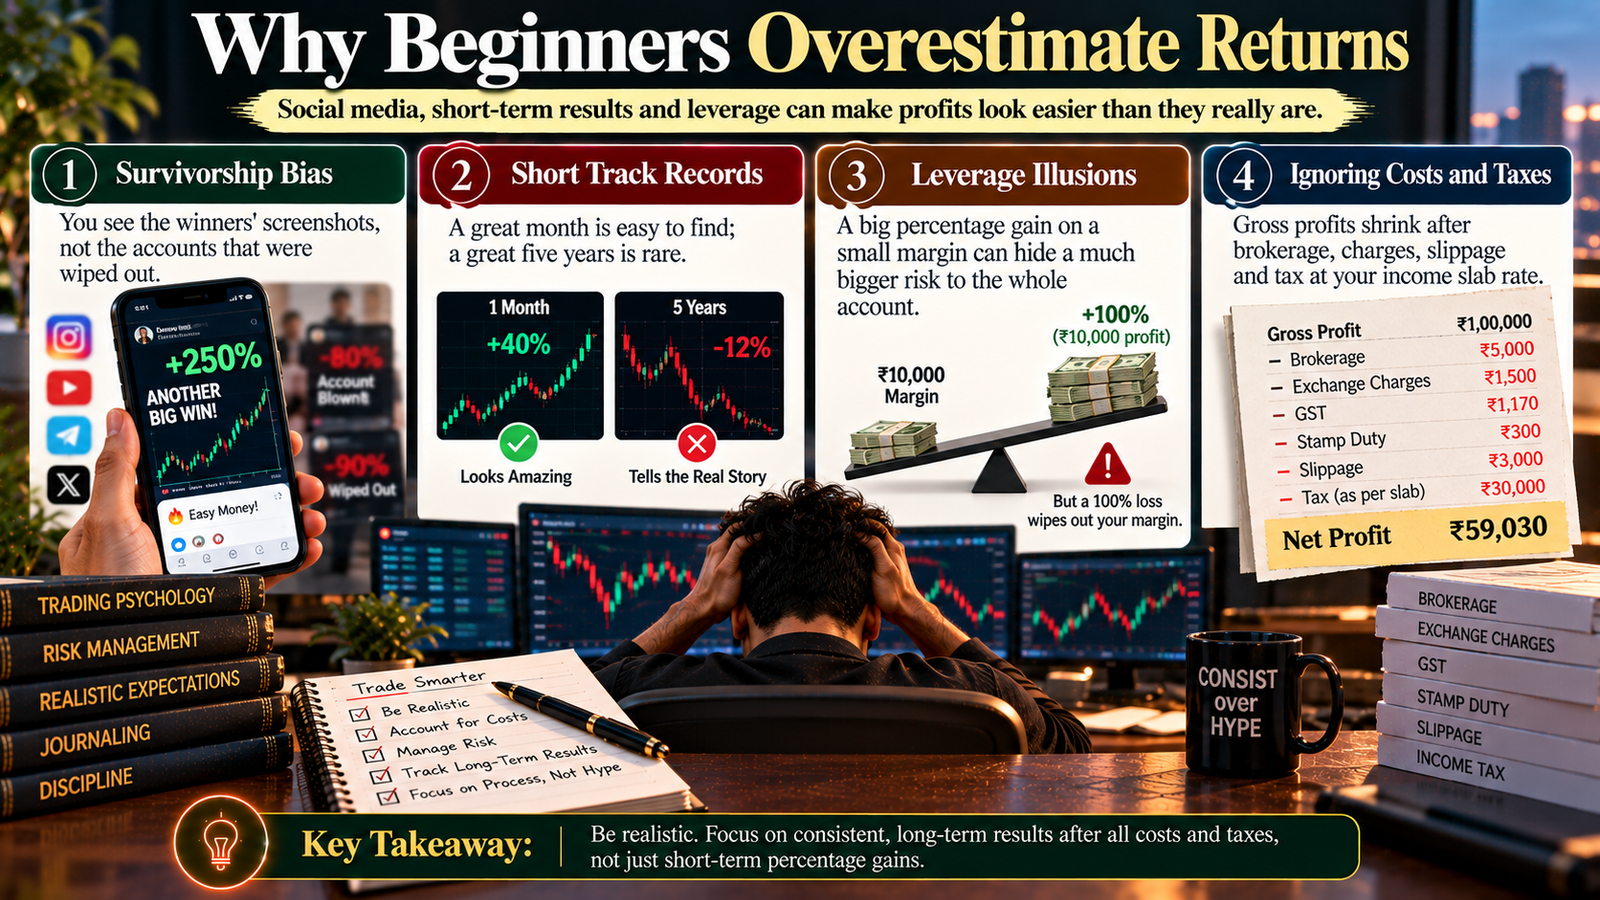
Why beginners overestimate returns
- Survivorship bias: you see the winners’ screenshots, not the accounts that were wiped out.
- Short track records: a great month is easy to find; a great five years is rare.
- Leverage illusions: a big percentage gain on a small margin can hide a much bigger risk to the whole account.
- Ignoring costs and taxes: gross profits shrink after brokerage, charges, slippage and tax at your income slab rate.
What actually drives your trading return
A simple way to estimate your annual return before costs:
Return ≈ expectancy (in R) × number of trades × risk per trade (% of capital)
- Expectancy: your average result per trade in multiples of what you risk (R). This is your edge.
- Number of trades: more trades multiply the edge, but also the costs.
- Risk per trade: the percentage of capital you risk on each trade.
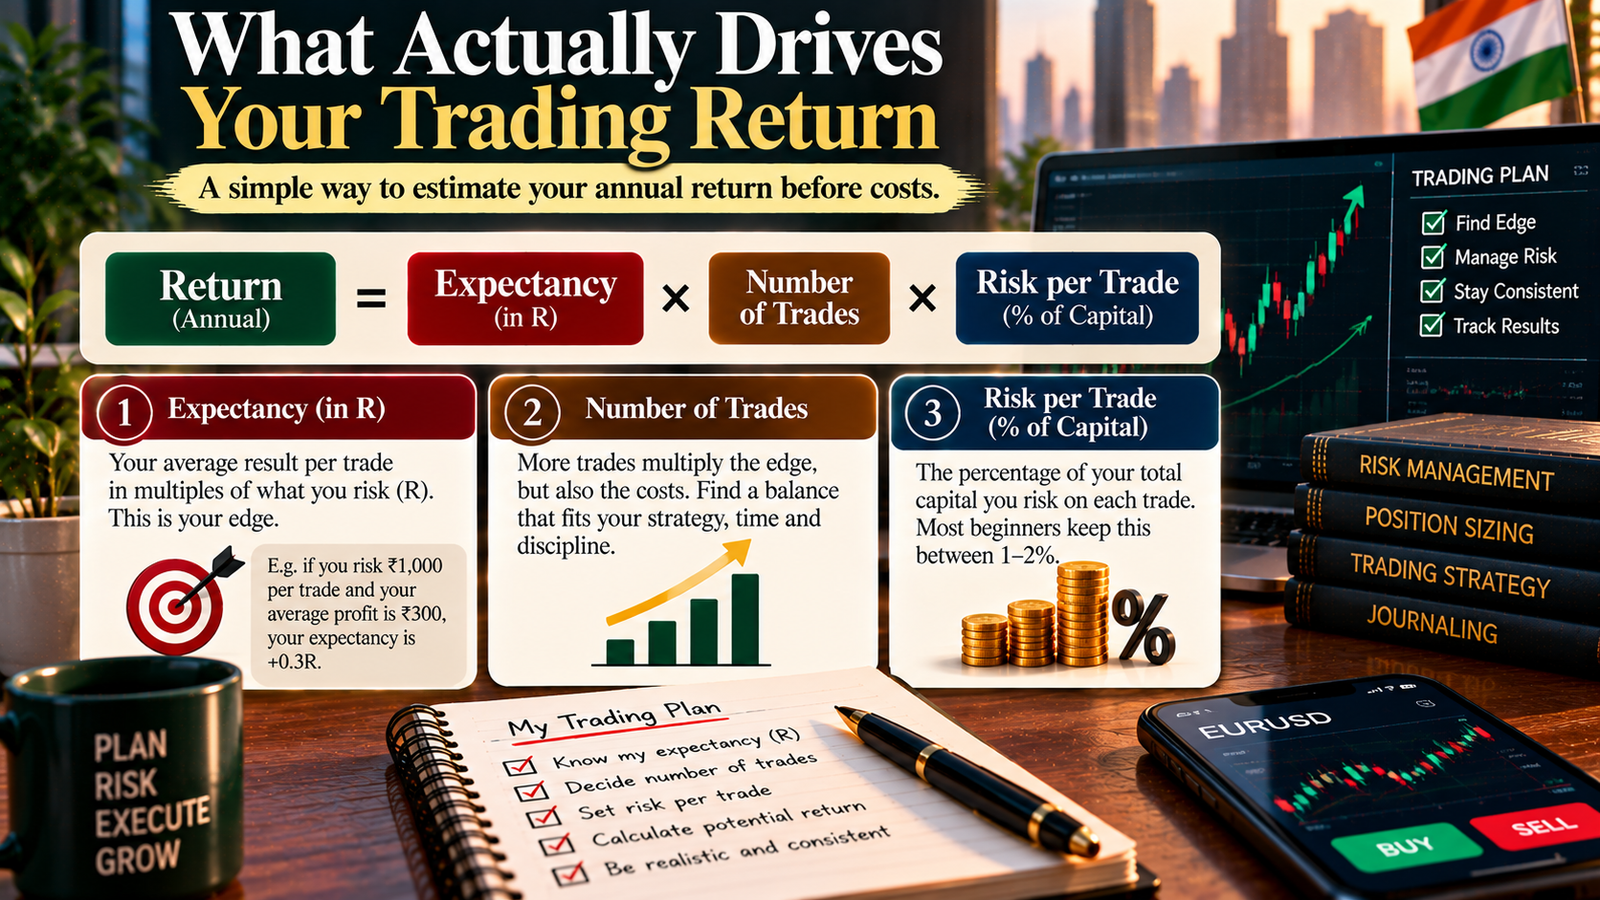
This is a rough, non-compounded estimate that ignores losing streaks and changes in size, but it shows what matters.
Worked example (illustrative)
Capital of ₹2,00,000, risking 1% (₹2,000) per trade, taking 100 trades a year, with assumed total costs of ₹150 per trade (₹15,000 a year).
| Expectancy | Gross result | After costs | Return on capital |
|---|---|---|---|
| 0R (no edge) | ₹0 | −₹15,000 | −7.5% |
| +0.1R | +₹20,000 | +₹5,000 | +2.5% |
| +0.2R | +₹40,000 | +₹25,000 | +12.5% |
| +0.3R | +₹60,000 | +₹45,000 | +22.5% |
For comparison, a 1-year SBI FD at 6.25% would earn about ₹12,500 on the same ₹2,00,000, with almost no risk or effort. Trading profits are also generally taxed as business income at your slab rate, and returns this year say little about next year.
Key insight: with no edge, costs guarantee a loss. Even a genuine small edge (+0.1R) may earn less than a fixed deposit. Doubling your risk per trade would double these figures, but also double the losses and drawdowns in bad periods.
Set process goals, not profit targets
Fixed monthly profit targets push beginners to force trades or increase risk when they’re behind. Process goals are within your control.
| Instead of… | Aim for… |
|---|---|
| “Make ₹10,000 this month” | Follow my plan on 90%+ of trades |
| “Double my account this year” | Keep maximum drawdown under 10% |
| “Win 70% of trades” | Achieve positive expectancy over 100 trades after costs |
| “Trade every day” | Take only setups in my written plan |
| “Replace my salary” | Build a documented track record of at least a year |
A realistic first-year roadmap
| Stage | Focus | Realistic outcome |
|---|---|---|
| Months 1–3 | Learn basics, write a plan, practise, journal every trade | No real money at risk, or very small |
| Months 4–6 | Go live at minimum size; follow rules; control losses | Small loss or roughly break-even is normal |
| Months 7–12 | Review 100+ trades; refine one thing at a time | Aim for consistent execution and positive expectancy; profit is a bonus |
| Year 2 and beyond | Scale slowly only if data supports it | Returns depend on your edge; many traders never find one |
These stages are guidelines, not promises. Many people learn trading isn’t for them, and discovering that at a small cost is a good outcome too.
Learn more about Slippage and Requotes in Forex
Expert analysis
Fact: A 1-year SBI fixed deposit pays about 6.25% (September 2026). The Nifty 50 TRI has compounded at about 12.4% a year over 20 years to February 2026, with a fall of about 59% during 2008. SEBI found over 91% of individual equity F&O traders made net losses in FY25.
Analysis: Trading returns come from edge × frequency × risk, minus costs. Beginners usually start with little or no proven edge, so the realistic early result is a small loss from costs and mistakes. Raising risk to hit a target doesn’t create an edge; it only magnifies whatever results you’d have had, including losses.
Opinion: A sensible beginner benchmark is “can I, after costs, eventually beat a fixed deposit with acceptable drawdowns?” If yes, that’s a real achievement. Anyone promising much more, consistently, deserves scepticism. And for many people, a long-term index investment alongside a small, well-controlled trading account is a more realistic path than trading for a living.
Common mistakes
- Setting monthly income targets before having any track record.
- Comparing yourself to social media screenshots instead of audited, long-term results.
- Increasing risk to catch up after a slow month.
- Ignoring costs and taxes when estimating returns.
- Judging success on a few weeks instead of 100+ trades.
- Quitting a job to trade without a long, documented record and adequate savings.
- Forgetting the benchmarks. If trading can’t beat an FD or index fund after costs, reconsider.
Myths vs facts
| Myth | Fact |
|---|---|
| “1% a day is a modest target.” | Compounded over 250 trading days, it’s about 12× your money in a year, far beyond long-run market returns. |
| “Good traders make money every month.” | Losing months and drawdowns are normal even for skilled traders. |
| “More risk means more profit.” | More risk magnifies both gains and losses; it doesn’t create an edge. |
| “Trading beats investing.” | Most individual F&O traders in India lost money in FY25, while the Nifty 50 TRI has compounded at about 12.4% a year over 20 years. |
| “I can trade my way out of debt.” | Trading with money you need greatly increases pressure and the chance of large losses. |
Key takeaways
- Compare any trading goal with simple benchmarks: FDs around 6.25% and the Nifty 50 TRI at about 12.4% a year over 20 years.
- “1% a day” or “10% a month” claims imply extreme annual returns and are unrealistic to sustain.
- Your return ≈ expectancy × number of trades × risk per trade, minus costs and taxes.
- With no edge, costs guarantee a loss; even a small edge may not beat an FD.
- Set process goals (rule adherence, drawdown limits, sample size) rather than profit targets.
- In year one, aim to learn cheaply; profit is a bonus.
FAQs
- What are realistic trading returns for a beginner? In the first year, a small loss or roughly break-even while learning is realistic. Profitability, if it comes, usually follows a long period of consistent execution.
- Is 1% a day possible in trading? Compounded over 250 trading days, 1% a day turns ₹1 lakh into about ₹12 lakh. Sustaining that isn’t realistic, and chasing it usually means excessive risk.
- What is a good monthly return in trading? There’s no fixed number. For perspective, 2% a month compounds to about 27% a year, well above the Nifty 50 TRI’s long-run average of about 12.4%.
- How do trading returns compare with an FD? A 1-year SBI FD paid about 6.25% in September 2026 with very low risk. Trading must beat that after costs and taxes to be worth the risk and effort.
- What has the Nifty 50 returned historically? The Nifty 50 TRI compounded at about 12.44% a year over the 20 years to February 2026, according to NSE Indices, with a fall of about 59% during 2008.
- How much can I make with ₹2 lakh? It depends on your edge. In our illustrative example, risking 1% per trade over 100 trades, a +0.2R edge gives about 12.5% after costs, while no edge gives about −7.5%.
- What is expectancy in trading? Your average result per trade, in multiples of the amount risked (R). It’s the core measure of whether you have an edge.
- Should I set a monthly profit target? It’s better to set process goals, such as rule adherence and drawdown limits. Profit targets can push you to force trades or take bigger risks.
- Can I make a living from trading? Some people do, but most individual traders lose money. Consider it only after a long, documented record, with adequate savings and no reliance on trading income.
- How are trading profits taxed in India? Intraday equity and F&O profits are generally treated as business income, taxed at your slab rate. Consult a chartered accountant for your situation.
- Why do social media traders show such high returns? You mostly see winning periods, not full records or losses. Short-term results also say little about long-term skill.
- Does more risk mean more profit? More risk magnifies results in both directions. Without an edge, it just means bigger losses.
- How long before I know my realistic return? You need a meaningful sample, often 100 or more trades, taken consistently with your rules.
- Is it bad if I lose money in my first year
? It’s common. The goal is to keep losses small while you learn and gather data.
- What is a realistic drawdown? Even good strategies have losing periods. Many traders set a maximum drawdown limit, such as 10%, at which they pause and review.
- Should I invest instead of trade? For many people, long-term investing is simpler and historically rewarding. Some combine a core investment with a small trading account.
- What’s the most realistic goal for a beginner? Follow your plan consistently, control losses, and build a track record that tells you whether you have an edge.