Quick answer
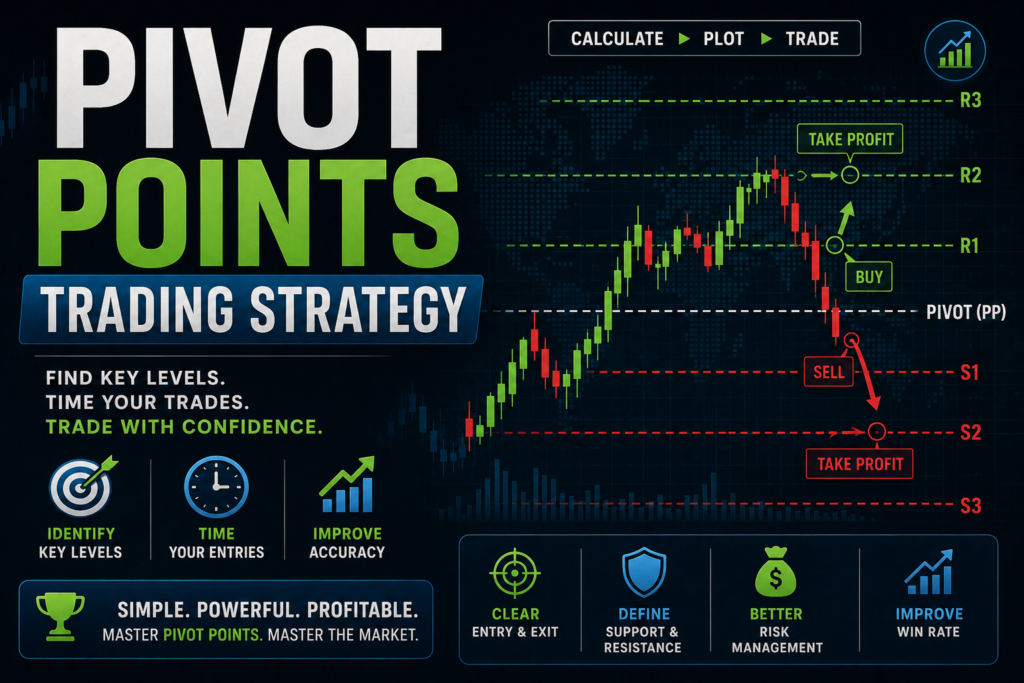
A pivot point trading strategy uses a central pivot (PP) and its support and resistance levels – S1-S3 and R1-R3 – as objective areas to trade from. Traders buy bounces at support and sell at resistance, trade breakouts through levels, and use price’s position relative to the pivot as a directional bias.
Introduction
Some indicators lag; pivot points do not. They are calculated once from the previous period’s price and then sit on your chart as fixed, objective levels for the whole session. That is why the pivot point trading strategy remains a favourite of intraday and forex traders – it turns fuzzy support and resistance into precise, pre-defined lines everyone can see.
This guide covers the pivot point trading strategy end to end: what pivot points are, how to calculate them, the main variations, and three practical ways to trade them. Every formula and level here has been computed and verified. It is educational content, not financial advice.
What Are Pivot Points?
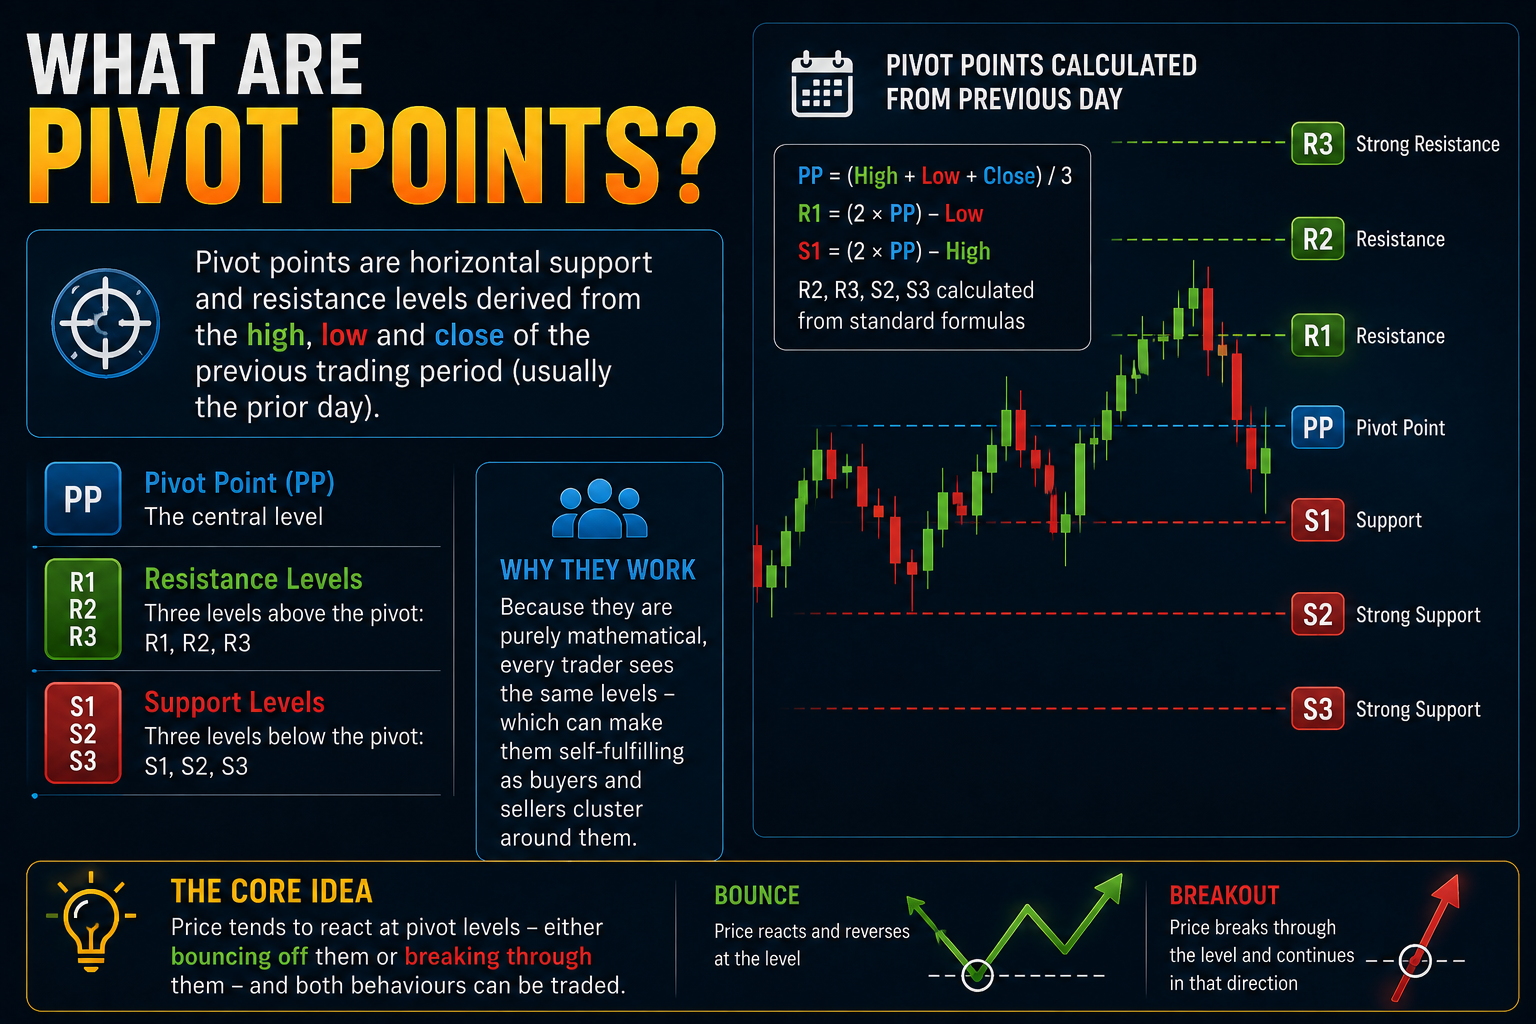
Pivot points are horizontal support and resistance levels derived from the high, low and close of the previous trading period (usually the prior day). The central level is the pivot point (PP), with three resistance levels above (R1, R2, R3) and three support levels below (S1, S2, S3). Because they are purely mathematical, every trader sees the same levels – which can make them self-fulfilling as buyers and sellers cluster around them.
The core idea behind any pivot point trading strategy is simple: price tends to react at these levels, either bouncing off them or breaking through them, and both behaviours can be traded.
How Pivot Points Are Calculated
Standard (or ‘floor’) pivot points use these formulas, based on the previous period’s High, Low and Close:
PP = (High + Low + Close) / 3
R1 = (2 x PP) – Low S1 = (2 x PP) – High
R2 = PP + (High – Low) S2 = PP – (High – Low)
R3 = High + 2 x (PP – Low) S3 = Low – 2 x (High – PP)
Worked example: suppose yesterday’s High was 1.1050, Low 1.0980 and Close 1.1020. The levels come out as:
| Level | Value | Level | Value |
|---|---|---|---|
| R3 | 1.1123 | PP | 1.1017 |
| R2 | 1.1087 | S1 | 1.0983 |
| R1 | 1.1053 | S2 | 1.0947 |
| S3 | 1.0913 |
You rarely need to do this by hand – every major platform (TradingView, MetaTrader, Zerodha) plots pivot points automatically – but knowing the math helps you trust the levels.
Types of Pivot Points
The standard formula is the most common, but a pivot point trading strategy can use several variations. Each spaces the levels differently:
| Type | How it differs |
|---|---|
| Standard (Floor) | The classic formula above; most widely used. |
| Fibonacci | Uses Fibonacci ratios (38.2%, 61.8%, 100%) of the prior range for levels. |
| Camarilla | Places levels closer to price using multipliers; popular for reversals. |
| Woodie’s | Weights the closing price more heavily in the pivot calculation. |
| DeMark’s | Conditional formula based on the close relative to the open. |
Why Traders Use Pivot Points
- Objective levels – no subjective drawing; the math is fixed for the session.
- Universally watched – many traders see the same lines, adding to their significance.
- Great for intraday – daily pivots suit short timeframes especially well.
- Versatile – they work for bounce, breakout and bias approaches alike.
Pivot Point Trading Strategy 1: The Bounce
The bounce is the classic range-based pivot point trading strategy. In a ranging or quiet market, price often reverses at pivot levels, so traders fade the move back toward the pivot.
- Buy setup – price falls to a support level (S1 or S2), shows a reversal signal, and you go long targeting the pivot or the next level up.
- Sell setup – price rises to a resistance level (R1 or R2), stalls, and you go short targeting the pivot or the next level down.
- Stop-loss – placed just beyond the level you bounced from, so a clean break invalidates the trade quickly.
Pivot Point Trading Strategy 2: The Breakout
The breakout approach is the opposite: instead of fading levels, you trade decisive breaks through them, which work best in trending or high-momentum sessions.
- Bullish breakout – price breaks and holds above R1 (or the pivot), and you go long targeting R2 or R3.
- Bearish breakout – price breaks below S1 (or the pivot), and you go short targeting S2 or S3.
- Confirmation – wait for a candle to close beyond the level rather than chasing the first touch, to avoid false breaks.
Pivot Point Trading Strategy 3: Directional Bias
The simplest use of pivots is as a bias filter for the day. Price trading above the central pivot suggests a bullish lean; below it suggests bearish. Many traders only take long setups while price is above the pivot and shorts while it is below, using the PP as a line in the sand. This turns the pivot point trading strategy into a filter that keeps you on the right side of the day’s momentum.
Adding Confirmation for Higher-Probability Trades
Pivot levels are stronger when they line up with other evidence. A robust pivot point trading strategy rarely trades a level in isolation.
- Candlestick signals – a pin bar or engulfing candle at a pivot level strengthens a bounce trade.
- RSI or MACD – divergence or an overbought/oversold reading at a level adds conviction.
- Confluence – a pivot that coincides with a moving average, round number or prior high/low is far more significant.
- Trend context – align pivot trades with the higher-timeframe trend for better odds.
Best Markets, Timeframes and Risk Management
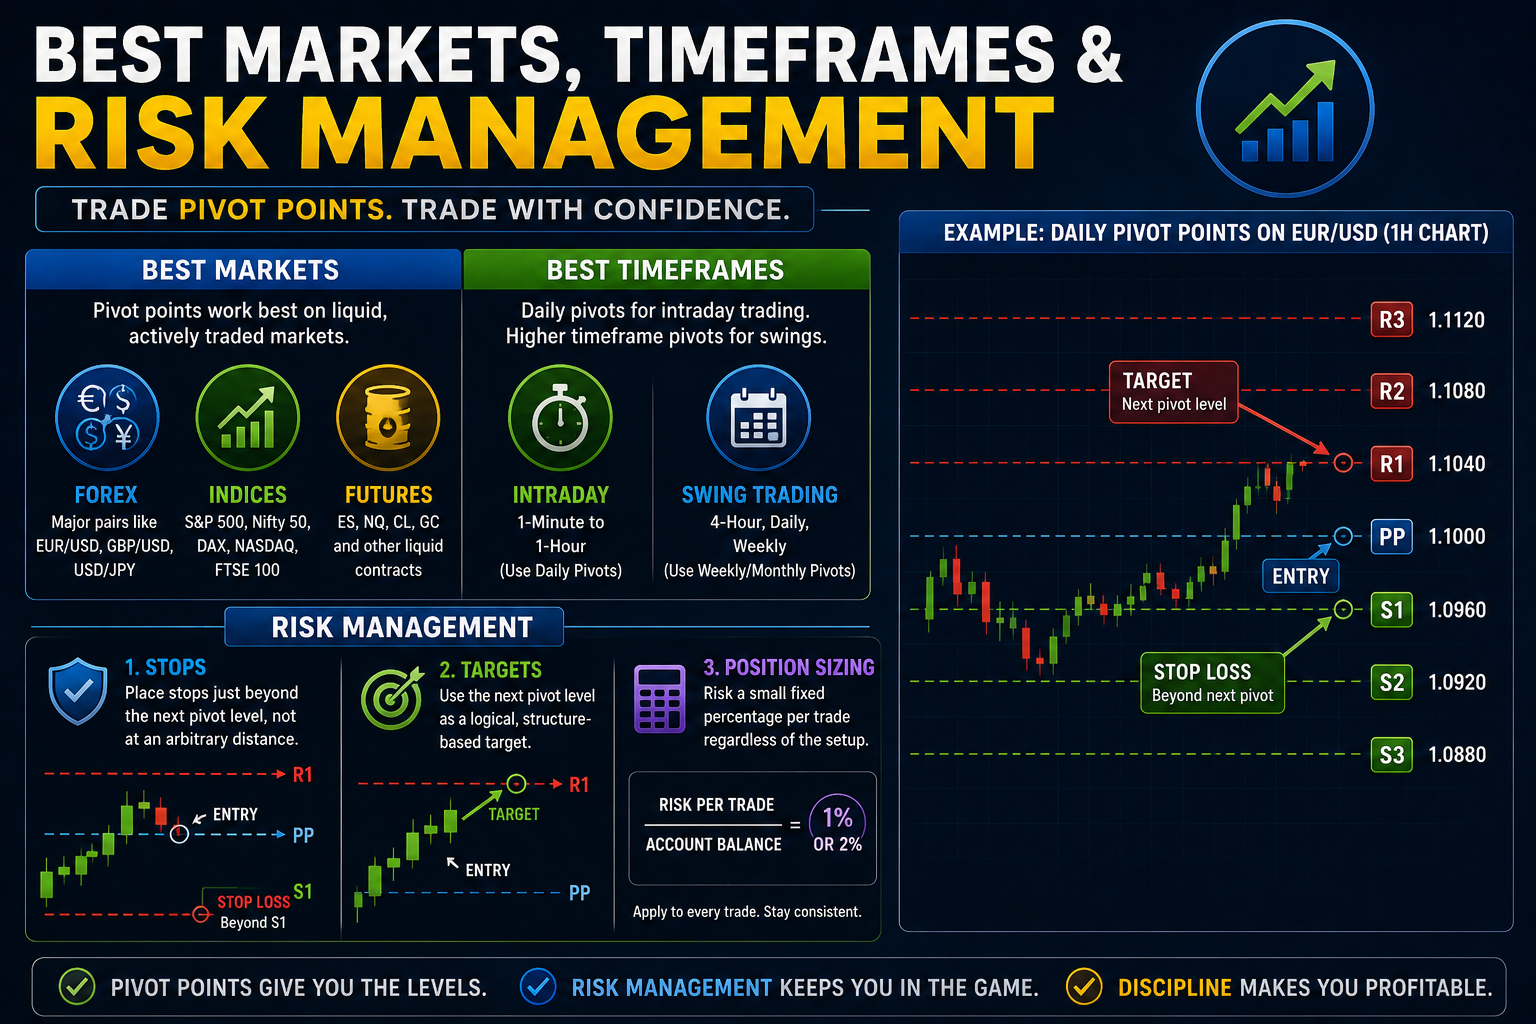
Pivot points shine on liquid, actively traded markets – major forex pairs, indices and futures – and on intraday timeframes (1-minute to 1-hour) using daily pivots. Weekly and monthly pivots suit swing traders.
- Risk management – place stops just beyond the next pivot level, not at an arbitrary distance.
- Targets – use the next pivot level as a logical, structure-based target.
- Position sizing – risk a small fixed percentage per trade regardless of the setup.
Common Mistakes
- Trading every touch of a level without confirmation.
- Using the bounce strategy in a strong trend, or the breakout strategy in a dead range.
- Ignoring the higher-timeframe trend and news events.
- Placing stops too tight, right at the level, so normal noise stops you out.
- Treating pivots as certainties rather than probabilities.
Myths vs Facts
| Myth | Fact |
|---|---|
| Pivot points predict price. | They mark probable reaction zones, not guaranteed turning points. |
| Pivots work in every market condition. | Bounce suits ranges; breakout suits trends – match the tool to the market. |
| More pivot levels means more accuracy. | Extra levels add clutter; PP, R1/S1 and R2/S2 are the most useful. |
| Pivot points work alone. | They perform best combined with confirmation and trend context. |
Risk disclaimer
This article is for educational purposes only and is not investment advice. Trading carries a high risk of loss, and technical levels like pivot points describe probabilities, not certainties. Example levels are illustrative. Always use risk management and consult a licensed adviser before trading.
Expert Analysis
The enduring appeal of the pivot point trading strategy is its objectivity. Most support and resistance is drawn by hand and therefore debatable; pivots are calculated the same way by everyone, which removes argument and, more importantly, concentrates orders. When thousands of traders and algorithms watch the same R1 or S1, that level gains real influence – not because the math is magic, but because collective attention makes it a genuine decision point. This is the quiet reason pivots keep working when many indicators fade.
The practical skill is knowing which pivot strategy the market is offering. A ranging session rewards fading levels; a trending or news-driven session punishes it and rewards breakouts. The best pivot traders therefore read regime first and pick the approach second, rather than forcing one method onto every day. Layer in confirmation – a candlestick signal, a momentum reading, or confluence with a moving average – and place stops just beyond the next level, and the pivot point trading strategy becomes less a set of lines and more a complete, rules-based framework for the trading day.
Key Takeaways
- A pivot point trading strategy uses a central pivot and S1-S3 / R1-R3 as objective trade levels.
- Standard pivots come from the prior period’s high, low and close; every platform plots them.
- Three core approaches: bounce (ranges), breakout (trends) and directional bias (PP as a filter).
- Add confirmation – candlesticks, RSI/MACD, confluence and trend – for higher-probability trades.
- Place stops just beyond the next level and risk a small fixed percentage per trade.
Frequently Asked Questions (FAQ)
Q: What is a pivot point trading strategy?
A: It is a method that uses a central pivot and its support/resistance levels as objective areas to trade bounces, breakouts, or to set a directional bias.
Q: How are pivot points calculated?
A: The standard pivot is (High + Low + Close) / 3 of the previous period, with R1-R3 and S1-S3 derived from it using set formulas.
Q: What are R1, R2, S1 and S2?
A: They are the first and second resistance levels above the pivot (R1, R2) and the first and second support levels below it (S1, S2).
Q: Which pivot point type is best?
A: Standard pivots are the most widely used, but Fibonacci and Camarilla are popular too; the best choice depends on your style and testing.
Q: Are pivot points good for intraday trading?
A: Yes. Daily pivots are especially popular on short intraday timeframes, giving fixed levels for the whole session.
Q: How do I trade a pivot point bounce?
A: Buy near a support level or sell near a resistance level when price shows a reversal signal, with a stop just beyond that level.
Q: How do I trade a pivot point breakout?
A: Enter when price closes decisively beyond a level – long above R1 or the pivot, short below S1 – targeting the next level.
Q: Do pivot points really work?
A: They mark levels many traders watch, which gives them influence, but they describe probabilities, not certainties, and work best with confirmation.
Q: What timeframe should I use for pivots?
A: Daily pivots suit intraday trading; weekly and monthly pivots suit swing and position traders.
Q: Should I combine pivots with other indicators?
A: Yes. Candlestick signals, RSI/MACD and confluence with moving averages or round numbers improve the odds.
Q: Where do I place my stop-loss with pivots?
A: Just beyond the pivot level you traded from, so a clean break through it quickly invalidates the trade.
Q: Can I use pivot points in forex?
A: Yes. Pivots are very popular in forex, especially on liquid major pairs during active sessions.
Q: What is the central pivot (PP) used for?
A: As a directional bias line: price above PP leans bullish, below PP leans bearish for the session.
Q: Why do pivot points sometimes fail?
A: Strong trends and major news can blow through levels; using the wrong approach for the market condition is a common cause.
Q: Are pivot points a leading or lagging indicator?
A: They are leading in the sense that they are set in advance from prior data and mark future levels, rather than reacting to current price.