Key Takeaways
- The Wyckoff method reads price ranges as campaigns by large operators: accumulation before markups and distribution before markdowns.
- It rests on three laws: supply and demand, cause and effect, and effort versus result.
- Accumulation and distribution each unfold in five phases (A to E). The most tradable events are the spring in accumulation and the upthrust after distribution.
- Spot forex has no central volume, so Wyckoff traders use tick volume or, better, real exchange volume on NSE currency futures or MCX contracts.
- Wyckoff gives context and timing, not certainty. Every trade still needs a defined stop and position size.
Long before “smart money” became a social media phrase, Richard Wyckoff was teaching traders to ask who was buying and who was selling inside a trading range. His framework is still one of the clearest ways to read sideways markets. This guide explains the Wyckoff method in forex terms: the three laws, the Composite Man, accumulation and distribution phases, and how to trade a spring with a ₹ example on MCX gold. It is for intermediate Indian traders in USD/INR futures, MCX metals or major pairs on Indian exchanges who want a structured way to read ranges and breakouts.
What is the Wyckoff method in forex?
The Wyckoff method is a price-and-volume framework developed by Richard D. Wyckoff in the early 20th century. It treats trading ranges as periods where large players accumulate or distribute positions before a trend. In forex, traders use it to spot when a range is likely to break up or down, and to time entries at springs, upthrusts and retests.
Wyckoff (1873–1934) began as a stock runner at 15, later ran a brokerage and edited The Magazine of Wall Street. According to StockCharts ChartSchool’s Wyckoff tutorial, he studied large operators of his day and codified their practices into trading principles taught at what became the Stock Market Institute.
The Composite Man
Wyckoff asked traders to imagine every move as the work of one large operator, the Composite Man, who plans a campaign: buy quietly at low prices, push price up, sell to the public at high prices, then push it down. It is a mental model, not a claim that one entity controls the market. It helps you ask, at each swing, “who benefits from this move?”
The three Wyckoff laws
- Supply and demand. When demand exceeds supply, price rises. When supply exceeds demand, price falls. Everything else in the method is about spotting which side is gaining control.
- Cause and effect. The size of a trading range (the cause) gives a rough guide to the size of the move that follows (the effect). Wyckoff used point-and-figure counts to estimate this. A long, wide range can fuel a larger trend than a short, narrow one.
- Effort versus result. Volume is effort; price movement is result. When heavy volume produces little price progress, or price moves far on thin volume, the divergence can signal a change in trend.
Wyckoff accumulation: the five phases
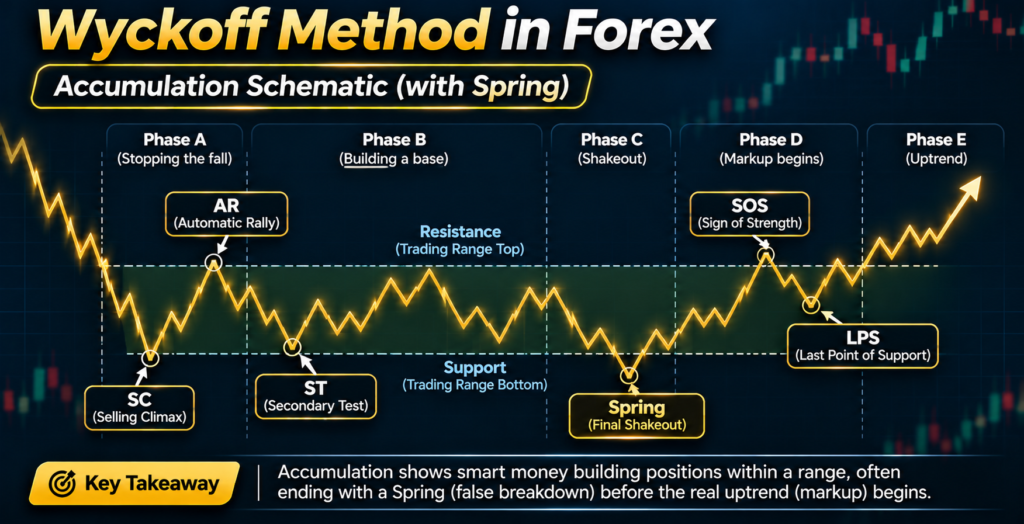
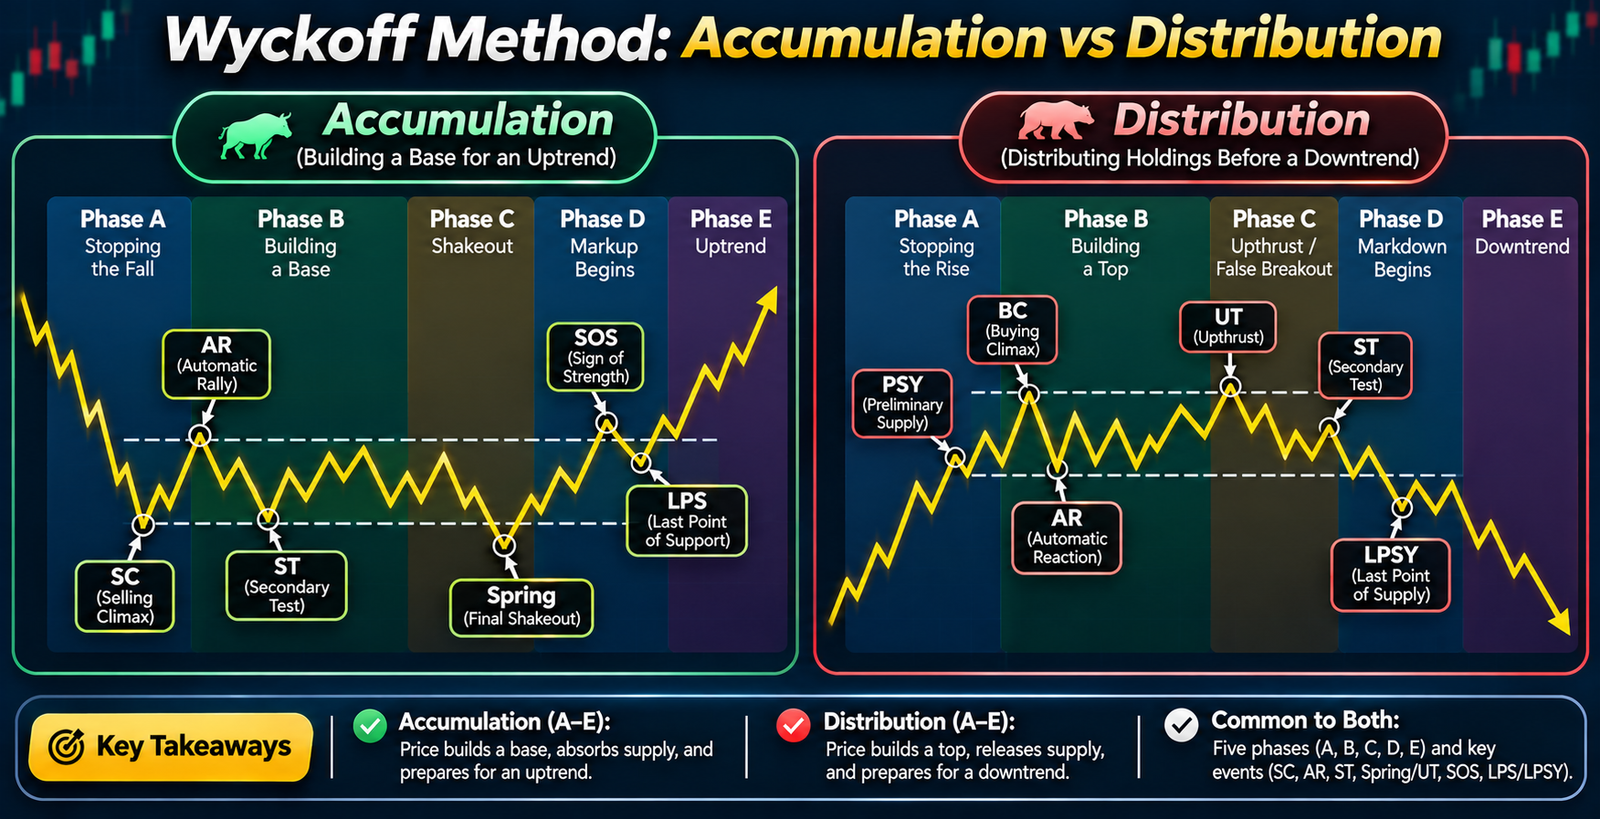
Accumulation is a range that forms after a downtrend, where large buyers absorb selling before a markup.
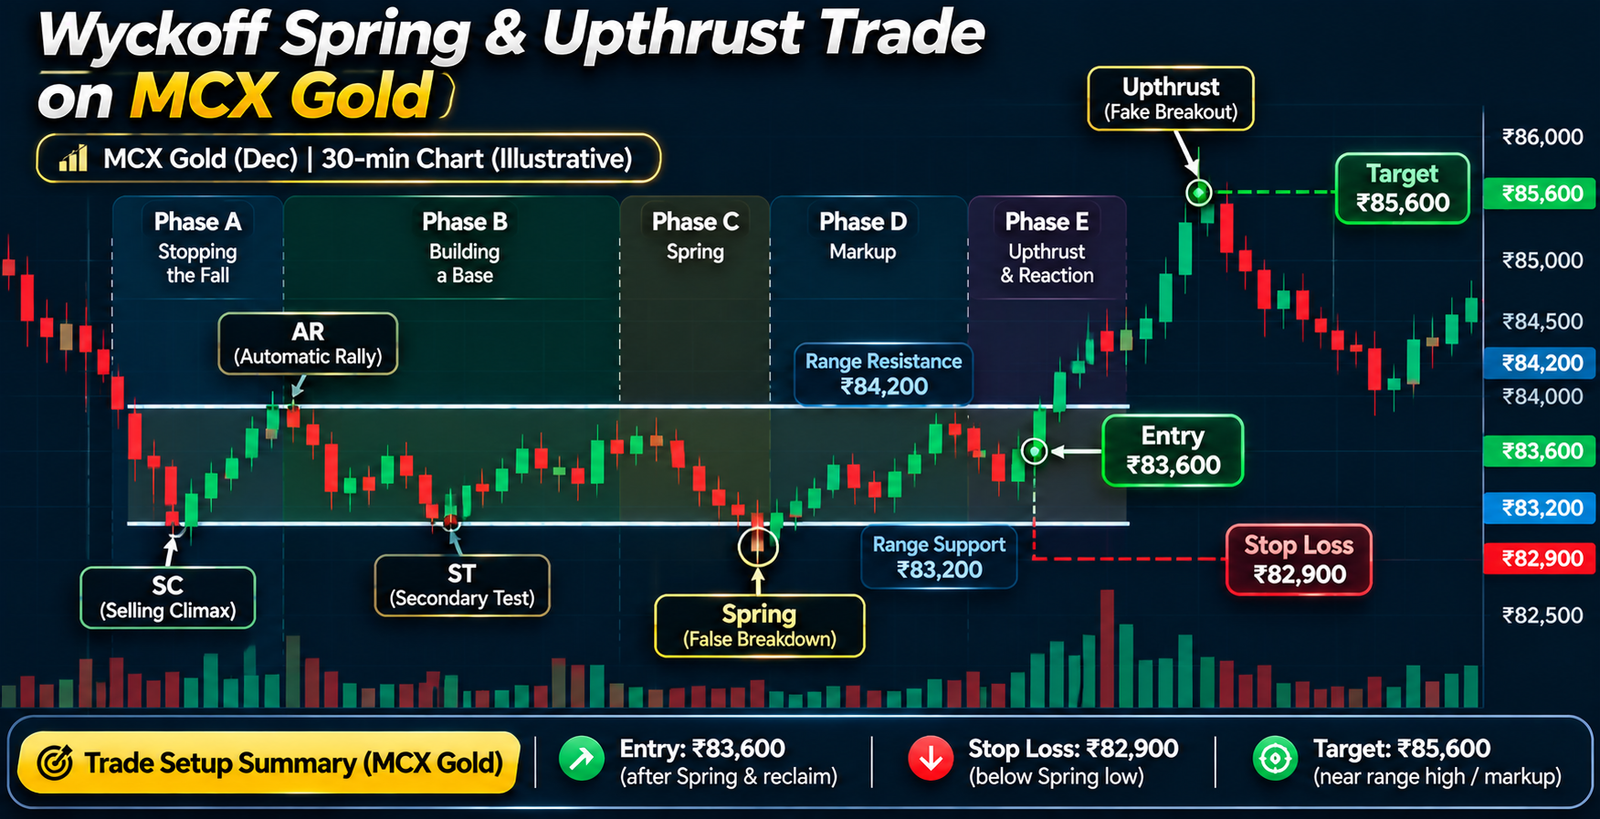
- Phase A, stopping the downtrend. Preliminary support (PS) appears, then a selling climax (SC), heavy panicky selling absorbed by professionals. An automatic rally (AR) follows, and a secondary test (ST) revisits the SC area on lighter volume. The SC low and AR high define the range.
- Phase B, building the cause. Price swings inside the range for some time while large interests accumulate. Volume tends to shrink on down-swings.
- Phase C, the test. The decisive test of remaining supply, often a spring: a dip below range support that quickly reverses back inside, trapping late sellers. A low-volume retest that holds confirms it.
- Phase D, demand takes over. Price rallies on signs of strength (SOS), with wider spread and higher volume, and pulls back to last points of support (LPS) on lighter volume.
- Phase E, markup. Price leaves the range and trends higher, sometimes forming smaller re-accumulation ranges along the way. A back-up (BU) to former resistance often offers a final entry.
Wyckoff distribution: the mirror image
Distribution forms after an uptrend, as large holders sell into public demand.
- Preliminary supply (PSY) and a buying climax (BC) mark heavy buying absorbed by sellers near the top.
- An automatic reaction (AR) defines the range low, and a secondary test (ST) revisits the BC area.
- An upthrust after distribution (UTAD) pushes above range resistance and fails back inside. It is the distribution version of the spring.
- A sign of weakness (SOW) breaks to or below support on rising volume, and a last point of supply (LPSY) is a weak rally that fails before markdown.
| Event | Accumulation | Distribution | What it tells you |
|---|---|---|---|
| Climax | Selling climax (SC) | Buying climax (BC) | Panic or euphoria absorbed by professionals |
| First reaction | Automatic rally (AR) | Automatic reaction (AR) | Sets the other edge of the range |
| False break | Spring below support | Upthrust (UTAD) above resistance | Late traders trapped; best risk-reward entry |
| Confirmation | Sign of strength (SOS) | Sign of weakness (SOW) | Control has shifted |
| Last entry point | Last point of support (LPS) | Last point of supply (LPSY) | Low-volume pullback before the trend |
If the spring sounds like a liquidity sweep, that is because it is the same idea. Modern smart money concepts and liquidity grab and stop-hunt setups borrow heavily from Wyckoff’s spring and upthrust.
How do you use Wyckoff without real forex volume?
Spot forex is decentralised, so there is no single volume figure. Wyckoff traders handle this in three ways:
- Tick volume. Platforms count price changes per bar. It is a rough proxy for activity, useful for spotting climaxes, but not true traded volume.
- Exchange-traded futures. NSE USD/INR futures and MCX gold and silver report real volume and open interest. For Indian traders, these are the cleanest instruments for Wyckoff analysis.
- Volume profile. Distribution of volume by price inside a range helps locate where most business was done. See our volume profile guide.
Even with good volume data, keep the reading simple: is volume expanding on moves in one direction and drying up on moves the other way?
Step by step: trading a Wyckoff spring
- Identify a prior trend. Accumulation needs a meaningful decline before it. A range in the middle of nowhere is just a range.
- Mark the range. Use the selling climax low and automatic rally high as boundaries. Our guide to market structure trading helps with swing points.
- Wait for Phase C. Look for a quick break below support that closes back inside the range, ideally on a volume spike followed by quiet.
- Wait for the test. A low-volume retest of the spring area that holds is the confirmation many Wyckoff traders want.
- Enter. Buy on the test or on the first sign of strength back toward mid-range.
- Set the stop below the spring low, with a buffer based on volatility. The ATR stop-loss tool helps size that buffer.
- Target the range top first, then trail for a markup if the sign of strength breaks resistance.
- Size the position so the stop equals no more than 1% of capital. Use our position size calculator.
Worked example: a spring on MCX Gold Mini
Example (hypothetical numbers, not current prices): Arvind trades MCX Gold Mini with ₹3,00,000 capital and risks 1%, or ₹3,000, per trade. Gold Mini is quoted per 10 grams on a 100-gram contract, so each ₹1 move is ₹10 per lot.
- After a sharp decline, gold forms a range between ₹1,21,000 (selling climax low) and ₹1,24,000 (automatic rally high).
- During Phase C, price drops to ₹1,20,700, below support, then closes back above ₹1,21,000. That is the spring.
- A quieter retest holds at ₹1,20,900. Arvind buys at ₹1,21,200.
- Stop: ₹1,20,600, below the spring low. Risk = ₹600 per 10 g × ₹10 = ₹6,000 per lot.
- His ₹3,000 risk budget is smaller than one lot’s risk. The correct size on Gold Mini is zero lots, so he either skips the trade or uses a smaller contract, such as Gold Guinea or Gold Petal, where each ₹1 move is worth far less.
This is the most useful lesson in the example. A textbook Wyckoff setup still has to fit your account. On a smaller contract, a ₹2,800 move from entry to the range top at ₹1,24,000 against ₹600 of risk would be about 4.7 to 1, but only if the trade size respects the 1% limit.
Common mistakes with the Wyckoff method
- Labelling every range as accumulation. Most ranges do not end in clean markups. Wait for Phase C evidence.
- Buying the first break below support. A spring is a break that fails. Until price closes back inside, it may be the start of a markdown.
- Over-trusting tick volume. It reflects quote activity, not traded size. Prefer exchange volume where possible.
- Ignoring the bigger picture. A spring against a strong higher-timeframe downtrend, or into a major RBI or Fed event, is a lower-quality trade.
- Skipping position sizing. As the MCX example shows, wide Wyckoff ranges can require stops too large for small accounts.
- Trading the pattern on offshore apps. Indian residents should apply Wyckoff to exchange-traded contracts such as NSE currency futures and MCX metals through SEBI-registered brokers, not to leveraged spot forex on overseas platforms.
Frequently asked questions
Does the Wyckoff method work in forex?
The logic of supply, demand and trapped traders applies to any liquid market, including forex. The limitation is volume: spot forex has no central volume, so tick volume is a rough substitute. Indian traders can apply Wyckoff more reliably to NSE currency futures and MCX contracts, which report actual traded volume.
What is a Wyckoff spring?
A spring is a move below the support of an accumulation range that quickly reverses back inside the range. It shakes out weak holders and triggers sell stops, letting large buyers absorb supply at lower prices. A successful spring is often followed by a low-volume test that holds above the spring low.
What is the difference between a spring and an upthrust?
A spring happens in accumulation: price dips below range support and recovers. An upthrust after distribution (UTAD) happens near the end of distribution: price pushes above range resistance and fails back inside. Both trap traders on the wrong side of a breakout, and both often precede a move in the opposite direction.
What are the five phases of Wyckoff accumulation?
Phase A stops the prior downtrend with preliminary support, a selling climax, an automatic rally and a secondary test. Phase B builds the cause inside the range. Phase C tests supply, often with a spring. Phase D shows signs of strength and last points of support. Phase E is the markup out of the range.
Who is the Composite Man in Wyckoff theory?
The Composite Man is a teaching device. Wyckoff asked traders to imagine all market activity as the campaign of one large operator who accumulates at low prices, marks price up, distributes at high prices and marks it down. Thinking this way helps traders interpret ranges and climaxes, though no single player actually controls the market.
Is Wyckoff the same as smart money concepts?
They overlap heavily. Smart money concepts popularised terms like liquidity sweeps and order blocks, but the underlying idea of large players trapping retail traders before a move is central to Wyckoff’s springs and upthrusts. Wyckoff adds a structured phase model and a strong emphasis on volume.
Conclusion
The Wyckoff method in forex gives you a map for trading ranges: identify the prior trend, mark the range, wait for the spring or upthrust in Phase C, and enter on a low-volume test with a stop beyond the false break. It works best where real volume exists, such as NSE currency futures and MCX metals, and it never removes the need for disciplined sizing. As the Gold Mini example shows, a textbook setup can still be too large for your account. Before you place any Wyckoff trade, convert your stop distance into lots with our position size calculator.