Introduction
Moving averages are among the first indicators most traders learn, and for good reason. They smooth out price noise and show the direction of the trend at a glance. When two moving averages of different lengths cross, the crossover can signal that momentum is shifting. That simple idea is the basis of the EMA crossover strategy.
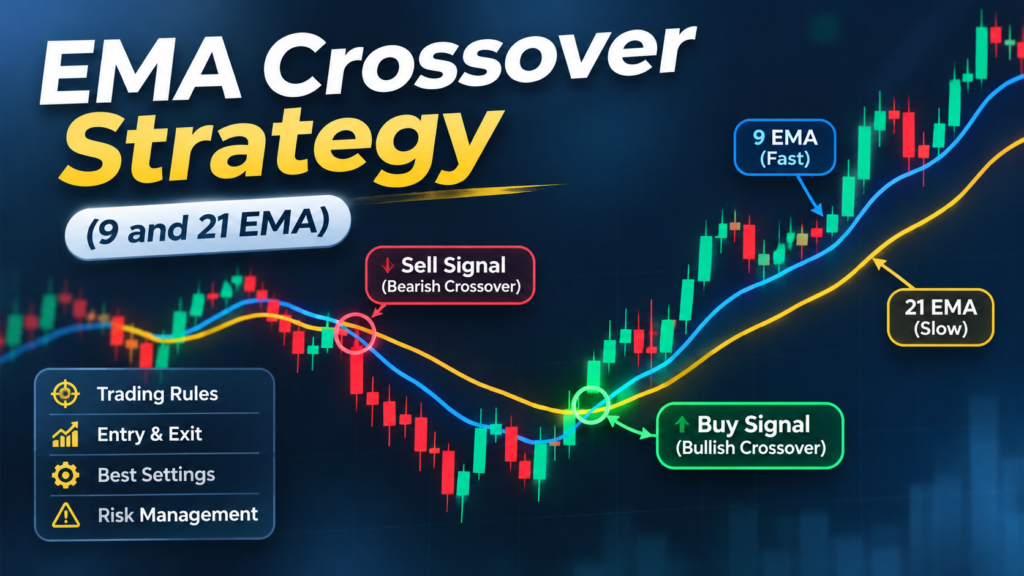
One of the most popular versions uses the 9-period and 21-period exponential moving averages (EMAs). The 9 EMA reacts quickly to price, while the 21 EMA moves more slowly. When the fast line crosses above the slow line, it suggests bullish momentum; when it crosses below, it suggests bearish momentum.
This guide explains how the 9 and 21 EMA crossover strategy works, how EMAs are calculated, entry and exit rules, filters that reduce false signals, the best timeframes, a worked example, backtesting tips and the most common mistakes.
What Is an Exponential Moving Average?
A moving average shows the average closing price over a set number of periods. A simple moving average (SMA) gives every period equal weight. An exponential moving average (EMA) gives more weight to recent prices, so it reacts faster to new moves.
The EMA uses a smoothing multiplier:
- Multiplier = 2 ÷ (N + 1)
- EMA today = (Close today × Multiplier) + (EMA yesterday × (1 − Multiplier))
For a 9 EMA, the multiplier is 2 ÷ 10 = 0.20, so the latest close carries 20% of the weight. For a 21 EMA, it is 2 ÷ 22 ≈ 0.091, or about 9%. That is why the 9 EMA hugs price closely, while the 21 EMA follows more slowly.
What Is an EMA Crossover Strategy?
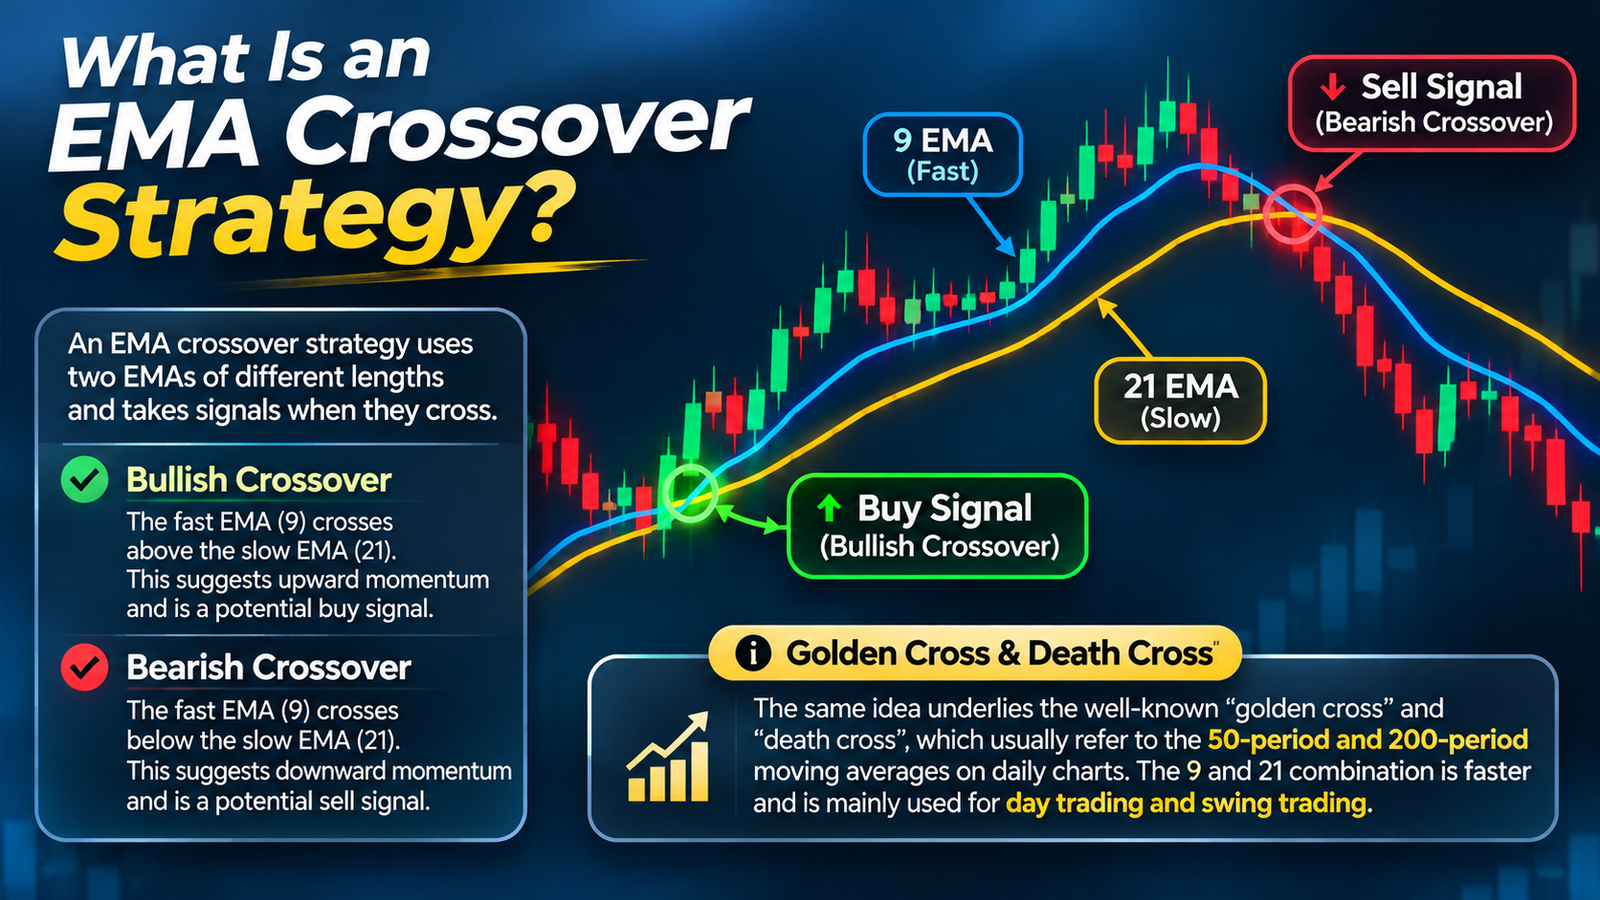
An EMA crossover strategy uses two EMAs of different lengths and takes signals when they cross:
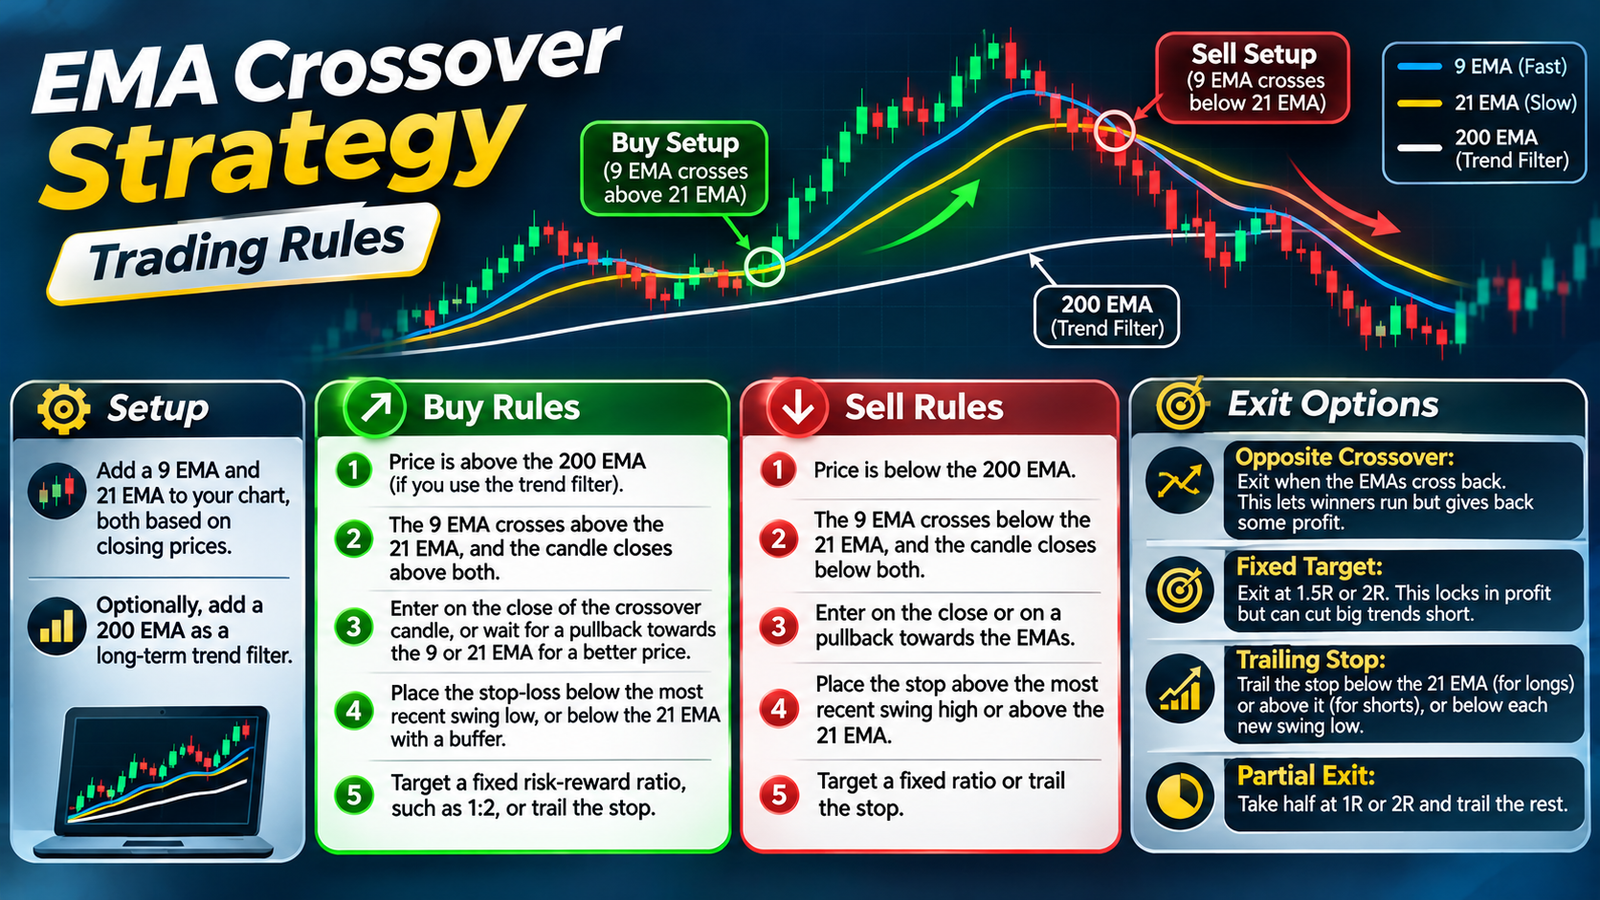
- Bullish crossover: the fast EMA (9) crosses above the slow EMA (21). This suggests upward momentum and is a potential buy signal.
- Bearish crossover: the fast EMA (9) crosses below the slow EMA (21). This suggests downward momentum and is a potential sell signal.
The same idea underlies the well-known “golden cross” and “death cross”, which usually refer to the 50-period and 200-period moving averages on daily charts. The 9 and 21 combination is faster and is mainly used for day trading and swing trading.
 Why the 9 and 21 EMA?
- Balanced speed: The 9 EMA tracks short-term momentum, while the 21 EMA represents roughly a month of trading days on a daily chart, or about a trading day’s worth of hours on a 1-hour chart.
- Widely used: Many traders watch these levels, so price often reacts around them.
- Works across timeframes: The pair can be used from the 5-minute chart to the daily chart.
- Dynamic support and resistance: In trends, price often pulls back to the 21 EMA before continuing.
EMA Crossover Strategy Rules
Setup
- Add a 9 EMA and a 21 EMA to your chart, both based on closing prices.
- Optionally, add a 200 EMA as a long-term trend filter.
Buy rules
- Price is above the 200 EMA (if you use the trend filter).
- The 9 EMA crosses above the 21 EMA, and the candle closes above both.
- Enter on the close of the crossover candle, or wait for a pullback towards the 9 or 21 EMA for a better price.
- Place the stop-loss below the most recent swing low, or below the 21 EMA with a buffer.
- Target a fixed risk-reward ratio, such as 1:2, or trail the stop.
Sell rules
- Price is below the 200 EMA.
- The 9 EMA crosses below the 21 EMA, and the candle closes below both.
- Enter on the close or on a pullback towards the EMAs.
- Place the stop above the most recent swing high or above the 21 EMA.
- Target a fixed ratio or trail the stop.
Exit options
- Opposite crossover: Exit when the EMAs cross back. This lets winners run but gives back some profit.
- Fixed target: Exit at 1.5R or 2R. This locks in profit but can cut big trends short.
- Trailing stop: Trail the stop below the 21 EMA (for longs) or above it (for shorts), or below each new swing low.
- Partial exit: Take half at 1R or 2R and trail the rest.
 EMA Crossover Strategy Filters to Reduce False Signals
The biggest weakness of any EMA crossover strategy is whipsaws: in sideways markets, the EMAs cross back and forth, producing a string of small losses. These filters help:
- 200 EMA trend filter: Only buy above it and only sell below it.
- ADX: Take signals only when ADX is above about 20–25, indicating a trending market.
- EMA separation: Skip crosses where the two EMAs are flat and tangled together.
- Higher-timeframe agreement: Take 1-hour signals only when the 4-hour or daily chart shows the same direction.
- Candle close confirmation: Wait for the candle to close after the cross; intrabar crosses can reverse.
- Session timing: For forex, focus on active sessions. In IST during winter, the London session starts at 1:30pm and the London–New York overlap runs from 6:30pm to 10:30pm.
- News check: Avoid entries just before major releases, such as US jobs and inflation data at 7:00pm IST in winter.
Best Timeframes for the EMA Crossover Strategy
| Timeframe | Style | Notes |
|---|---|---|
| 5-minute and 15-minute | Scalping and intraday | Many signals, more whipsaws and higher relative costs |
| 1-hour | Day trading and short swings | A good balance for most forex traders |
| 4-hour | Swing trading | Fewer, cleaner signals; wider stops |
| Daily | Position and swing trading | Strong trend signals but slow and infrequent |
Many traders get the best results by finding the trend on a higher timeframe and using the EMA crossover strategy on a lower one for entries.
Worked Example: 9 and 21 EMA Crossover on GBP/USD
This example is illustrative and uses hypothetical prices.
On the GBP/USD 1-hour chart, price is above the 200 EMA, and the daily trend is up. After a pullback, the 9 EMA crosses above the 21 EMA at around 1.3080 during the London session, and the candle closes at 1.3092.
Rather than chasing, the trader waits for a small pullback. Price dips back to the 9 EMA, and a bullish candle forms.
- Entry: Buy at 1.3085.
- Stop-loss: 1.3055, below the recent swing low (30 pips).
- Target: 1.3145, a 1:2 risk-reward ratio (60 pips).
- Position size: With a 10,000accountrisking1%(100) and $10 per pip per standard lot, 30 pips risks $300 per lot, so the trader buys about 0.33 lots.
Price trends higher through the New York session and reaches 1.3145, for a profit of about $200 before costs. If the trader had instead used the opposite-crossover exit, the trade might have stayed open longer, capturing more of the trend or giving back some profit, depending on how the move developed.
What a Typical Sequence of Trades Looks Like
This sequence is illustrative.
Crossover systems usually win less than half the time, but their winners can be much larger than their losers. Consider five trades taken with a 1R risk each:
| Trade | Market condition | Result |
|---|---|---|
| 1 | Choppy range, quick reversal | −1R |
| 2 | Choppy range | −1R |
| 3 | Weak trend | +0.5R |
| 4 | False breakout | −1R |
| 5 | Strong trend | +4R |
Only two of five trades were winners, yet the total is +1.5R. This is why the EMA crossover strategy rewards patience and consistent risk: the small losses are the cost of being in position for the big trends.
Popular EMA Crossover Strategy Variations
- 8 and 21 EMA: Very similar to the 9 and 21, used by many swing traders.
- 12 and 26 EMA: The same lengths used in the MACD indicator.
- 20 and 50 EMA: Slower, with fewer signals, suited to swing trading.
- 50 and 200 EMA: The classic golden cross and death cross for long-term trends.
- Triple EMA (9, 21 and 55): Trades only when all three EMAs are stacked in order, which filters out weak trends.
EMA vs SMA Crossovers
An SMA crossover reacts more slowly and produces fewer signals, but enters later. An EMA crossover strategy reacts faster, entering trends earlier but producing more false signals. Many short-term traders prefer EMAs for speed, while long-term investors often use SMAs.
How to Backtest an EMA Crossover Strategy
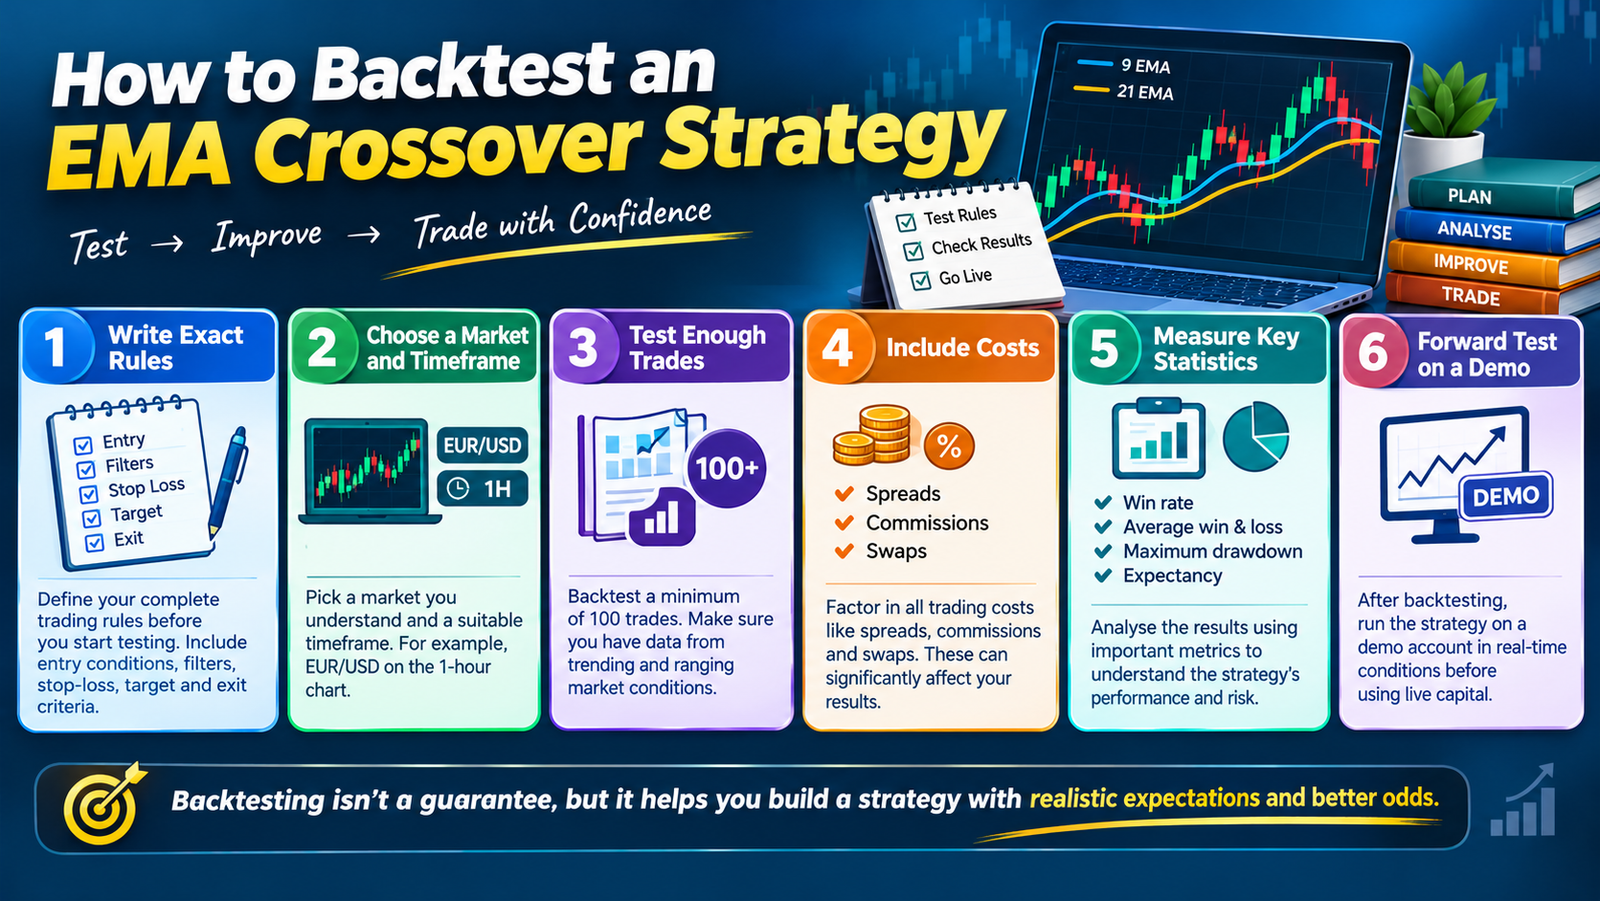
- Write exact rules: entry, filters, stop, target and exit.
- Choose a market and timeframe: for example, EUR/USD on the 1-hour chart.
- Test enough trades: at least 100, across trending and ranging periods.
- Include costs: spreads, commissions and swaps.
- Measure key statistics: win rate, average win and loss, maximum drawdown and expectancy.
- Avoid over-optimising: settings that work perfectly on past data often fail in live trading.
- Forward test on a demo account before going live.
 Risk Management for an EMA Crossover Strategy
- Risk 0.5% to 1% per trade.
- Expect losing streaks of five or more trades in ranging markets.
- Set a daily or weekly loss limit.
- Avoid correlated trades, such as buying EUR/USD and GBP/USD on the same signal.
- Keep a journal of every signal, including the ones you skip.
Common EMA Crossover Strategy Mistakes
- Trading every crossover: Without filters, sideways markets produce constant whipsaws.
- Entering before the candle closes: Intrabar crosses often reverse.
- Chasing late entries: Entering far from the EMAs gives poor risk-reward.
- Using stops that are too tight: Normal noise can stop you out before the trend develops.
- Changing settings after a few losses: Give the system enough trades to judge it.
- Ignoring the higher timeframe: Counter-trend crosses fail more often.
A Note for Indian Traders
The 9 and 21 EMA crossover works on any liquid market, including NSE currency futures on USD/INR, EUR/INR, GBP/INR and JPY/INR, as well as Nifty, Bank Nifty and stocks. Indian residents should note that leveraged forex trading on offshore platforms is not permitted under the Foreign Exchange Management Act (FEMA), and the RBI publishes an Alert List of unauthorised platforms. The legal route is exchange-traded derivatives on NSE and BSE through SEBI-registered brokers. Rupee pairs trade from 9:00am to 5:00pm IST and tend to move more slowly, so many traders apply the strategy on the 1-hour or daily chart for these pairs.
EMA Crossover Strategy Checklist
- Is the higher-timeframe trend in my direction?
- Is price on the correct side of the 200 EMA?
- Are the EMAs separating, not tangled and flat?
- Has the crossover candle closed?
- Is it an active session, with no major news due?
- Is my stop below the swing low or above the swing high?
- Is my risk 1% or less, with a clear exit plan?
FAQs
What is the 9 and 21 EMA crossover strategy?
It is a trend-following method that buys when the 9 EMA crosses above the 21 EMA and sells when it crosses below, usually with filters to avoid false signals.
Which timeframe is best for an EMA crossover strategy?
The 1-hour and 4-hour charts are popular for forex. Lower timeframes give more signals but more whipsaws.
How do I avoid false crossover signals?
Use a 200 EMA trend filter, ADX, higher-timeframe confirmation and candle-close confirmation, and avoid trading during flat, choppy markets.
Is the EMA crossover strategy profitable?
It can be in trending markets, but it typically has a win rate below 50% and depends on larger winners covering frequent small losses. Backtest it before trading live.
What is the difference between an EMA crossover and a golden cross?
A golden cross usually refers to the 50 and 200-period averages crossing on a daily chart. The 9 and 21 EMA crossover is a faster version for shorter-term trading.
Conclusion
The 9 and 21 EMA crossover strategy is simple, objective and easy to apply on almost any chart. The fast EMA shows short-term momentum, the slow EMA shows the underlying trend, and their crossovers signal when momentum may be shifting.
Its weakness is choppy markets, so filters such as the 200 EMA, ADX and higher-timeframe confirmation are essential. Combine the EMA crossover strategy with sound stops, consistent position sizing and patience through losing streaks, and backtest it thoroughly before trading with real money.