
Quick answer: An economic calendar lists scheduled data releases and central bank decisions, with the time, country, expected impact and three numbers: Actual (the new figure), Forecast (what economists expected) and Previous (last period’s figure). To read it, focus on high-impact events for the currencies you trade, convert times to IST, and compare Actual with Forecast. Markets move on the surprise, not on whether the number is “good” or “bad.”
In September 2026, the US jobs report showed 162,000 new jobs against a forecast of about 53,000. Less than two weeks later, the Federal Reserve raised interest rates for the first time since 2023. The rupee then hit a record low near ₹96 per dollar. A trader who had those dates marked on a calendar knew when the risk was coming, even without knowing the result.
This guide explains every column, lists the events that matter most for Indian traders with IST timings, shows how markets react to surprises, and gives a simple weekly routine.
Anatomy of an economic calendar row
Most calendars (on broker platforms and financial websites) show the same columns.
| Column | What it means | What to watch for |
|---|---|---|
| Date / Time | When the data is released | Set your calendar to IST; many sites default to US or GMT time |
| Currency / Country | Which economy it covers | USD and INR events matter most for USD/INR and Nifty |
| Event | The data or decision | Learn the handful of events that move your market |
| Impact | Low / medium / high (often 1–3 icons) | Plan around high-impact events |
| Actual | The figure just released | Filled in at release time |
| Forecast (consensus) | The median economist estimate | This is the market’s expectation |
| Previous | Last period’s figure, sometimes revised | A revised Previous can matter as much as the new figure |
A real row, read step by step
| Date (IST) | Currency | Event | Impact | Actual | Forecast | Previous |
|---|---|---|---|---|---|---|
| 4 Sep 2026, 6:00 pm | USD | Nonfarm Payrolls (August) | High | +162,000 | about +53,000 | −23,000, revised to +21,000 |
- Time: 8:30 am US Eastern Time is 6:00 pm IST during US daylight saving time.
- Surprise: Actual minus Forecast = 162,000 − 53,000 = +109,000, a very large beat.
- Revision: July was revised from −23,000 to +21,000, which is also stronger than first reported.
- Read: a stronger US labour market makes a Fed rate hike more likely, which usually supports the dollar.
- What followed: the Fed raised rates by 25 basis points on 16 September.
Measuring the surprise
Surprise = Actual − Forecast
Surprise % = (Actual − Forecast) ÷ |Forecast| × 100
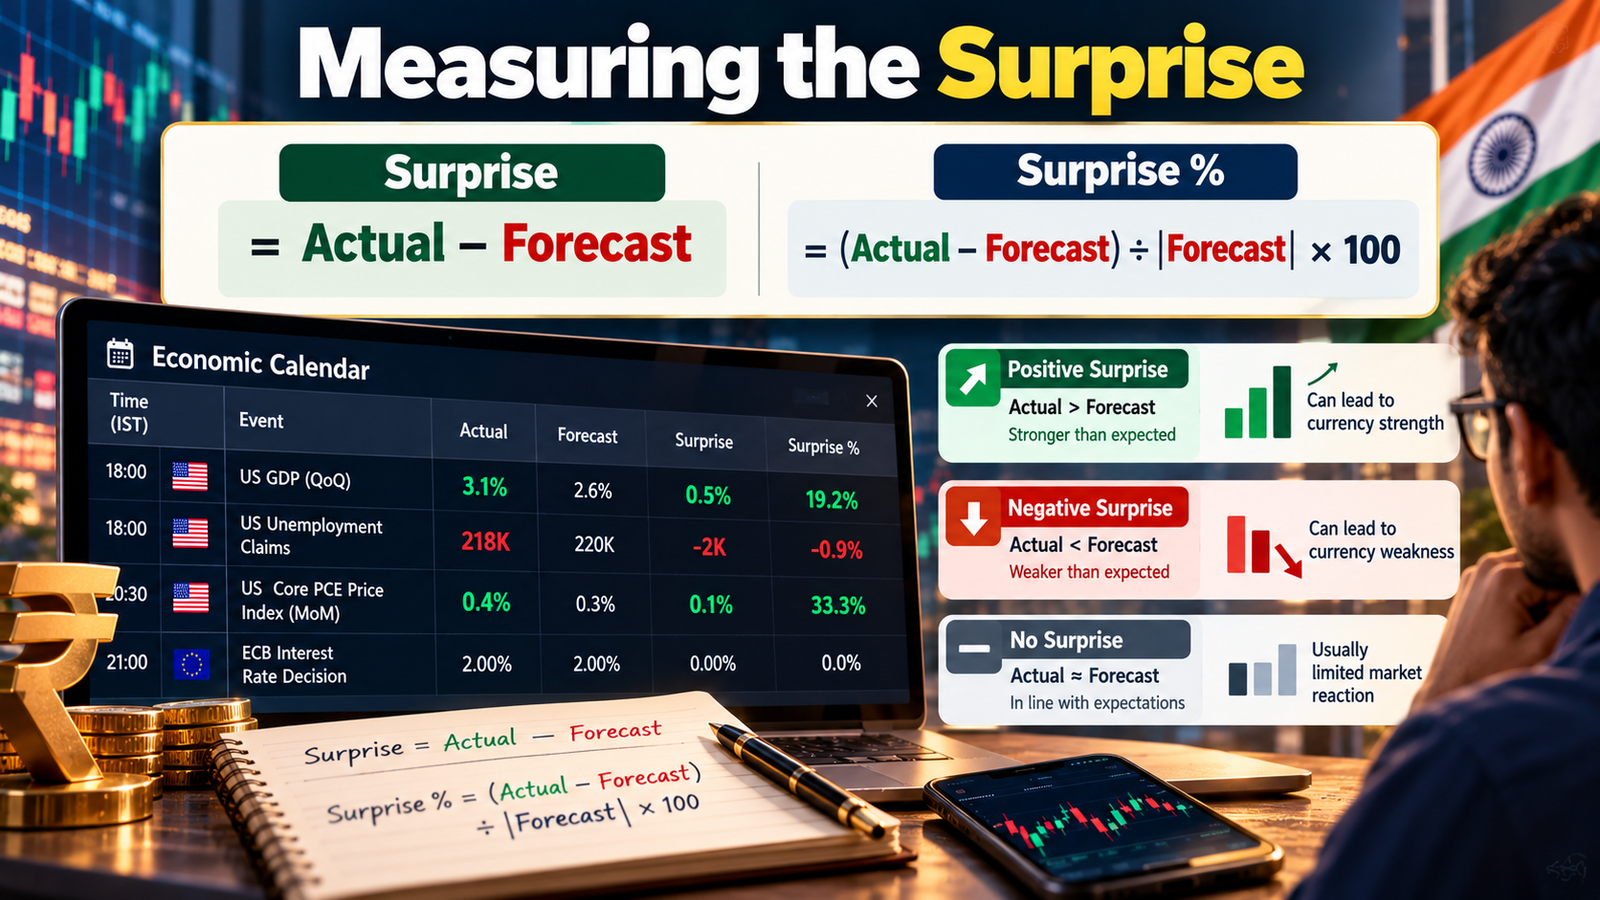
For inflation or interest rates, surprises are usually small in absolute terms. A 0.1–0.2 percentage point miss on CPI can still move markets sharply.
Impact labels are a guide, not a rule
Impact ratings come from the calendar provider. A “medium” event can move markets heavily if the economy is at a turning point, and a “high” event can pass quietly if the result matches expectations.
The events that matter most for Indian traders
Indian events
| Event | Released by | Usual timing (IST) | Why it matters |
|---|---|---|---|
| RBI monetary policy decision | RBI Monetary Policy Committee | 10:00 am on the last day of the meeting, six times a year | Repo rate and guidance move the rupee, bonds and bank stocks |
| CPI inflation | MoSPI | 4:00 pm on the 12th of each month | Main input for RBI rate decisions |
| IIP (industrial output) | MoSPI | 4:00 pm on the 12th of each month | Growth signal |
| GDP (quarterly) | MoSPI | Around the end of the second month after each quarter, usually 4:00 pm | Growth trend |
| Balance of payments / current account | RBI | Quarterly | Dollar demand and supply |
| Forex reserves | RBI | Weekly, Friday evening | RBI’s capacity to support the rupee |
| FPI flows | NSDL | Daily | Foreign money in and out of Indian markets |
Global events
| Event | Released by | Usual timing (IST)* | Why it matters |
|---|---|---|---|
| FOMC rate decision | US Federal Reserve | 11:30 pm (12:30 am after US clocks change), eight times a year | Biggest driver of the dollar worldwide |
| Nonfarm payrolls (jobs report) | US Bureau of Labor Statistics | 6:00 pm (7:00 pm), usually the first Friday of the month | Shapes Fed expectations |
| US CPI | US Bureau of Labor Statistics | 6:00 pm (7:00 pm), mid-month | Shapes Fed expectations |
| ECB rate decision | European Central Bank | Around 5:45 pm (6:45 pm) | Moves EUR/USD and EUR/INR |
| Crude oil inventories | US Energy Information Administration | 8:00 pm (9:00 pm), Wednesdays | Oil prices matter for the rupee |
*Times in brackets apply when US or European clocks go back. In 2026 US daylight saving time ends on 1 November, so US releases move one hour later in IST.
Key dates coming up (as of 24 September 2026)
| Date | Event | Why it matters |
|---|---|---|
| 7 October 2026 | RBI policy decision (meeting 5–7 October) | First RBI decision since the Fed’s hike and August’s 4.82% CPI reading |
| Early October | US jobs report for September | Follows August’s big upside surprise |
| 12 October 2026 | India CPI for September | Will show whether inflation keeps rising |
| 28 October 2026 | FOMC decision (meeting 27–28 October) | Next Fed step after the September hike |
| 4 December 2026 | RBI policy decision (meeting 2–4 December) | Last RBI decision of 2026 |
| 9 December 2026 | FOMC decision (meeting 8–9 December), with new economic projections | Updated Fed rate projections (the “dot plot”) |
Check official sites a few days ahead, as dates can shift for holidays.
How markets react: it’s the surprise that counts
Prices move before the release because traders position for the expected result. When the news arrives, the market mostly reacts to the gap between Actual and Forecast.
| Result vs forecast | Typical first reaction for that currency | Why |
|---|---|---|
| Inflation higher than expected | Currency tends to rise | Rate hikes become more likely |
| Inflation lower than expected | Currency tends to fall | Rate cuts become more likely |
| Jobs or growth stronger than expected | Currency tends to rise | Economy can handle higher rates |
| Jobs or growth weaker than expected | Currency tends to fall | Rate cuts become more likely |
| Rate decision as expected | Moves depend on the statement and guidance | The decision was already priced in |
| Surprise rate change | Large, fast moves | Markets had positioned for something else |
These are tendencies, not rules. The first move can reverse within minutes if the details (revisions, core figures, the central bank’s statement) tell a different story.
Recent examples (2026)
| Event | Forecast | Actual | Surprise | What happened |
|---|---|---|---|---|
| US nonfarm payrolls, August (released 4 Sep) | about +53,000 | +162,000; July revised up from −23,000 to +21,000 | Big upside surprise | Strengthened the case for tighter Fed policy; the Fed hiked on 16 Sep |
| India CPI, August (released 14 Sep) | about 4.8% (economist poll) | 4.82%, up from 4.44% in July | Roughly in line | Little surprise, but the rising trend raised doubts about RBI rate cuts |
| RBI decision, 5 Aug | Hold expected | Repo rate held at 5.25%; growth forecast raised to 6.7%, inflation forecast cut to 5.0% | Decision in line; outlook slightly upbeat | The rupee strengthened 39 paise to about ₹94.89 per dollar |
| Fed decision, 16 Sep | Not verified here | Raised 25 bp to 3.75%–4.00%, first hike since 2023 | — | Along with oil and FPI outflows, added pressure that pushed the rupee to a record low near ₹96 |
The August CPI release came on 14 September rather than the usual 12th, which fell on a weekend. That’s a good reminder to check the exact date each month.
What happens to spreads and liquidity around releases
In the seconds around a big release, liquidity providers pull or widen their quotes. You can see:
- Wider bid-ask spreads, often several times normal.
- Slippage on market and stop orders.
- Price gaps, where price jumps over levels without trading at them.
- Whipsaws, where price spikes one way and then reverses sharply.
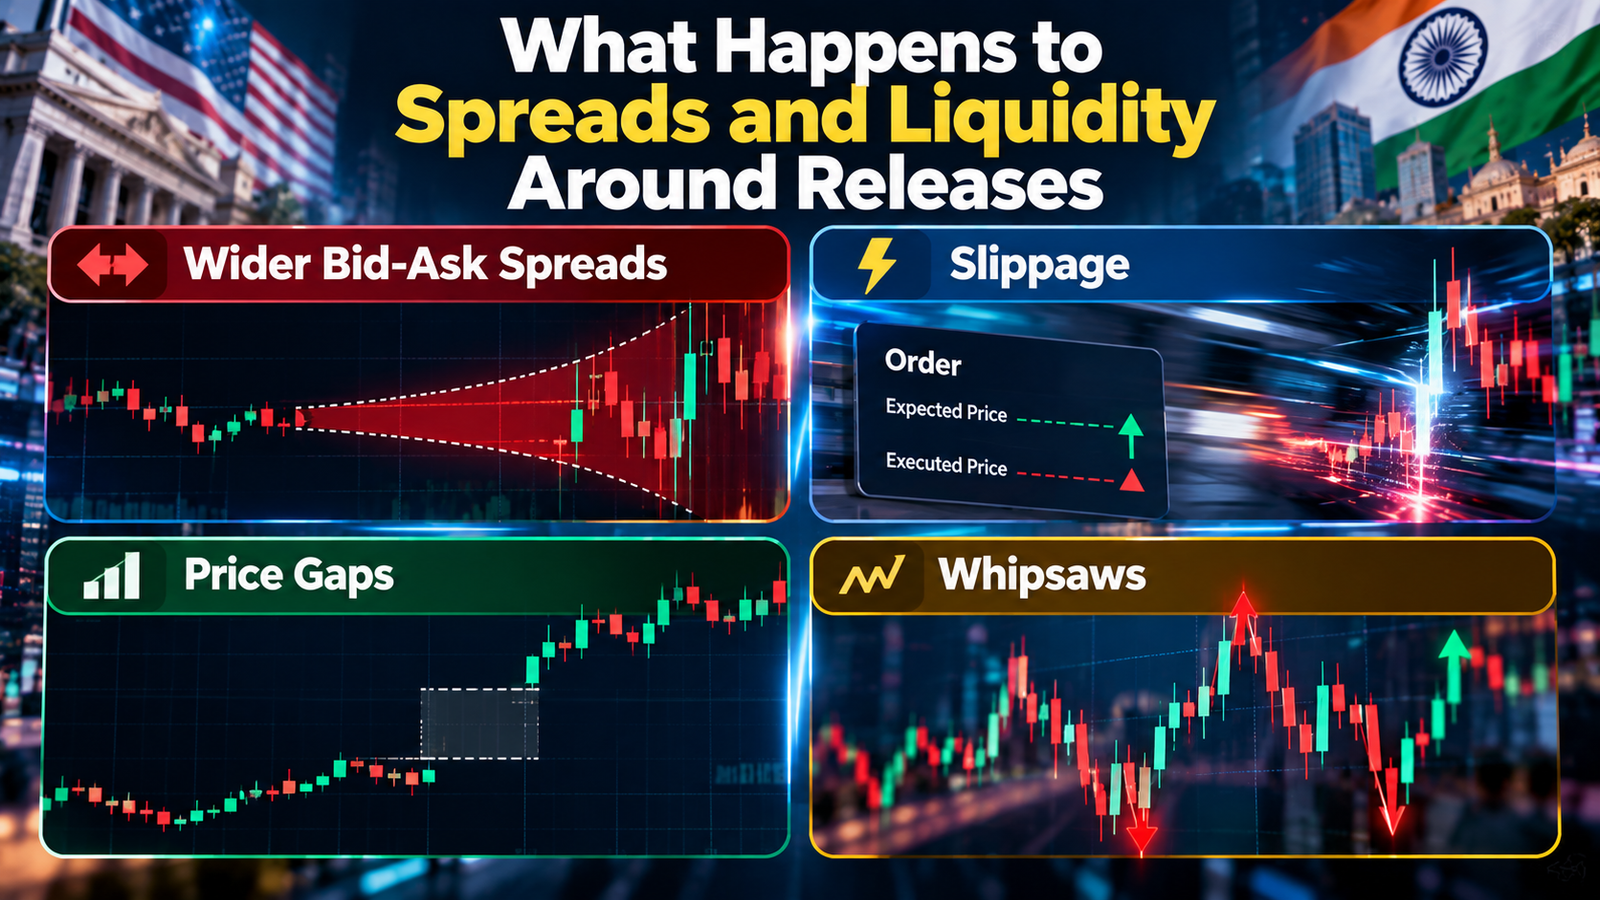
For rupee futures on NSE, which have had thinner order books since 2024, these effects can be larger.
A simple weekly routine
Sunday: plan the week (15 minutes)
- Open your calendar, set the time zone to IST, and filter for high impact plus the currencies you trade (usually INR and USD, plus EUR if you trade EUR/INR).
- Write down each event’s date, IST time, forecast and previous figure.
- Mark “no new trades” windows around each high-impact event.
- Note any open positions that will be held through an event, and decide whether to reduce them.
On event day
| When | What to do |
|---|---|
| 30 minutes before | Don’t open new trades; check spreads and open positions |
| At release | Read Actual vs Forecast and any revision to Previous |
| First 5–15 minutes | Let spreads settle; avoid market orders |
| After the first move | Check whether price holds beyond key levels or reverses |
| End of day | Note the surprise and the market’s reaction in your journal |
Risk rules around events
Rule 1: Expect wider spreads and slippage.
An illustrative USD/INR futures example: in quiet conditions a 10-lot stop might fill 1 tick away; around a big release it might fill 6 ticks away.
- Normal slippage: 1 × ₹2.50 × 10 = ₹25
- News slippage: 6 × ₹2.50 × 10 = ₹150
For Nifty futures, 20 points of slippage on one lot of 65 is 20 × 65 = ₹1,300.
Rule 2: If you must hold through an event, cut size.
Lots = risk budget ÷ (planned stop + expected slippage) per lot.
Example: ₹1,000 risk budget, planned USD/INR stop of 40 ticks (₹100 per lot), plus 20 ticks of possible news slippage (₹50 per lot). That gives ₹1,000 ÷ ₹150 = 6 lots instead of 10.
Rule 3: Never place a stop exactly at an obvious level just before news. Spikes often run through obvious highs, lows and round numbers.
Rule 4: Don’t trade the headline alone. Read the whole release: core figures, revisions and the central bank’s statement.
Pre-event checklist
- I know the exact IST time of every high-impact event this week.
- I know the forecast and previous figure.
- I have no new orders in the 30 minutes before release.
- Any position held through the event is sized for extra slippage.
- My stops are not sitting exactly at obvious levels.
- I will wait for spreads to normalise before acting.
Learn more about Types of Forex Analysis
Expert analysis
Fact: the US added 162,000 jobs in August 2026 against a forecast of about 53,000. The Fed then raised rates by 25 basis points on 16 September, its first hike since 2023.
Fact: MoSPI releases India’s CPI and IIP at 4:00 pm IST on the 12th of each month, or the next working day. The RBI’s next policy decision is due on 7 October 2026.
Analysis: the calendar tells you when risk arrives, not which way prices will move. Its main value for beginners is defensive: knowing when spreads widen, when stops can slip, and when not to open new positions.
Analysis: for USD/INR, US events often matter as much as Indian ones. In September 2026, a strong US jobs report and a Fed hike pushed in the same direction as rising Indian inflation and foreign selling, which helped take the rupee to a record low.
Opinion: beginners should treat high-impact releases as “no new trade” windows for at least their first few months, and study the reactions in a journal instead of trading them.
Common mistakes
- Reading the calendar in the wrong time zone.
- Judging a number as “good” or “bad” without comparing it with the forecast.
- Ignoring revisions to previous figures.
- Placing market orders in the first seconds after a release.
- Holding full-size positions through major events.
- Treating a calendar’s impact label as a guarantee of a big move.
Myths vs facts
| Myth | Fact |
|---|---|
| A strong number always lifts the currency | Only if it beats expectations; an in-line strong number may already be priced in |
| High-impact events always cause big moves | In-line results can pass quietly |
| You can profit easily by trading the news | Spreads, slippage and whipsaws make news trading hard for retail traders |
| Only Indian data matters for the rupee | US jobs, CPI and Fed decisions often move USD/INR just as much |
| The calendar forecast is always accurate | It is a median estimate; surprises happen regularly |
Key takeaways
- An economic calendar shows the time, country, impact, and Actual, Forecast and Previous figures for scheduled events.
- Markets react mainly to the surprise: Actual minus Forecast.
- Revisions to Previous can matter as much as the new figure.
- Key Indian events: RBI decisions (10:00 am) and CPI/IIP (4:00 pm on the 12th).
- Key US events: nonfarm payrolls and CPI (6:00 pm IST, 7:00 pm after 1 November) and FOMC (11:30 pm IST, 12:30 am after 1 November).
- Next big dates: RBI on 7 October and the Fed on 28 October 2026.
- Around releases: no new trades 30 minutes before, smaller size, stops away from obvious levels.
FAQs
1. What is an economic calendar?
It is a schedule of upcoming economic data releases and central bank decisions, showing the time, country, expected impact and the Actual, Forecast and Previous figures.
2. What do Actual, Forecast and Previous mean?
Actual is the newly released figure, Forecast is the median economist expectation, and Previous is the last period’s figure, which may have been revised.
3. Why does the market react to the forecast rather than the number?
Prices already reflect expectations before the release. Only the surprise, Actual minus Forecast, is new information.
4. What is a high-impact event?
It is a release the calendar provider expects to move markets strongly, such as central bank decisions, CPI and US jobs reports.
5. What time are US jobs and CPI data released in IST?
At 8:30 am US Eastern Time, which is 6:00 pm IST during US daylight saving time and 7:00 pm IST after US clocks go back on 1 November 2026.
6. What time is the Fed decision in IST?
At 2:00 pm US Eastern Time, which is 11:30 pm IST during US daylight saving time and 12:30 am IST (the next day) afterwards.
7. When is India’s CPI data released?
MoSPI releases CPI at 4:00 pm IST on the 12th of each month, or the next working day if the 12th falls on a holiday or weekend.
8. When is the next RBI policy decision?
The Monetary Policy Committee meets 5–7 October 2026, with the decision on 7 October. The following decision is on 4 December 2026.
9. When is the next Fed meeting?
27–28 October 2026, then 8–9 December 2026, which includes updated economic projections.
10. Which economic events move the rupee most?
RBI policy decisions, India’s CPI, US jobs and CPI data, Fed decisions, oil prices and foreign investor flows.
11. Should beginners trade during news releases?
Most beginners are better off avoiding new trades around high-impact releases because spreads widen, stops can slip and prices can whipsaw.
12. What is a revision in economic data?
It is a change to a previously published figure as more complete data arrives. For example, US July 2026 payrolls were revised from −23,000 to +21,000.
13. How do I set an economic calendar to IST?
Most calendar websites and broker platforms have a time-zone setting. Choose GMT+5:30 or Asia/Kolkata.
14. Is the calendar forecast reliable?
It is the median of economist estimates. It is useful as a benchmark, but large surprises happen regularly.
15. Why do spreads widen during news?
Liquidity providers pull or widen their quotes to protect themselves from sudden price jumps, so trading costs rise for a short time.
16. Does an economic calendar help with Nifty trading too?
Yes. RBI decisions, India’s CPI and GDP, US Fed decisions and US inflation data can all move Nifty and bank stocks.