
Quick answer: There are three main types of forex analysis. Fundamental analysis studies the economic forces behind a currency: interest rates, inflation, growth, trade balances and capital flows. Technical analysis studies price charts to find trends, levels and timing. Sentiment analysis measures how other traders and investors are positioned and feeling. Fundamentals help explain why a currency might move, technicals help decide when and where, and sentiment shows how crowded a view already is. Most successful approaches combine them.
September 2026 is a good example of all three at work. The US Federal Reserve raised rates on 16 September for the first time since 2023. Foreign investors pulled money out of Indian shares. The rupee hit a record low and briefly crossed 96 to the dollar. Each type of analysis captures a different part of that story.
| Fundamental | Technical | Sentiment | |
|---|---|---|---|
| Core question | What is the currency worth, and where are rates and flows heading? | What is price doing, and where are the key levels? | How are other participants positioned and feeling? |
| Main inputs | Interest rates, inflation, GDP, trade and current account, capital flows, central bank policy | Price, trend lines, support/resistance, moving averages, RSI, volume | Positioning reports, investor flows, volatility indices, risk-on/risk-off moves, news tone |
| Typical timeframe | Weeks to years | Minutes to months | Days to weeks |
| Best at | Direction and big trends | Entries, exits, stop-loss levels | Spotting crowded trades and turning points |
| Weak spot | Poor at timing; markets can ignore fundamentals for months | Patterns can fail; easy to see what you want | Hard to measure; extremes can last longer than expected |
| Key Indian sources | RBI, MoSPI, Ministry of Commerce | NSE charts and market depth | NSDL FPI data, India VIX |
Fundamental analysis
Definition: Fundamental analysis judges a currency by the health and policies of its economy, and by the flow of money into and out of the country.
The main drivers
| Driver | How it usually affects a currency | Where to find the data |
|---|---|---|
| Interest rates | Higher rates attract foreign capital and tend to support the currency | RBI MPC, US FOMC statements |
| Inflation | High inflation erodes value, unless the central bank responds with higher rates | MoSPI CPI (India), US BLS CPI |
| Economic growth | Strong growth attracts investment | GDP releases, PMIs |
| Current account | A deficit means the country needs foreign capital to fund it, which can weigh on the currency | RBI balance of payments data |
| Capital flows | Foreign buying of local shares and bonds supports the currency; selling weakens it | NSDL FPI data |
| Oil prices (India-specific) | India imports most of its crude, so higher oil raises dollar demand and weighs on the rupee | Brent crude prices |
| Central bank action | The RBI can sell dollars from reserves to slow rupee falls | RBI weekly reserves data |
USD/INR fundamentals right now (as of 24 September 2026)
| Indicator | Latest reading | Read-through for the rupee |
|---|---|---|
| RBI repo rate | 5.25%, unchanged on 5 August 2026; neutral stance | Rate support for the rupee has not increased |
| US federal funds rate | Raised 25 bp to 3.75%–4.00% on 16 September 2026, the first hike since 2023 | Higher US rates make dollar assets more attractive |
| Policy rate gap (RBI repo vs top of Fed range) | About 1.25 percentage points | A narrower gap reduces the rupee’s carry appeal |
| India CPI inflation | 4.82% in August 2026, up from 4.44% in July | Rising inflation limits room for RBI rate cuts |
| RBI FY27 forecasts (August) | GDP growth 6.7%; CPI inflation 5.0% | Growth outlook remains solid |
| Current account deficit | $4.2 billion (0.5% of GDP) in April–June 2026, vs $3.4 billion a year earlier | Modest deficit; the merchandise trade gap widened to $86.1 billion |
| Crude oil | Brent above $100 a barrel in September, per market reports | Raises India’s import bill and dollar demand |
Fundamental read (analysis): a Fed hike, a narrower rate gap, oil above $100 and a wider trade gap all point to a weaker rupee. That matches the record low near ₹95.9–96 per dollar in September. Solid growth and a still-small current account deficit limit how far the damage spreads.
The interest rate differential, simply
In currency futures, the gap between the two countries’ interest rates shows up as a forward premium. When Indian rates are higher than US rates, USD/INR futures for later months usually trade above spot. Roughly:
Futures price ≈ spot × (1 + Indian rate × t) ÷ (1 + US rate × t), where t is the time to expiry in years.
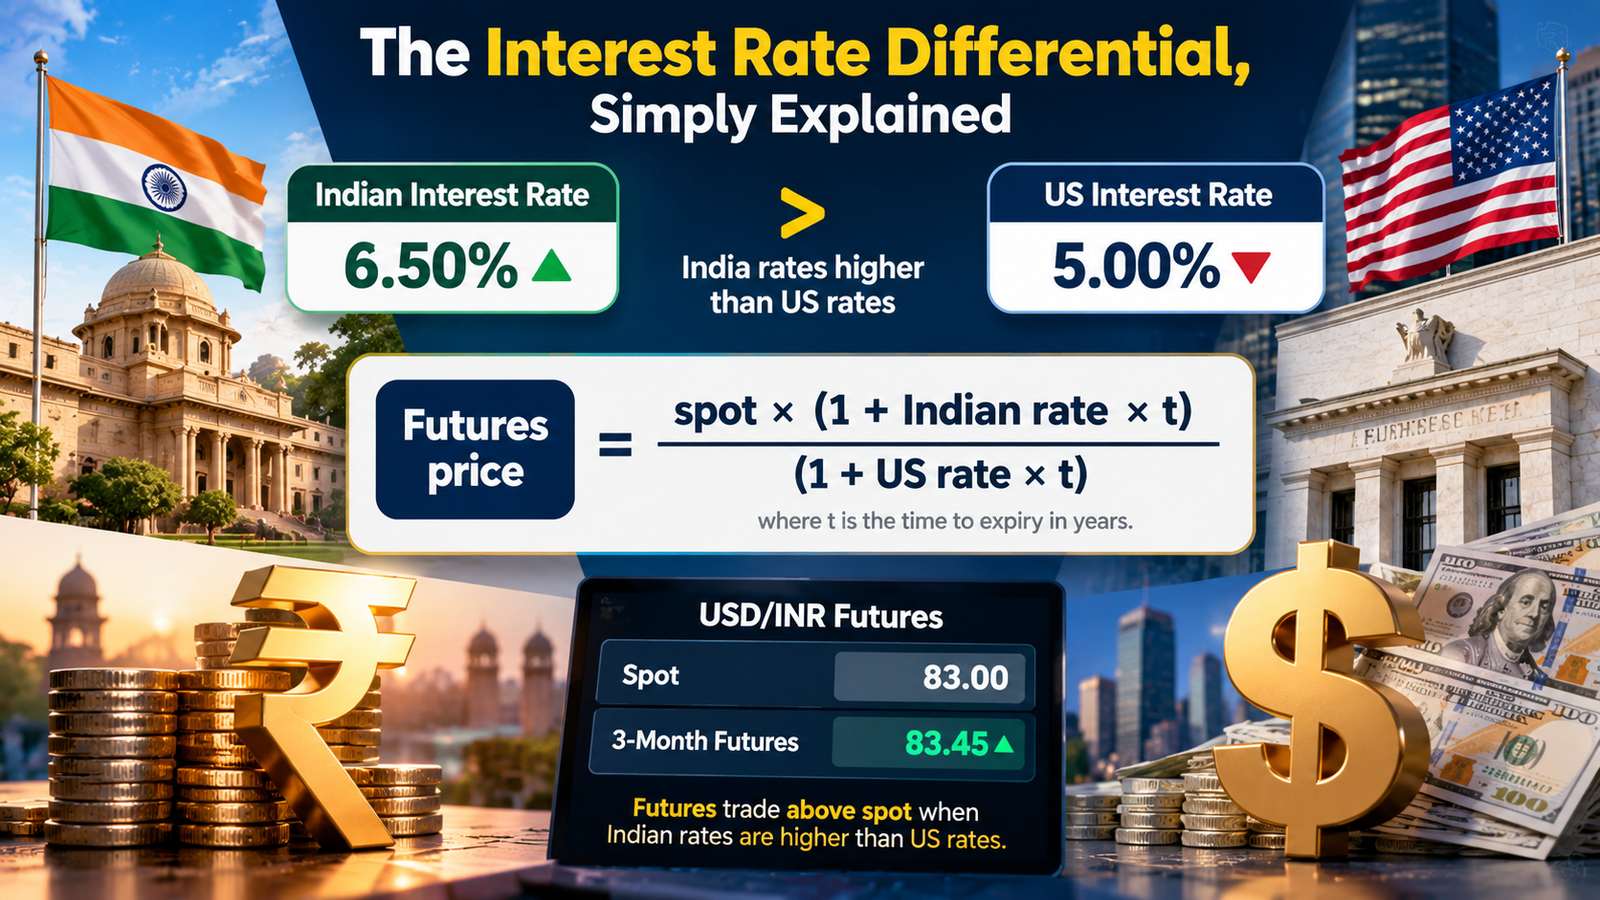
That is why the October USD/INR contract (₹95.89 on 23 September) traded above September (₹95.585). The premium is not a forecast that the rupee will fall. It reflects the interest rate gap.
Limits of fundamental analysis
Fundamentals are weak at short-term forecasting. A famous 1983 study by Meese and Rogoff found that standard economic models of exchange rates could not beat a simple “no change” (random walk) forecast out of sample over horizons up to a year. Later research has only partly softened this. Fundamentals tell you the pressure, not the timing.
Technical analysis
Definition: Technical analysis studies past prices, and sometimes volume, to identify trends, key levels and good times to enter or exit. It assumes that much of the known information is already in the price, and that crowd behaviour leaves repeating patterns.
Core tools
| Tool | What it shows | How beginners use it |
|---|---|---|
| Trend (higher highs/lows or lower highs/lows) | Direction | Trade with the trend on your timeframe |
| Support and resistance | Levels where price has turned before | Plan entries, targets and stops around them |
| Moving averages (SMA/EMA) | Smoothed trend | Price above a rising average suggests an uptrend |
| RSI (Relative Strength Index) | Momentum on a 0–100 scale | Above 70 = stretched up; below 30 = stretched down |
| ATR (Average True Range) | Typical price movement | Set stop-loss distance and position size |
| Equal highs/lows, round numbers | Where orders likely cluster | Avoid placing stops right at them |
Worked formulas (illustrative USD/INR daily closes)
Simple moving average (5-day):
Closes: 95.40, 95.52, 95.61, 95.58, 95.72
SMA = (95.40 + 95.52 + 95.61 + 95.58 + 95.72) ÷ 5 = 95.566
The latest close (95.72) is above the 5-day average, which points to short-term upward momentum in USD/INR (a weakening rupee).
RSI (14):
RSI = 100 − 100 ÷ (1 + RS), where RS = average gain ÷ average loss over 14 periods.
If the average daily gain is ₹0.060 and the average loss is ₹0.025: RS = 2.4, so RSI = 100 − 100 ÷ 3.4 ≈ 70.6. That is at the “overbought” line: the move is stretched, but a strong trend can stay above 70 for a long time.
ATR for stop placement:
If the 14-day ATR of USD/INR is ₹0.20 (80 ticks), a stop 1 × ATR away risks 80 × ₹2.50 = ₹200 per lot.
Strengths and limits
| Strengths | Limits |
|---|---|
| Works on any market and timeframe | Patterns fail often; hindsight makes them look better than they are |
| Gives precise entry, exit and stop levels | Ignores why price is moving |
| Data is free and instant | Many indicators lag price |
| Forces a clear plan | Easy to over-fit rules to past data |
What the evidence says
A review by Neely and Weller (Federal Reserve Bank of St. Louis) found that simple technical trading rules on dollar exchange rates delivered about 15 years of positive risk-adjusted returns in the 1970s and 1980s, “before those returns were extinguished.” More complex rules produced more modest returns afterwards. The authors link past profits to psychological biases and an “adaptive markets” view: edges exist for a time, then fade as more people use them.
Sentiment analysis
Definition: Sentiment analysis measures what other market participants think and how they are positioned. It asks whether a view is already crowded, because a crowded trade has fewer new buyers or sellers left to push it further.
Sentiment tools
| Tool | What it measures | How to use it |
|---|---|---|
| CFTC Commitments of Traders (COT) | Positions of large speculators and hedgers in US-listed currency futures | Look for extreme net long or short positions in major currencies |
| FPI flows (NSDL data) | Foreign investors buying or selling Indian shares and bonds | Sustained outflows usually mean more dollar demand and pressure on the rupee |
| India VIX | Expected Nifty volatility; India’s “fear gauge” | Spikes signal risk-off conditions that often coincide with rupee weakness |
| Risk-on / risk-off behaviour | Whether money is chasing risk (stocks, EM currencies) or safety (dollar, yen, gold) | EM currencies like the rupee tend to weaken in risk-off phases |
| CNN Fear & Greed Index | US stock market mood on a 0–100 scale | Global mood often spills into EM currency flows |
| News and social media tone | The dominant story in the market | Treat extreme one-sided headlines as a warning sign |
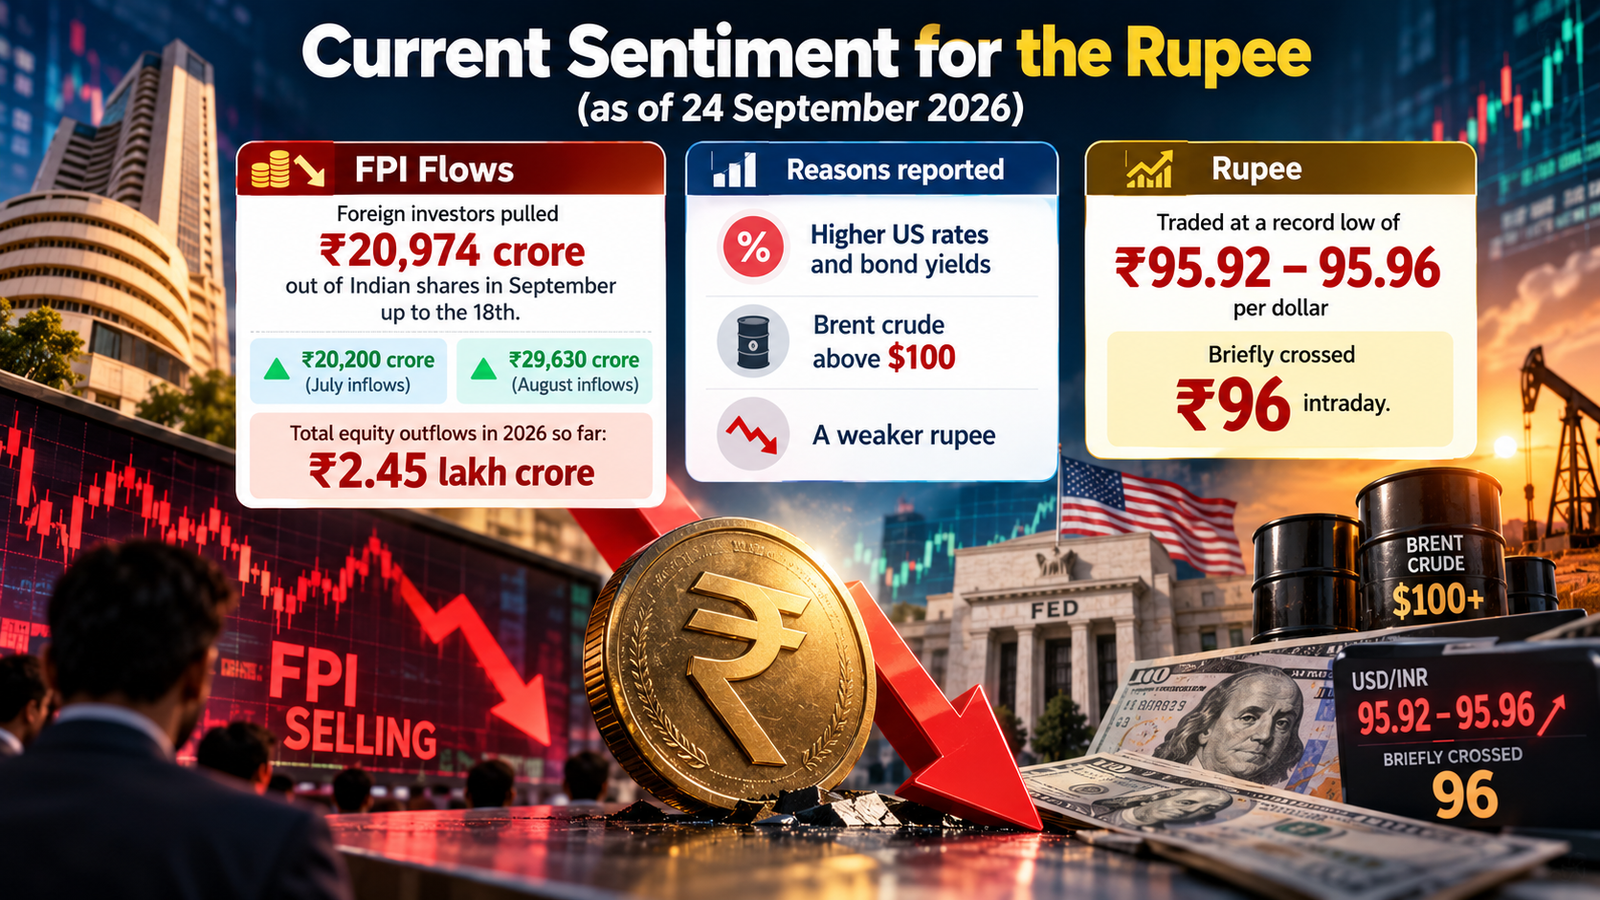
Current sentiment for the rupee (as of 24 September 2026)
- FPI flows: foreign investors pulled ₹20,974 crore out of Indian shares in September up to the 18th. That followed inflows of ₹20,200 crore in July and ₹29,630 crore in August. Total equity outflows in 2026 so far are about ₹2.45 lakh crore.
- Reasons reported: higher US rates and bond yields, Brent crude above $100, and a weaker rupee.
- Rupee: traded at a record low of ₹95.92–95.96 per dollar and briefly crossed 96 intraday.
Sentiment read (analysis): investors turned sharply negative on the rupee in September. For a contrarian, extreme pessimism can come before a bounce. But when fundamentals point the same way, as they do now with higher US rates and expensive oil, bearish sentiment can stay in place for weeks.
How to read the COT report
The CFTC publishes the COT report every Friday at 3:30 pm US Eastern Time, using positions as of the previous Tuesday. It covers US-listed futures such as the euro, yen and pound. It does not cover NSE rupee contracts, so for USD/INR, FPI flows are a more direct sentiment gauge.
Limits of sentiment analysis
- Sentiment is hard to measure, and every gauge is partial.
- Extremes can last longer than a trader’s capital.
- Data is often delayed: COT reports are three days old when published.
Combining all three: a 5-step framework
flowchart LR
A[1. Fundamentals<br/>set the bias] –> B[2. Sentiment<br/>checks crowding]
B –> C[3. Technicals<br/>find levels]
C –> D[4. Risk plan<br/>size and stop]
D –> E[5. Review<br/>after events]
- Fundamentals set the bias. Decide which way the economic pressure points over weeks or months.
- Sentiment checks crowding. If everyone already agrees, expect sharp pullbacks and use smaller size.
- Technicals find the levels. Use support, resistance and ATR to choose entries, stops and targets.
- Risk plan. Size the position so a stop-out costs no more than 1–2% of capital.
- Review after events. Update your view after RBI and Fed meetings, CPI data and big shifts in flows.
When the three disagree
| Fundamentals | Sentiment | Technicals | Sensible response |
|---|---|---|---|
| Bearish rupee | Moderately bearish | Uptrend in USD/INR | Strongest alignment; normal position size |
| Bearish rupee | Extremely bearish | Stretched (RSI above 70, at a round number) | Direction intact but crowded; smaller size or wait for a pullback |
| Bearish rupee | Bullish | Downtrend in USD/INR | Conflicting signals; stay out or hedge only what you must |
Worked example: an importer hedging a November payment (illustrative)
An importer must pay $20,000 in November and has a genuine exposure, so it can use NSE USD/INR futures to hedge.
- Fundamentals: the Fed hike, a narrower rate gap, oil above $100 and a wider trade gap point to rupee weakness.
- Sentiment: heavy September FPI selling; the market is already very bearish on the rupee.
- Technicals: USD/INR is testing the round number of ₹96, and daily RSI is near 70, so the move is stretched.
Decision: hedge half now and half on a pullback, rather than all at once at a crowded level.
| Step | Action | Lots | Price | Margin (about ₹2,293 per November lot) |
|---|---|---|---|---|
| Now | Buy November USD/INR futures | 10 | ₹96.1225 | ₹22,930 |
| Plan | Buy the rest on a pullback to about ₹95.80, or by a set date | 10 | about ₹95.80 | ₹22,930 |
| Rupee by payment date | Hedge P&L on first 10 lots (from ₹96.1225) | Effect |
|---|---|---|
| Weakens to ₹97.00 | +(0.8775 × 1,000 × 10) = +₹8,775 | Offsets the higher cost of buying dollars |
| Strengthens to ₹95.00 | −(1.1225 × 1,000 × 10) = −₹11,225 | Offset by cheaper dollars on the actual payment |
The aim is to lock in a rate, not to profit. Numbers are illustrative and ignore charges; this is not a recommendation to trade.
Expert analysis
Fact: on 16 September 2026 the US Federal Reserve raised its target range by 25 basis points to 3.75%–4.00%, its first hike since 2023. The RBI held the repo rate at 5.25% on 5 August 2026.
Fact: India’s CPI inflation rose to 4.82% in August 2026. Foreign investors withdrew ₹20,974 crore from Indian shares in 1–18 September, and the rupee hit a record low near ₹96 per dollar.
Analysis: September 2026 shows why no single method is enough. Fundamentals explained the pressure on the rupee. Sentiment showed that pressure was already crowded. Technicals, a round number of 96 and a stretched RSI, helped with the timing and the stop levels.
Analysis: research is sobering for all three approaches. Economic models struggle to beat a “no change” forecast over short horizons (Meese and Rogoff, 1983). Simple technical rules that once worked in currencies later stopped working (Neely and Weller). Sentiment extremes can persist. Combining methods does not create a sure edge. It helps you avoid trades where the evidence clearly conflicts.
Opinion: for beginners, the most practical mix is to use fundamentals and sentiment to decide whether to trade at all, and technicals to decide where to put the stop. Keep position sizes small while you learn.
Which type suits you?
| If you… | Lean on | Why |
|---|---|---|
| Hedge a real import or export exposure | Fundamentals + technicals | You need direction and good execution levels |
| Trade short-term (intraday to a few days) | Technicals + sentiment | Fundamentals move too slowly for short timeframes |
| Invest for months (e.g., in foreign assets) | Fundamentals | Long-term currency trends follow rates, inflation and flows |
Common mistakes
- Relying on one method and ignoring the others.
- Trading the headline number instead of how it compared with expectations.
- Taking positions just before RBI or Fed decisions without a plan.
- Treating extreme sentiment as an instant reversal signal.
- Adding indicators until something confirms the trade you already wanted.
- Using offshore forex apps, which are illegal for Indian residents under FEMA.
Myths vs facts
| Myth | Fact |
|---|---|
| Technical analysis is just guessing | It has shown periods of measurable value, but edges fade over time |
| Fundamentals always win in the end | They shape long-term trends but are weak at short-term timing |
| When everyone is bearish, the market must reverse | Crowded views can persist, especially when fundamentals agree |
| A higher interest rate always strengthens a currency | Inflation, growth, oil and risk sentiment can outweigh it |
| Futures premiums predict the future rate | They mainly reflect the interest rate gap |
Key takeaways
- Fundamental analysis asks why: rates, inflation, growth, trade and flows.
- Technical analysis asks when and where: trends, levels, momentum and ATR.
- Sentiment analysis asks how crowded: positioning, FPI flows, VIX and risk mood.
- In September 2026, a Fed hike, oil above $100 and FPI outflows pushed the rupee to a record low near 96.
- USD/INR futures trade at a premium because Indian interest rates are higher, not because of a forecast.
- Research shows no single method is reliably profitable; combining them helps you avoid conflicting trades.
- Always finish with a risk plan: fixed risk per trade, stops based on ATR, and smaller size when views are crowded.
FAQs
1. What are the three types of forex analysis?
Fundamental analysis (economic data and policy), technical analysis (price charts and indicators) and sentiment analysis (positioning and market mood).
2. Which type of forex analysis is best for beginners?
None works well alone. Beginners usually start with basic technical analysis for entries and stops, while checking major fundamental events such as RBI and Fed decisions.
3. What is fundamental analysis in forex?
It judges a currency by its economy and policies: interest rates, inflation, growth, trade balances and capital flows.
4. What is technical analysis in forex?
It studies past prices to find trends, support and resistance levels, momentum and suitable entry and exit points.
5. What is sentiment analysis in forex?
It measures how traders and investors are positioned and feeling, using tools such as the COT report, FPI flows and volatility indices.
6. How do interest rates affect USD/INR?
Higher US rates relative to Indian rates make dollar assets more attractive and tend to weaken the rupee. The Fed’s 16 September 2026 hike narrowed the gap to about 1.25 percentage points.
7. Why is the rupee weak in September 2026?
Reported reasons include higher US interest rates, Brent crude above $100 a barrel, and foreign investors selling Indian shares. The rupee touched a record low near ₹96 per dollar.
8. How does oil affect the rupee?
India imports most of its crude oil. Higher oil prices raise the import bill and demand for dollars, which tends to weaken the rupee.
9. What is the COT report?
It is a weekly CFTC report showing how large traders are positioned in US-listed futures. It is released on Fridays and reflects positions as of the previous Tuesday.
10. What are FPI flows and why do they matter for the rupee?
FPI flows are foreign investors’ purchases and sales of Indian shares and bonds. Outflows increase demand for dollars and put pressure on the rupee.
11. Can technical analysis predict currency moves?
It can help with timing and risk levels, but research shows its edge in currencies has faded over time. It is a tool for planning, not a guarantee.
12. Can fundamental analysis predict exchange rates?
It explains long-term pressure well but is poor at short-term forecasting. Meese and Rogoff (1983) found that standard models could not beat a simple no-change forecast over short horizons.
13. How do I combine fundamental, technical and sentiment analysis?
Use fundamentals to set a bias, sentiment to check whether the view is crowded, technicals to find entries and stops, and then size the trade for fixed risk.
14. Why do USD/INR futures trade above the spot rate?
Because Indian interest rates are higher than US rates. The premium mainly reflects that gap, not a forecast that the rupee will fall.
15. What is India VIX and how is it used in forex?
India VIX measures expected Nifty volatility. Spikes signal risk-off conditions, which often come with rupee weakness.
16. Is forex trading legal in India?
Indian residents may trade permitted currency derivatives on recognised Indian exchanges, subject to RBI rules, including the need for a genuine underlying exposure in rupee pairs. Overseas online forex platforms are illegal under FEMA.