Quick answer
Forex chart patterns are recurring shapes that price forms on a chart, hinting at what may come next. They split into reversal patterns (Head and Shoulders, Double Top/Bottom) that suggest a trend is turning, and continuation patterns (flags, pennants, triangles) that suggest it will resume. Traders act on the breakout.
Introduction
Zoom out from individual candles and larger shapes appear – a market carving out twin peaks, coiling into a triangle, or pausing in a neat little flag. These are forex chart patterns, and because human behaviour in markets rhymes, the same structures recur across pairs and timeframes. Learning to recognise them gives you a map of where price may be headed and, crucially, where to act.
This guide covers the forex chart patterns every trader should know, grouped so they’re easy to recall, plus the practical part most beginners skip: how to actually trade a pattern once you’ve spotted it. It’s educational content, not investment advice – patterns describe probabilities, not guarantees.
What Are Chart Patterns?
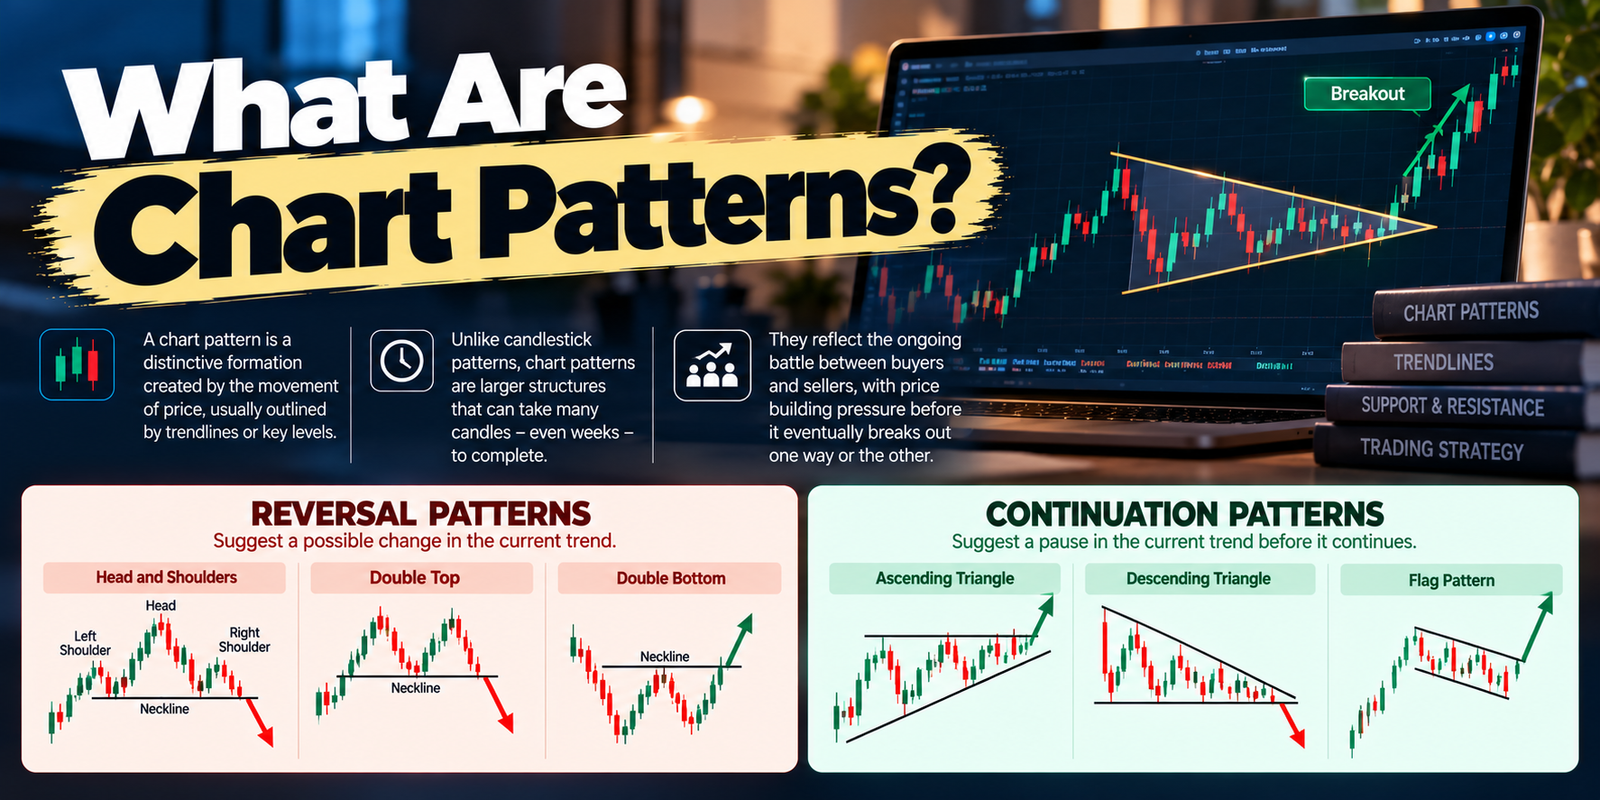
A chart pattern is a distinctive formation created by the movement of price, usually outlined by trendlines or key levels. Unlike candlestick patterns, which form over one to three candles, chart patterns are larger structures that can take many candles – even weeks – to complete. They matter because they reflect the ongoing battle between buyers and sellers: a pattern is essentially a picture of accumulating pressure that eventually resolves in a ‘breakout’ one way or the other.
Every forex chart pattern falls into one of two broad families – reversal or continuation – and knowing which family you’re looking at is the first and most useful step.
The Two Families: Reversal vs Continuation
- Reversal patterns – form at the end of a trend and suggest it’s about to change direction (for example, Head and Shoulders, Double Top/Bottom).
- Continuation patterns – form during a trend as a pause, suggesting the trend will resume after the pattern completes (for example, flags, pennants, triangles).
- Bilateral patterns – can break either way (symmetrical triangles, wedges), so you trade the direction of the actual breakout.
Cheat Sheet 1: Reversal Patterns
These warn that a trend may be ending and turning:
| Pattern | Signal | What it looks like |
|---|---|---|
| Head and Shoulders | Bearish reversal | Three peaks, the middle (head) highest; breaks the neckline |
| Inverse Head and Shoulders | Bullish reversal | Three troughs, the middle lowest; breaks the neckline upward |
| Double Top | Bearish reversal | Two peaks at a similar level (an ‘M’ shape) |
| Double Bottom | Bullish reversal | Two troughs at a similar level (a ‘W’ shape) |
| Triple Top / Bottom | Reversal | Three failed tests of the same level |
| Rounding Bottom | Bullish reversal | A gradual, U-shaped base (‘saucer’) |
Cheat Sheet 2: Continuation Patterns
These are pauses within a trend, hinting it will carry on:
| Pattern | Signal | What it looks like |
|---|---|---|
| Bull / Bear Flag | Continuation | A small channel sloping against the trend after a sharp move |
| Pennant | Continuation | A small symmetrical triangle right after a strong move |
| Ascending Triangle | Usually bullish | Flat top (resistance), rising lows – buyers pressing up |
| Descending Triangle | Usually bearish | Flat bottom (support), falling highs – sellers pressing down |
| Rectangle (range) | Continuation | Price bounces between horizontal support and resistance |
| Cup and Handle | Bullish continuation | A U-shaped ‘cup’ then a small pullback ‘handle’ |
Cheat Sheet 3: Bilateral (Either-Way) Patterns
These can resolve up or down, so you wait for the breakout to tell you the direction:
| Pattern | Signal | What it looks like |
|---|---|---|
| Symmetrical Triangle | Bilateral | Converging highs and lows; trade the breakout direction |
| Rising Wedge | Bearish (usually) | Upward-sloping converging lines; often breaks down |
| Falling Wedge | Bullish (usually) | Downward-sloping converging lines; often breaks up |
How to Trade a Chart Pattern
Spotting a pattern is only half the job – trading it well follows a repeatable routine:
- Identify the pattern and its key level – the neckline, trendline or support/resistance that price must break.
- Wait for the breakout – enter when price closes decisively beyond the level, not on the first touch.
- Confirm it – a strong breakout candle, rising volume, or agreement from an indicator adds conviction.
- Project a target (measured move) – measure the pattern’s height and project it from the breakout point.
- Place a stop-loss – just beyond the opposite side of the pattern, and size to a fixed, small risk.
The Measured Move (Setting a Target)
Many chart patterns come with a built-in way to estimate how far price might travel after the breakout – the ‘measured move’:
Head and Shoulders: target = distance from head to neckline,
projected down from the neckline break.
Double Top/Bottom: target = height of the pattern,
projected from the neckline break.
Flag / Pennant: target = length of the ‘flagpole’ (the sharp move),
projected from the breakout.
These are estimates, not promises – price may fall short or run far beyond. But a measured move gives you a sensible, structure-based target to pair with your stop-loss, which is what turns a pattern into an actual trade plan.
Do Chart Patterns Work in Forex (and India)?
Chart patterns are market-agnostic – they form on forex, stocks, commodities and indices alike, because they reflect universal crowd behaviour. They appear just as readily on the USD/INR or EUR/USD charts an Indian trader watches as on any global chart. That said, no pattern is a crystal ball: they fail regularly, breakouts can be false, and reliability improves with confirmation, higher timeframes and confluence with other tools. Treat forex chart patterns as high-quality clues within a broader analysis, not as standalone buy and sell signals.

Common Mistakes
- Trading before the breakout, anticipating a pattern that never completes.
- Chasing false breakouts without waiting for a confirmed close.
- Forcing patterns onto the chart that aren’t really there.
- Ignoring the trend and market context around the pattern.
- Skipping the stop-loss because the pattern ‘looked textbook’.
Myths vs Facts
| Myth | Fact |
|---|---|
| Chart patterns guarantee the move. | They signal probabilities; breakouts fail and targets can miss. |
| You should enter as the pattern forms. | Trade the confirmed breakout, not the anticipation. |
| All triangles break the same way. | Symmetrical triangles are bilateral; trade the actual breakout. |
| Patterns only work on stocks. | They form on any liquid market, including forex and currency derivatives. |
Risk disclaimer
This article is for educational purposes only and is not investment advice. Chart patterns describe probabilities, not certainties, and false breakouts are common. Trading involves risk of loss. Always trade confirmed breakouts with a stop-loss, trade only through SEBI-registered brokers on recognised exchanges, and consult a qualified professional before trading.
Expert Analysis
The reason forex chart patterns endure – despite decades of scepticism about whether they ‘really work’ – is that they are visual summaries of supply and demand, not mystical shapes. A Head and Shoulders isn’t a signal because the drawing resembles a body; it’s a signal because it depicts buyers making a final failed push (the head) and then losing control, which is precisely what a trend reversal looks like as it happens. Read this way, every pattern is a story about who is winning and who is exhausted. Traders who internalise the story stop needing to memorise dozens of names and start recognising the underlying structure – accumulation, exhaustion, breakout – in whatever form it appears.
The practical edge, though, comes less from identifying patterns and more from how you trade them. The most common way beginners lose money with patterns is by front-running them – buying a ‘double bottom’ that hasn’t confirmed, or shorting a ‘head and shoulders’ before the neckline breaks – and getting caught when the pattern morphs into something else. Disciplined traders do the opposite: they let the pattern complete, wait for a decisive breakout, use the measured move to set a realistic target, and place a stop beyond the structure so a false breakout costs little. That patience converts a suggestive shape into a defined-risk trade with an edge. The pattern spots the opportunity; the process is what makes it profitable over many trades.
Key Takeaways
- Forex chart patterns are recurring price structures that hint at the next move.
- Reversal patterns (Head and Shoulders, Double Top/Bottom) suggest a trend is turning.
- Continuation patterns (flags, pennants, triangles) suggest the trend will resume.
- Trade the confirmed breakout, project a measured-move target, and place a stop beyond the pattern.
- Patterns work on any market but describe probabilities – use confirmation and risk control.
Frequently Asked Questions (FAQ)
Q: What are forex chart patterns?
A: Recurring shapes that price forms on a chart – like triangles or double tops – that hint at likely future movement based on crowd behaviour.
Q: What is the difference between reversal and continuation patterns?
A: Reversal patterns suggest a trend is about to change direction; continuation patterns suggest a pause before the trend resumes.
Q: What is a head and shoulders pattern?
A: A bearish reversal pattern with three peaks – the middle (head) highest – that signals a downturn when price breaks the neckline.
Q: What is a double top?
A: A bearish reversal pattern with two peaks at a similar level (an ‘M’ shape), signalling a possible top when the neckline breaks.
Q: What is a double bottom?
A: A bullish reversal pattern with two troughs at a similar level (a ‘W’ shape), signalling a possible bottom when the neckline breaks.
Q: What is a triangle pattern?
A: A pattern of converging price – ascending (usually bullish), descending (usually bearish) or symmetrical (bilateral) – traded on the breakout.
Q: What is a flag or pennant?
A: Short continuation patterns that form after a sharp move, hinting the trend will resume after a brief pause.
Q: Which chart patterns are bullish?
A: Inverse Head and Shoulders, Double/Triple Bottom, Rounding Bottom, ascending triangle, bull flag, falling wedge and Cup and Handle.
Q: Which chart patterns are bearish?
A: Head and Shoulders, Double/Triple Top, descending triangle, bear flag and rising wedge, among others.
Q: How do I trade a chart pattern?
A: Identify the key level, wait for a confirmed breakout, project a measured-move target, and place a stop beyond the pattern.
Q: What is a measured move?
A: A structure-based target: you measure the pattern’s height and project it from the breakout point to estimate how far price may travel.
Q: Are chart patterns reliable?
A: They describe probabilities, not certainties; false breakouts happen, so reliability improves with confirmation and context.
Q: Do chart patterns work in forex?
A: Yes. They form on forex and currency-derivative charts just as on any liquid market, since they reflect universal crowd behaviour.
Q: What is a false breakout?
A: When price breaks a pattern’s level but quickly reverses, trapping traders who entered too early – a reason to wait for confirmation.
Q: What timeframe is best for chart patterns?
A: Higher timeframes (4-hour, daily) are generally more reliable than very low ones, which contain more noise and false signals.