Introduction
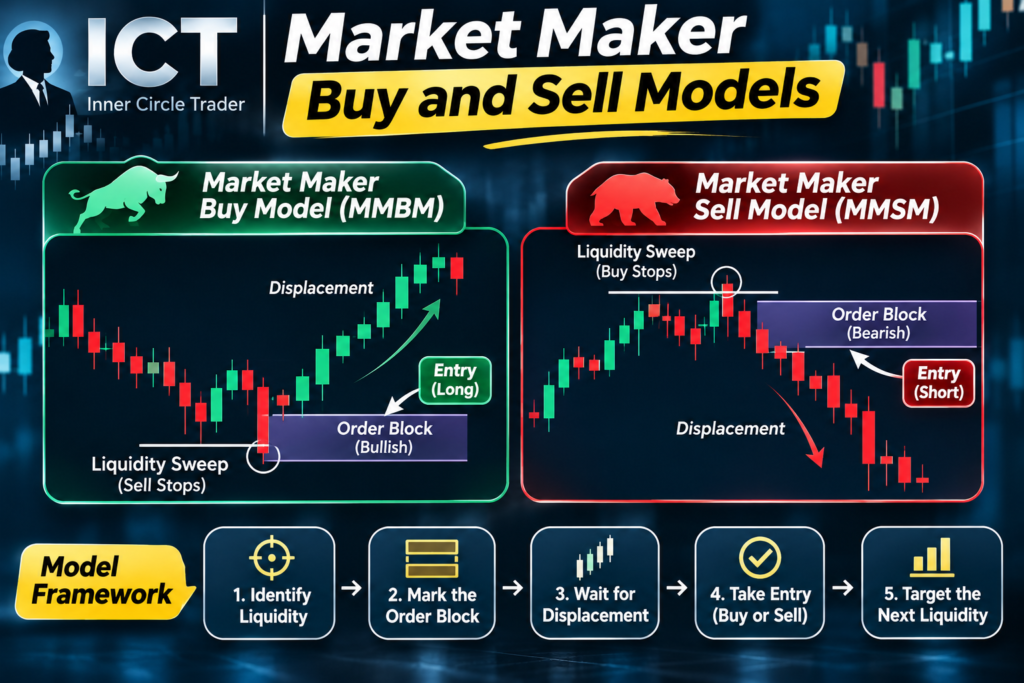
Inner Circle Trader (ICT) concepts have become some of the most discussed ideas in retail trading. Among them, the market maker models stand out because they try to describe a complete price cycle, from consolidation to manipulation to expansion, rather than a single entry pattern.
The ICT market maker model comes in two versions: the Market Maker Buy Model (MMBM) and the Market Maker Sell Model (MMSM). Both describe how price may move away from a range to collect liquidity, reverse at a key level and then return to where it started, and often beyond.
This guide explains:
- What the ICT market maker model is and the idea behind it
- The stages of the buy and sell models
- How to identify the smart money reversal
- Entries, stop-losses and targets
- A worked example, limitations and common mistakes
Keep in mind that these are trading frameworks, not proven descriptions of how real market makers operate. Treat them as a way to organise your analysis, and test them before relying on them.
What Is the ICT Market Maker Model?
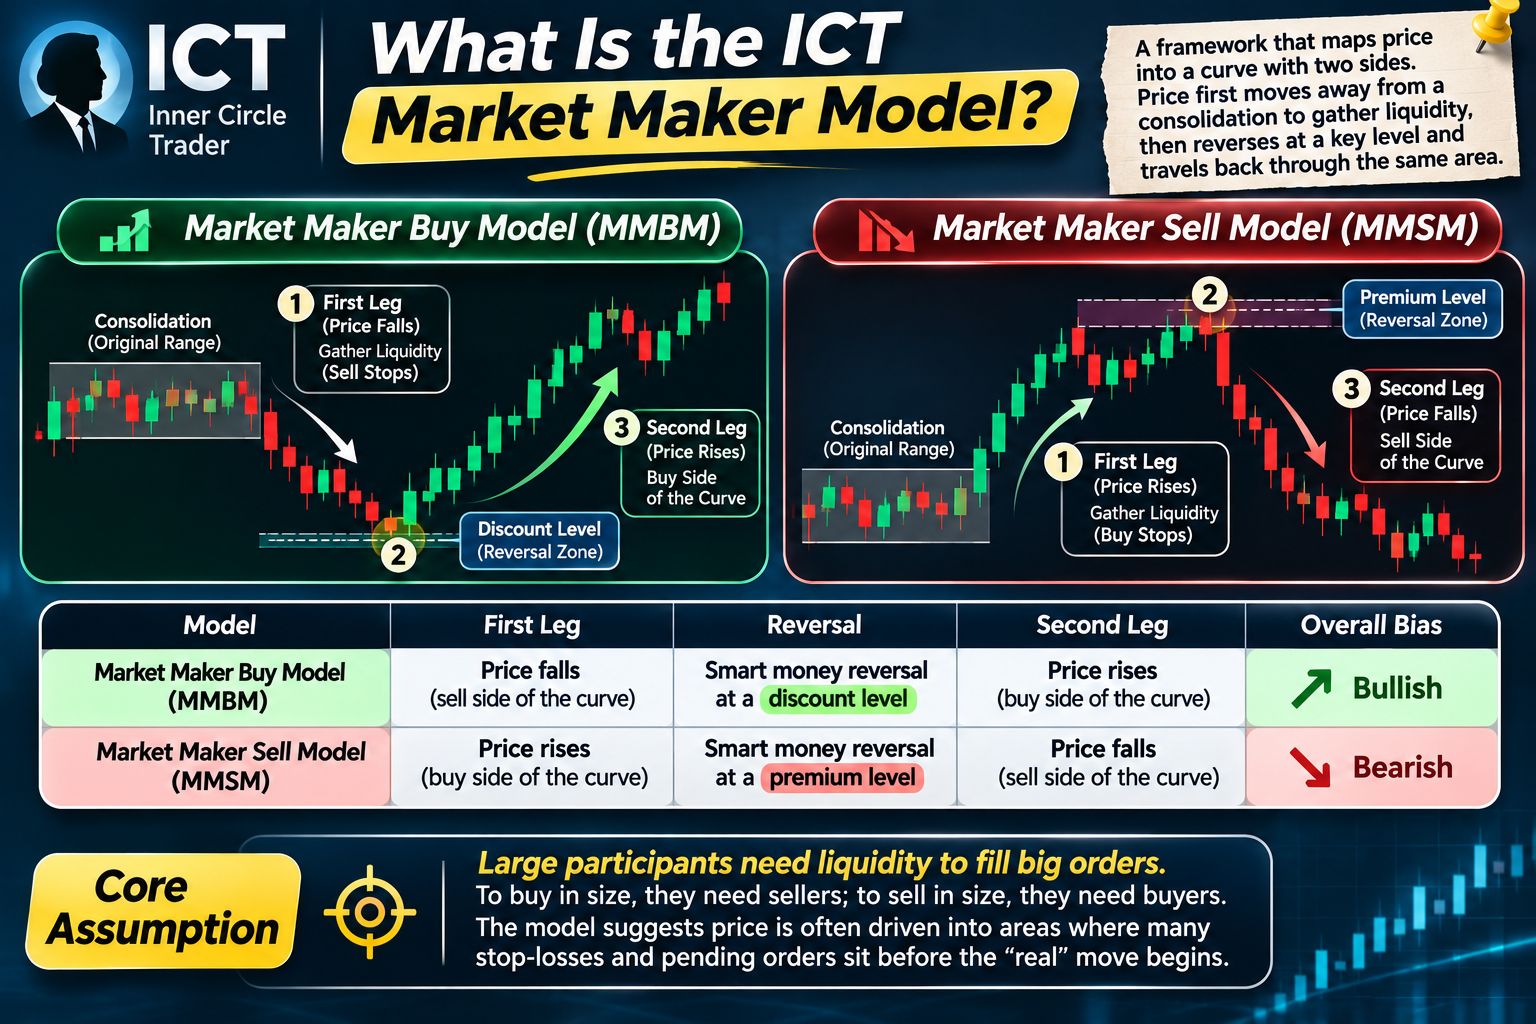
The ICT market maker model is a framework that maps price into a curve with two sides. Price first moves away from an original consolidation in one direction, gathering liquidity, then reverses at a significant higher-timeframe level and travels back through the same area.
The core assumption is that large participants need liquidity to fill big orders. To buy in size, they need sellers; to sell in size, they need buyers. The model suggests price is often driven into areas where many stop-losses and pending orders sit before the “real” move begins.
| Model | First leg | Reversal | Second leg | Overall bias |
|---|---|---|---|---|
| Market Maker Buy Model (MMBM) | Price falls (sell side of the curve) | Smart money reversal at a discount level | Price rises (buy side of the curve) | Bullish |
| Market Maker Sell Model (MMSM) | Price rises (buy side of the curve) | Smart money reversal at a premium level | Price falls (sell side of the curve) | Bearish |
 Key Terms in the ICT Market Maker Model
- Original consolidation: The range where the model begins and which later becomes the main target.
- Sell side of the curve: The falling leg, made of lower highs and lower lows.
- Buy side of the curve: The rising leg, made of higher highs and higher lows.
- Smart money reversal (SMR): The turning point at the bottom (MMBM) or top (MMSM) of the curve, usually at a higher-timeframe PD array.
- PD array: ICT’s term for premium and discount reference points, such as order blocks, fair value gaps, breaker blocks and old highs or lows.
- Market structure shift (MSS): A break of a recent swing point that signals a possible change in direction.
- Liquidity: Clusters of stop-losses and pending orders above highs (buy-side liquidity) or below lows (sell-side liquidity).
The ICT Market Maker Buy Model (MMBM)
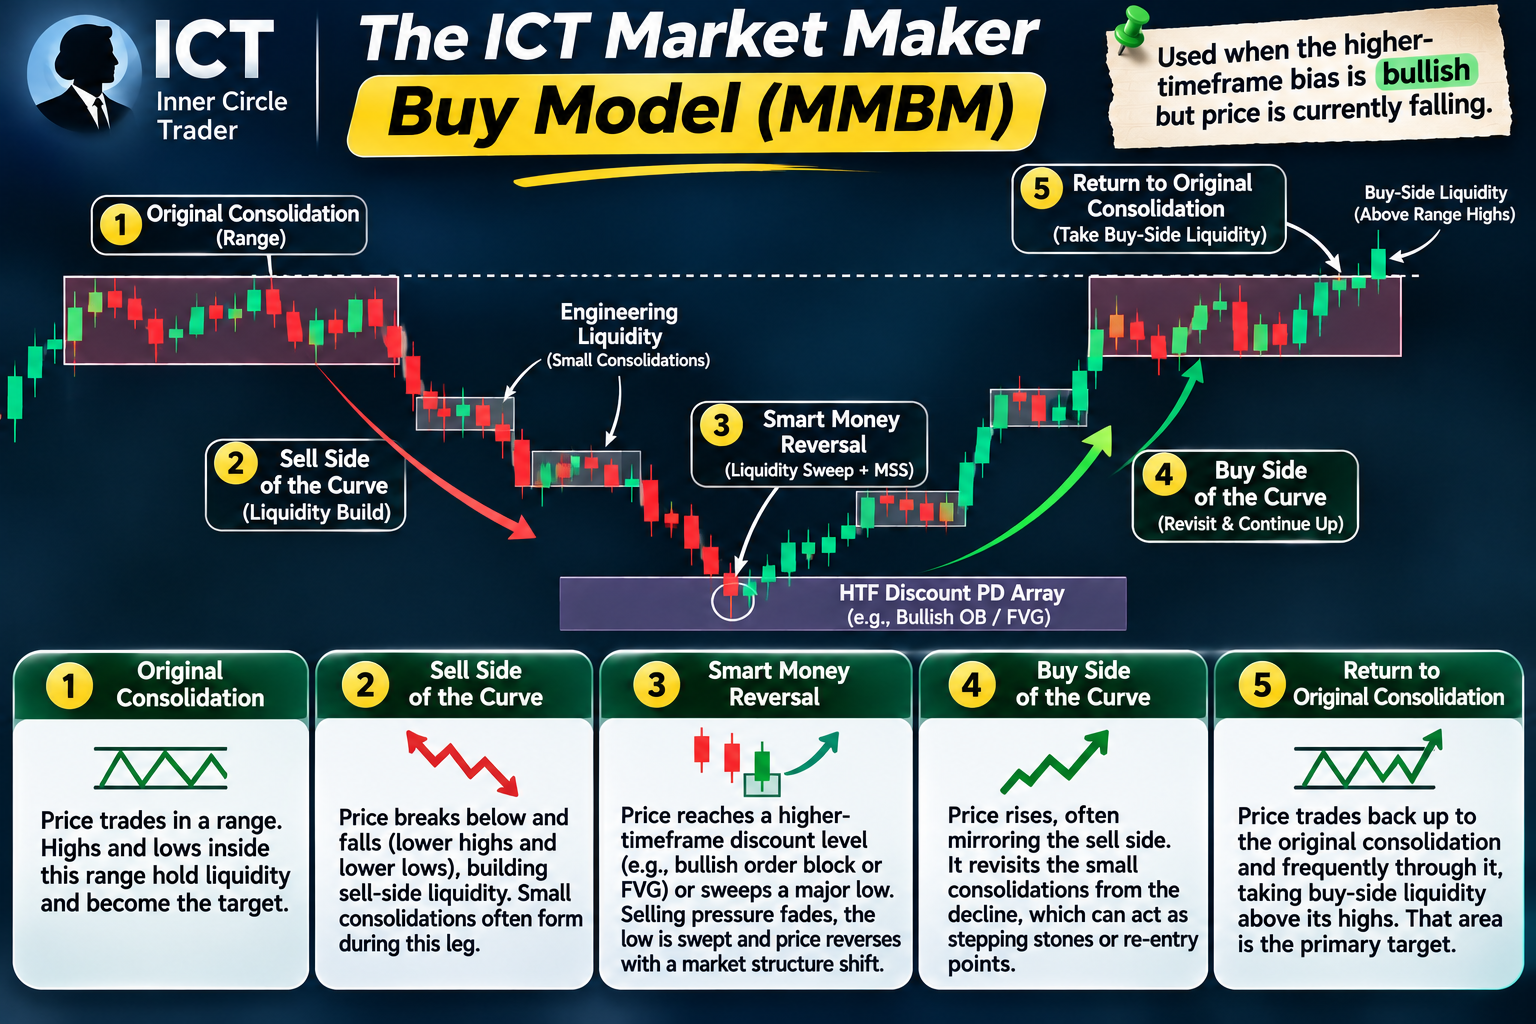
The buy version of the ICT market maker model is used when the higher-timeframe bias is bullish but price is currently falling.
Stage 1: Original consolidation
Price trades in a range. Highs and lows inside this range hold liquidity, and the range itself becomes the eventual target.
Stage 2: Sell side of the curve
Price breaks below the consolidation and falls in a series of lower highs and lower lows. Each short-term low that forms attracts more sell stops beneath it. Within this leg, there are often small consolidations (sometimes called “engineering liquidity”) that are later revisited.
Stage 3: Smart money reversal
Price reaches a higher-timeframe discount PD array, such as a daily bullish order block or fair value gap, or sweeps a major old low. Selling pressure fades, the low is swept and price snaps back with a market structure shift on the lower timeframe.
Stage 4: Buy side of the curve
Price rises, often mirroring the shape of the sell side. It revisits the small consolidations formed during the decline, which can act as stepping stones or re-entry points.
Stage 5: Return to the original consolidation
Price trades back up to the original consolidation and frequently through it, taking buy-side liquidity above its highs. That area is the primary target.
The ICT Market Maker Sell Model (MMSM)
The sell model is the mirror image. Use this version of the ICT market maker model when the higher-timeframe bias is bearish but price is currently rising.
- Original consolidation: Price ranges, building liquidity.
- Buy side of the curve: Price rallies out of the range with higher highs and higher lows, drawing in buyers and building buy stops above each high.
- Smart money reversal: Price reaches a higher-timeframe premium PD array or sweeps a major old high, then shifts structure lower.
- Sell side of the curve: Price declines, revisiting the consolidations formed during the rally.
- Return to the original consolidation: Price trades back down to the starting range and often beyond, taking sell-side liquidity.
How to Identify a Valid Smart Money Reversal
The reversal is the heart of the ICT market maker model. Trading it too early is the most common way to lose money with this framework. Look for:
- Higher-timeframe confluence: The reversal should occur at a daily or 4-hour PD array, not a random level.
- Liquidity sweep: Price should take out a clear old low (MMBM) or old high (MMSM).
- Displacement: A strong move away from the extreme, often leaving a fair value gap.
- Market structure shift: A break of the most recent lower-timeframe swing high (MMBM) or swing low (MMSM).
- Timing: Many ICT traders prefer reversals during the London or New York sessions, when volume is highest.
If these elements are missing, the decline or rally may simply continue, and the model is not yet in play.
ICT Market Maker Model Entries, Stops and Targets
Entry options
- Fair value gap entry: After the market structure shift, wait for price to retrace into the fair value gap created by the displacement.
- Order block entry: Enter at the last opposing candle before the displacement move.
- Re-entry on the curve: As price travels up (or down) the second side of the curve, look for pullbacks into earlier consolidations.
Stop-loss
Place the stop beyond the smart money reversal extreme, the low in an MMBM or the high in an MMSM. If that point is taken out, the model is invalid.
Targets
- First target: The nearest consolidation formed on the first side of the curve.
- Main target: The original consolidation.
- Extended target: Liquidity beyond the original consolidation, such as old highs (MMBM) or old lows (MMSM).
Scaling out at each target lets you lock in profit while leaving part of the position for the full move.

Worked Example of an ICT Market Maker Model Trade
Suppose the daily chart of EUR/USD is bullish and price has recently traded in an original consolidation between 1.1700 and 1.1720 on the 1-hour chart.
- Sell side of the curve: Price breaks below 1.1700 and falls over several sessions, forming small consolidations near 1.1665 and 1.1630.
- Higher-timeframe level: Price reaches a daily bullish fair value gap between 1.1575 and 1.1595, just below an old low at 1.1585.
- Smart money reversal: During the London session, price sweeps the 1.1585 low, prints 1.1578 and then rallies sharply, breaking the last 15-minute swing high at 1.1610 and leaving a fair value gap between 1.1598 and 1.1608.
- Entry: Price retraces into the gap, and the trader buys at 1.1605.
- Stop: Below the reversal low at 1.1570 (35 pips of risk).
- Targets: First at 1.1630 (25 pips), second at 1.1665 (60 pips) and the main target at the original consolidation’s low of 1.1700 (95 pips).
- Outcome: Price climbs the buy side of the curve, pausing at each consolidation, and reaches 1.1700 over the next two days.
If the trader closes one-third at each target, the average gain is 60 pips on 35 pips of risk, about 1.7 times the risk. Holding the full position to 1.1700 would give about 2.7 times the risk.
This example is illustrative and uses hypothetical prices.
Timeframes for the ICT Market Maker Model
| Purpose | Timeframe |
|---|---|
| Bias and PD arrays | Weekly, daily, 4-hour |
| Mapping the curve | 1-hour, 4-hour |
| Spotting the reversal and entry | 15-minute, 5-minute |
The model is fractal, meaning it can appear on any timeframe. However, setups that align with higher-timeframe direction tend to be more reliable than those fighting it.
ICT Market Maker Model vs Other SMC Tools
| Tool | What it focuses on | How it fits the model |
|---|---|---|
| Order block | A single zone of institutional activity | Often marks the reversal point or an entry |
| Fair value gap | A price imbalance | Common entry after the market structure shift |
| BOS and CHoCH | Changes in market structure | Confirms the reversal |
| Liquidity sweep | Stop hunts beyond highs or lows | Triggers the smart money reversal |
| Market maker model | The full cycle from range to reversal to return | Ties all the tools into one narrative |
The value of the ICT market maker model is that it gives context. Instead of trading isolated order blocks or gaps, you know where in the cycle you are and where price is likely to go next.
Limitations of the ICT Market Maker Model
- Subjectivity: Different traders may label the original consolidation, curve and reversal differently.
- Hindsight bias: The model looks perfect on past charts but is harder to identify in real time.
- Not every move completes the cycle: Price may reverse halfway up the curve or never return to the original range.
- Unproven assumptions: The idea that “market makers” deliberately engineer these moves is a narrative, not an established fact.
- Overfitting: Adding too many conditions can make the model look accurate in backtests but fail live.
Common ICT Market Maker Model Mistakes
- Calling the reversal too early: Buying every new low in an MMBM before a structure shift appears.
- Ignoring higher-timeframe bias: Trading an MMBM against a strong daily downtrend.
- Stops too tight: Placing stops inside the reversal area invites a second sweep.
- Expecting a perfect mirror: The second side of the curve rarely matches the first exactly.
- Trading during major news: Spikes can create false reversals and wide spreads.
- Skipping backtesting: Test your exact rules on historical data before trading live.
Using the ICT Market Maker Model in Indian Markets
Indian traders apply ICT concepts to Nifty and Bank Nifty futures, stocks and NSE currency futures.
- USD/INR: The pair often moves in tight ranges because the RBI smooths volatility, so full market maker cycles can be shallow. Focus on higher timeframes and be realistic about target sizes.
- Cross-currency futures: EUR/USD, GBP/USD and USD/JPY on NSE follow global prices, so analysis on spot charts can guide trades, but check NSE liquidity and trading hours.
- Index futures: Nifty and Bank Nifty often show clear liquidity sweeps at the open and around key levels.
Indian residents should trade currencies only through recognised exchanges such as NSE and BSE via SEBI-registered brokers. Leveraged forex trading on offshore platforms is not permitted under FEMA.
ICT Market Maker Model Checklist
- Is the higher-timeframe bias clear?
- Can I identify the original consolidation?
- Has price completed the first side of the curve?
- Has price reached a higher-timeframe PD array?
- Was liquidity swept, followed by displacement and a structure shift?
- Is my stop beyond the reversal extreme?
- Are my targets at consolidations and the original range, with at least 1:2 reward-to-risk to the main target?
FAQs
What is the ICT market maker model?
It is a framework that describes price moving away from an original consolidation, reversing at a key higher-timeframe level after a liquidity sweep and returning to the starting range.
What is the difference between MMBM and MMSM?
The buy model starts with a decline and ends with a rally; the sell model starts with a rally and ends with a decline.
What is a smart money reversal?
It is the turning point of the curve, usually marked by a liquidity sweep, displacement and a market structure shift at a higher-timeframe level.
Does the ICT market maker model work on all timeframes?
The pattern appears on many timeframes, but it is most reliable when aligned with the higher-timeframe trend.
Is the ICT market maker model suitable for beginners?
It requires a good understanding of market structure, liquidity and PD arrays. Beginners should learn those foundations first and practise on a demo account.
Conclusion
The ICT market maker model offers a structured way to see the bigger picture: where price started, where liquidity sits, where a reversal is likely and where price may return. The Market Maker Buy Model and Market Maker Sell Model tie together order blocks, fair value gaps and liquidity sweeps into a single narrative.
Use it as a framework, not a guarantee. Wait for clear confirmation at the smart money reversal, align with higher-timeframe bias, keep risk small and backtest your rules thoroughly before trading live.