Key points on US GDP PCE
- US Q3 GDP grew at a 3.4% annualised rate, above the 3.2% forecast and up from 2.2% in Q2.
- September PCE inflation rose to 3.6% y/y, and core PCE to 3.1%, both in line with forecasts.
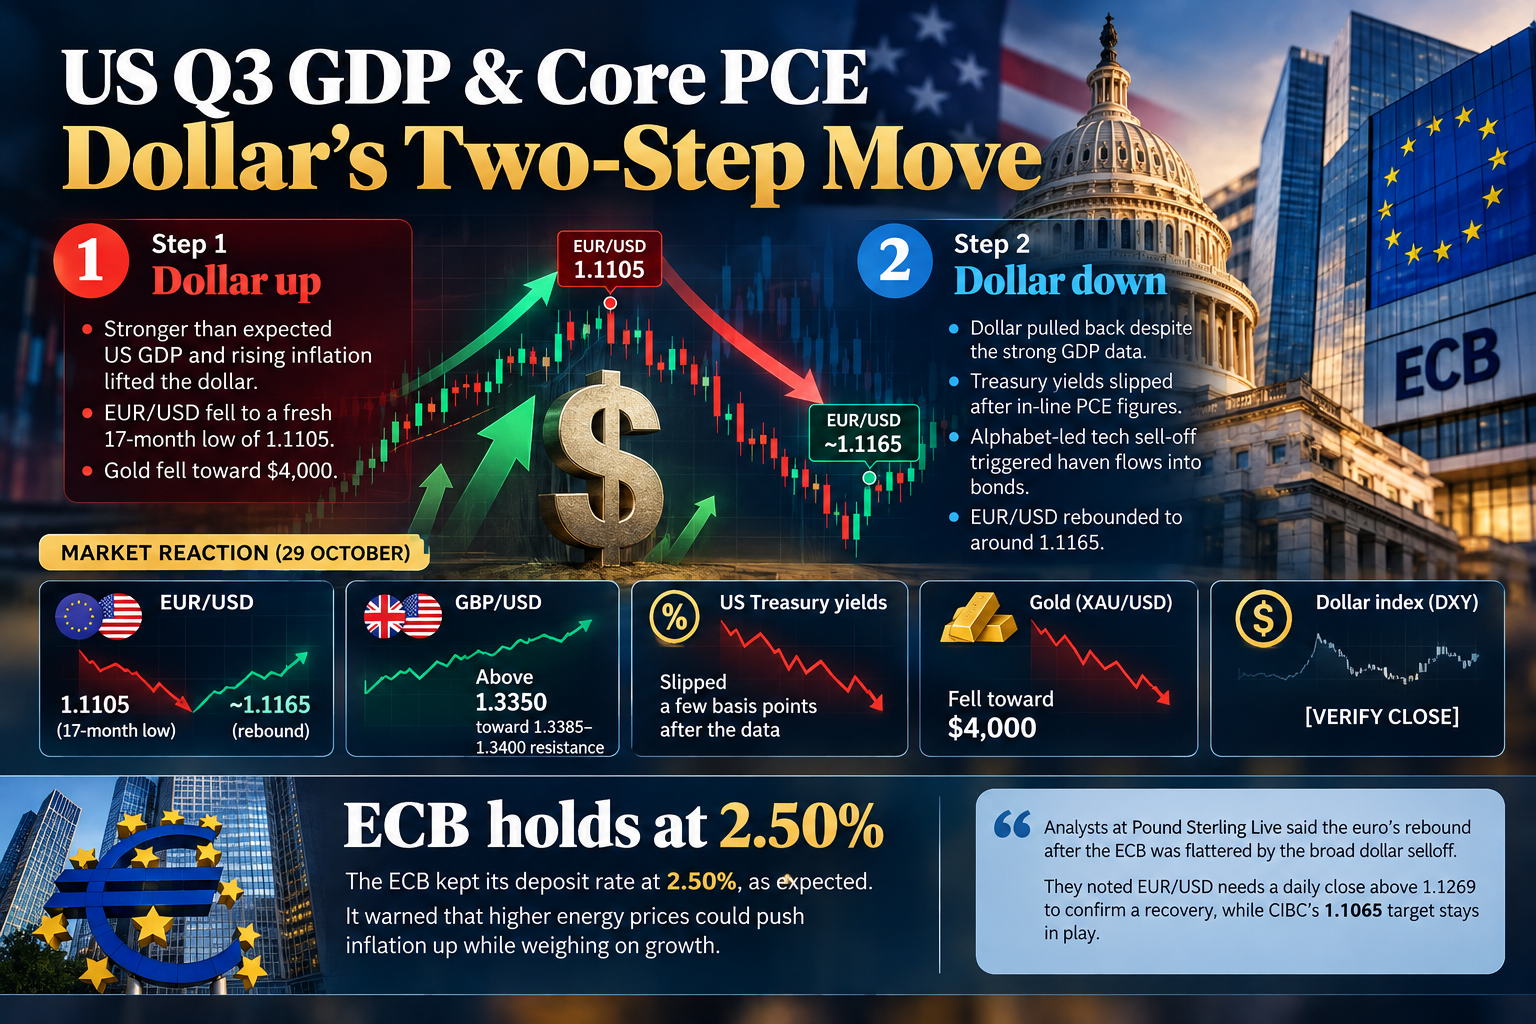
- The dollar first rose, pushing EUR/USD to a 17-month low of 1.1105, then gave back gains as Treasury yields slipped.
- A December Fed hike remains the base case, with markets pricing about 78%.
What happened
| Indicator | Actual | Forecast | Previous |
|---|---|---|---|
| Q3 GDP (annualised, advance) | 3.4% | 3.2% | 2.2% |
| Q3 consumer spending (annualised) | 3.8% | – | 3.8% |
| September PCE y/y | 3.6% | 3.6% | 3.4% |
| September PCE m/m | 0.5% | – | 0.3% |
| September core PCE y/y | 3.1% | 3.1% | 3.0% |
| September core PCE m/m | 0.3% | – | 0.2% |
| Q3 core PCE (annualised) | 2.5% | – | 3.3% |
Growth was driven by strong consumer spending and a large wave of AI-related investment. Consumer spending contributed 2.5 percentage points to headline GDP. On a quarterly basis, PCE inflation slowed sharply. But the September monthly readings showed prices picking up again at the end of the quarter.

Why it matters
Strong growth plus sticky inflation keeps the Fed hawkish. The data came a day after the Fed held rates in a 10–2 vote. Resilient growth and rising inflation both support another hike in December, and markets were pricing about a 78% chance of one afterwards.
The PCE detail avoided an upside surprise. PCE is the Fed’s preferred inflation measure. Because headline and core PCE matched forecasts rather than beating them, Treasury yields eased slightly after the release. KBC’s markets desk said US rates slipped a few basis points, probably because PCE avoided an upside surprise.
Market reaction: a two-step move
Step 1, dollar up: The strong GDP beat and rising inflation initially lifted the dollar. EUR/USD fell to a fresh 17-month low of 1.1105, its weakest since May 2025, before the ECB announced its hold. Gold fell toward $4,000 as the GDP beat boosted the Fed hike outlook.
Step 2, dollar down: The dollar then pulled back despite the strong GDP data. Two factors drove the reversal. Treasury yields slipped after the in-line PCE figures, and an Alphabet-led tech sell-off on Wall Street triggered haven flows into bonds. EUR/USD rebounded to around 1.1163–1.1167 by the afternoon, and GBP/USD climbed above 1.3350.
| Market | Reaction on 29 October |
|---|---|
| EUR/USD | Fell to a 17-month low of 1.1105, then rebounded to ~1.1165 |
| GBP/USD | Rose above 1.3350, toward 1.3385–1.3400 resistance |
| US Treasury yields | Slipped a few basis points after the data |
| Gold | Fell toward $4,000 |
| Dollar index | – |
The ECB at the same time: The ECB held its deposit rate at 2.50%, as expected. It warned that higher energy prices could push inflation up while weighing on growth. Analysts at Pound Sterling Live said the euro’s rebound after the ECB was flattered by the broad dollar selloff. They noted EUR/USD needs a daily close above 1.1269 to confirm a recovery, while CIBC’s 1.1065 target stays in play.
Impact on Indian traders
USD/INR: The data came out at 18:00 IST, after the NSE currency segment closed at 17:00 IST. The rupee had closed at 95.25 (provisional) on Thursday, after touching a two-week low of 95.38. The effect of the US data and the dollar’s pullback shows in Friday’s trading.
EUR/INR: The euro’s dip to a 17-month low and rebound means EUR/INR may open near Thursday’s levels. EUR/INR stood around 106.39 on 29 October.
Rupee drivers: A strong US economy and a hawkish Fed path support the dollar, which is a headwind for the rupee. Softer crude prices and any easing in US yields can offset that.
Currency pairs on NSE: NSE lists USD/INR, EUR/INR, GBP/INR and JPY/INR, plus EUR/USD, GBP/USD and USD/JPY. Trading forex with unauthorised offshore platforms is not permitted under FEMA.
Days like this, when a tech sell-off reversed the dollar, show how risk sentiment can override data. Our Risk-On / Risk-Off Meter can help you track those shifts.

What to watch next
| Date (IST) | Event | Why it matters |
|---|---|---|
| Fri, 30 Oct | BoJ decision; Eurozone Q3 GDP; Germany CPI; RBI forex reserves (evening) | JPY, EUR and rupee drivers |
| Sun, 1 Nov | US clocks change | US data moves to 19:00 IST |
| Tue–Wed, 3–4 Nov | US midterm elections | Fiscal outlook; dollar volatility |
| Fri, 6 Nov | US October jobs report | Key input for the December Fed decision |
| Wed, 25 Nov | Q3 GDP second estimate | Revision to today’s 3.4% |
| Late Nov | October PCE | The last PCE before the December Fed meeting |
| Tue–Wed, 8–9 Dec | FOMC, with new projections | A hike is about 78% priced |
Possible scenarios:
- If October jobs and CPI data stay strong, a December hike is likely to firm further, supporting the dollar.
- If the tech sell-off deepens and yields keep falling, the dollar could stay under pressure despite strong growth data.
Track all release times on our Economic Calendar, and find more coverage in Market Analysis & News. Related: Fed rate decision October 2026 recap, ECB October 2026 preview
FAQs
What was US GDP growth in Q3 2026?
The advance estimate showed 3.4% annualised growth, above the 3.2% forecast and up from 2.2% in Q2.
What was US core PCE inflation in September 2026?
Core PCE rose 3.1% year on year, up from 3.0% and in line with forecasts. Headline PCE rose to 3.6%.
Why did the dollar fall despite strong GDP?
PCE inflation matched forecasts rather than beating them, so Treasury yields eased. A tech-led stock sell-off also pushed money into bonds, which weighed on the dollar.