
Introduction
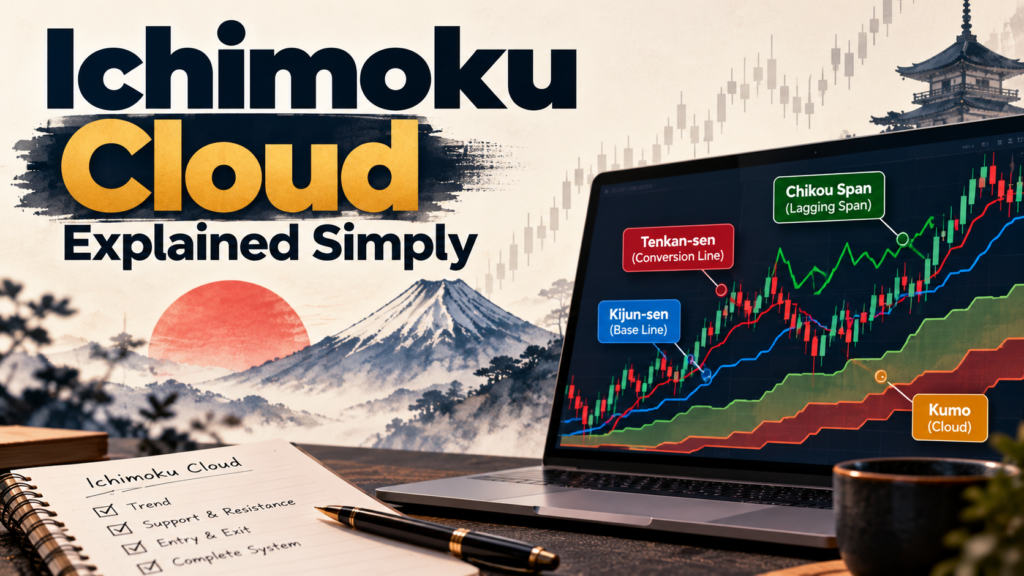
At first glance, the Ichimoku Cloud looks like a messy tangle of lines and coloured shading. Many traders add it to a chart, feel overwhelmed and remove it a minute later. That is a shame, because once you understand it, it becomes one of the most complete tools in technical analysis.
The Ichimoku Cloud shows trend direction, momentum, and support and resistance in a single view. Its full name, Ichimoku Kinko Hyo, roughly translates from Japanese as “one glance equilibrium chart”. The idea is that you can judge the state of the market at a glance.
This guide explains the Ichimoku Cloud simply, covering:
- Where the indicator came from and what it measures
- Its five lines and how the cloud is formed
- The main trading signals and a step-by-step strategy
- Settings, strengths, limitations and common mistakes
What Is the Ichimoku Cloud?
The Ichimoku Cloud is a trend-following indicator developed by Japanese journalist Goichi Hosoda, who worked on it for years before publishing it in the late 1960s. Unlike a single moving average, it combines five lines into one system.
Instead of using closing prices like most moving averages, Ichimoku lines are built from midpoints: the average of the highest high and lowest low over a set number of periods. That makes them reflect the balance point, or “equilibrium”, of recent price action.
The most distinctive part is the cloud itself, called the Kumo. It is a shaded area between two lines that are projected into the future, giving traders a view of where support and resistance may sit in the days ahead.
The Five Lines of the Ichimoku Cloud
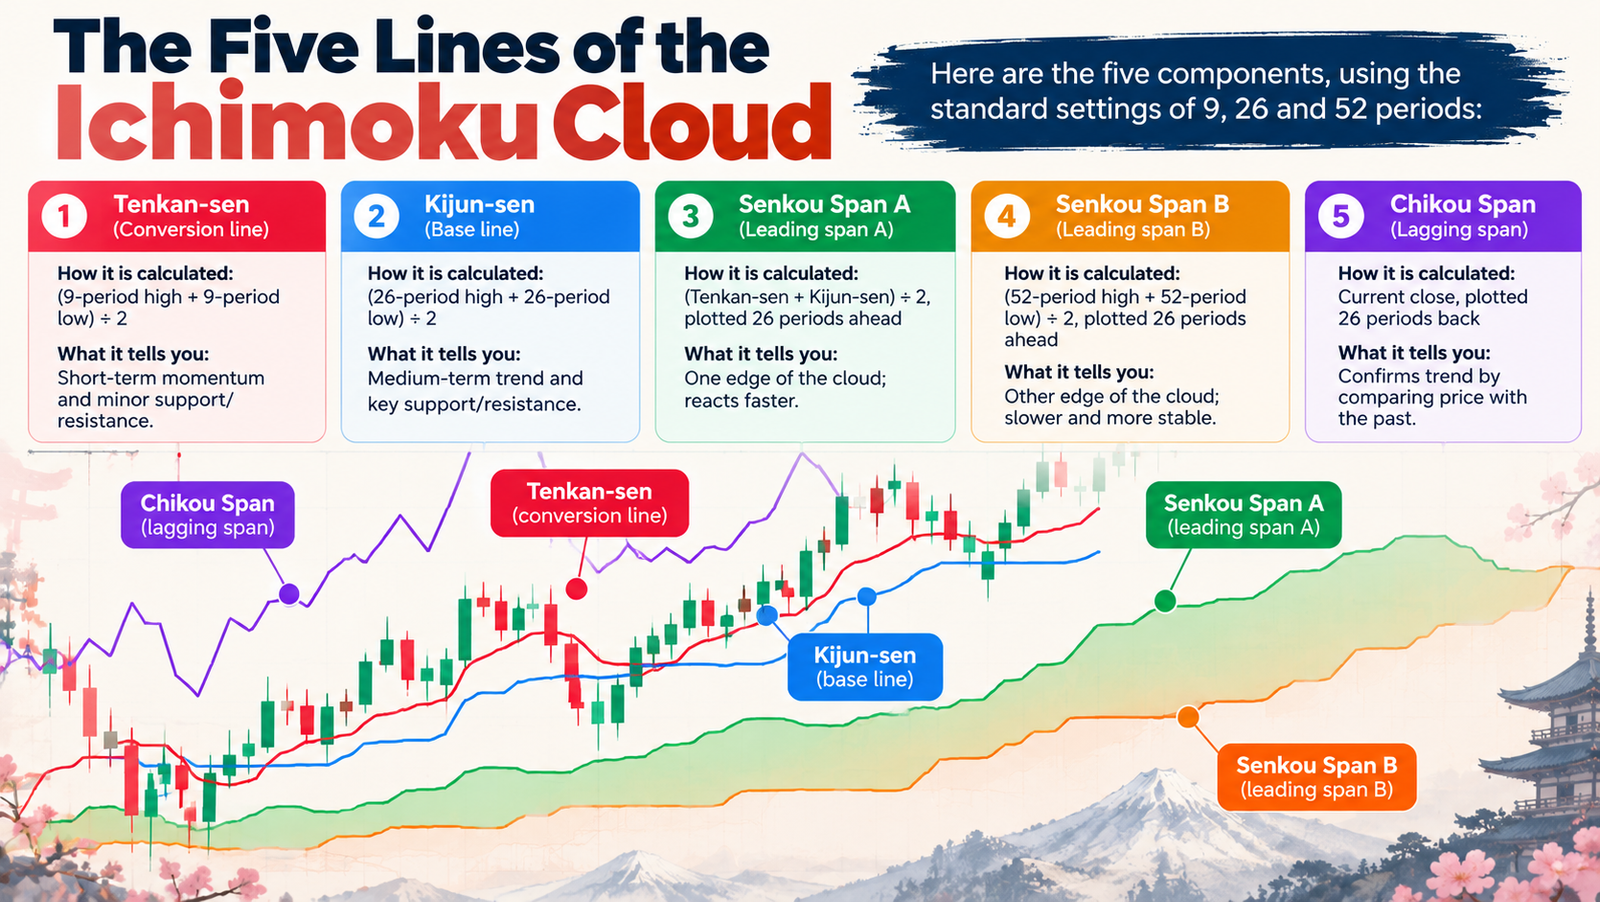
Here are the five components, using the standard settings of 9, 26 and 52 periods:
| Line | Also called | How it is calculated | What it tells you |
|---|---|---|---|
| Tenkan-sen | Conversion line | (9-period high + 9-period low) ÷ 2 | Short-term momentum and minor support/resistance |
| Kijun-sen | Base line | (26-period high + 26-period low) ÷ 2 | Medium-term trend and key support/resistance |
| Senkou Span A | Leading span A | (Tenkan-sen + Kijun-sen) ÷ 2, plotted 26 periods ahead | One edge of the cloud; reacts faster |
| Senkou Span B | Leading span B | (52-period high + 52-period low) ÷ 2, plotted 26 periods ahead | Other edge of the cloud; slower and more stable |
| Chikou Span | Lagging span | Current close, plotted 26 periods back | Confirms trend by comparing price with the past |
Tenkan-sen (conversion line)
The Tenkan-sen is the fastest line. It follows price closely and shows short-term momentum. When it slopes up steeply, buyers are in control in the short term. When it flattens, the market is pausing.
Kijun-sen (base line)
The Kijun-sen is slower and acts as a medium-term equilibrium line. Price often pulls back to it during trends, which makes it a popular level for entries and trailing stops.
Senkou Span A and Senkou Span B
These two lines form the cloud. Because they are plotted 26 periods into the future, the cloud shows potential support and resistance ahead of price. Span A moves faster because it is based on the Tenkan-sen and Kijun-sen. Span B is based on a longer 52-period range, so it is flatter and often acts as stronger support or resistance.
Chikou Span (lagging span)
The Chikou Span is today’s closing price shifted 26 periods back. If it sits above past prices, the trend is likely bullish. If it sits below, the trend is likely bearish. It is a simple way to check whether current price is stronger or weaker than it was a month or so ago.
How to Read the Cloud (Kumo)
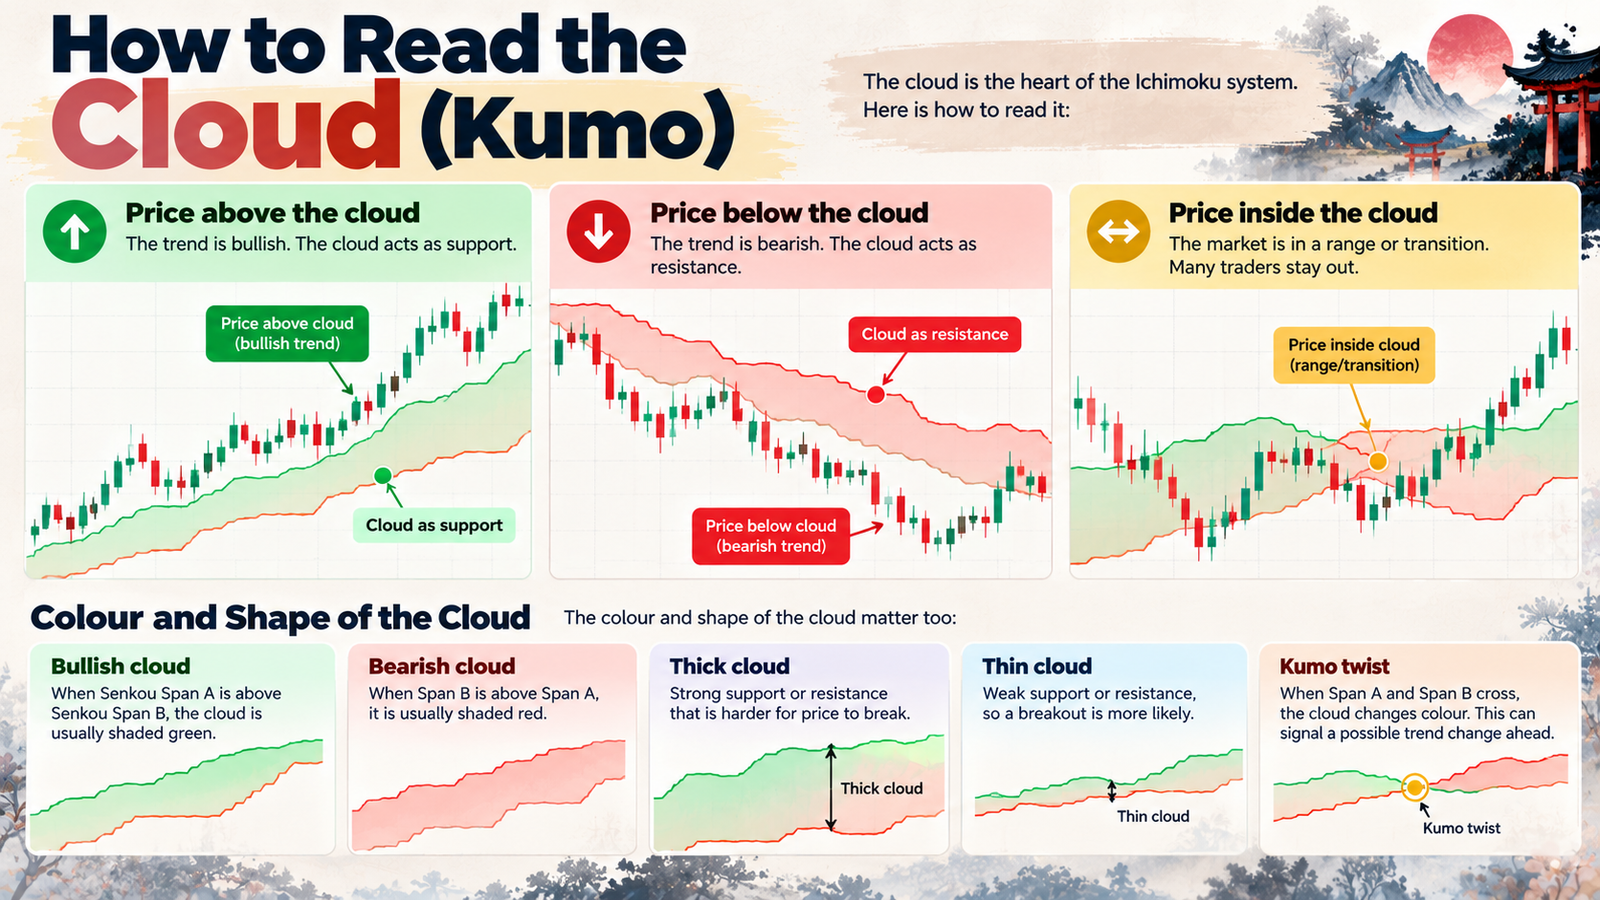
The cloud is the heart of the Ichimoku system. Here is how to read it:
- Price above the cloud: The trend is bullish. The cloud acts as support.
- Price below the cloud: The trend is bearish. The cloud acts as resistance.
- Price inside the cloud: The market is in a range or transition. Many traders stay out.
The colour and shape of the cloud matter too:
- Bullish cloud: When Senkou Span A is above Senkou Span B, the cloud is usually shaded green.
- Bearish cloud: When Span B is above Span A, it is usually shaded red.
- Thick cloud: Strong support or resistance that is harder for price to break.
- Thin cloud: Weak support or resistance, so a breakout is more likely.
- Kumo twist: When Span A and Span B cross, the cloud changes colour. This can signal a possible trend change ahead.
 Key Ichimoku Cloud Trading Signals
1. Kumo breakout
A Kumo breakout happens when price closes above or below the cloud after spending time inside or on the other side of it. A close above the cloud is bullish, and a close below is bearish. Breakouts through a thin cloud are easier, but breakouts through a thick cloud are often more meaningful.
2. TK cross
The TK cross is when the Tenkan-sen crosses the Kijun-sen. A bullish TK cross happens when the Tenkan-sen crosses above the Kijun-sen. Its strength depends on where it happens:
| Location of a bullish TK cross | Signal strength |
|---|---|
| Above the cloud | Strong |
| Inside the cloud | Neutral |
| Below the cloud | Weak |
For a bearish TK cross, the logic is reversed: strongest below the cloud and weakest above it.
3. Kijun-sen bounce
In a strong trend, price often pulls back to the Kijun-sen and then resumes the trend. Traders watch for a bounce off this line as a lower-risk entry.
4. Chikou Span confirmation
Many traders only take a long trade if the Chikou Span is above price from 26 periods ago and is not running into the cloud. It acts as a final filter to avoid weak signals.
5. Kumo twist
A change in cloud colour ahead of price can hint at an upcoming change in trend. It is an early warning rather than an entry signal on its own.
A Simple Ichimoku Cloud Trading Strategy
Here is a beginner-friendly long setup. Reverse every rule for a short trade.
- Trend filter: Price must be above the cloud.
- Cloud colour: The future cloud should be bullish, with Senkou Span A above Span B.
- Momentum: The Tenkan-sen should be above the Kijun-sen, ideally after a fresh bullish TK cross.
- Confirmation: The Chikou Span should be above the price from 26 periods ago.
- Entry: Buy on a pullback to the Tenkan-sen or Kijun-sen, or on a close above a recent high.
- Stop loss: Place it below the Kijun-sen or below the cloud, depending on your risk tolerance.
- Exit: Trail your stop along the Kijun-sen, or exit when price closes back below it.
When all five components agree, traders call it a strong Ichimoku signal. If only some agree, the trade has lower odds, and many traders skip it.
Ichimoku Cloud Example on EUR/USD
Imagine EUR/USD on a daily chart. Price has been moving sideways inside a thin red cloud. Then it closes above the cloud, a Kumo breakout. A few days later, the Tenkan-sen crosses above the Kijun-sen above the cloud, a strong bullish TK cross. The cloud ahead turns green, and the Chikou Span moves above past price.
A trader using Ichimoku might buy on the first pullback to the Kijun-sen, place a stop below the cloud, and trail the stop along the Kijun-sen as the trend develops. The trade is closed when price finally closes below the Kijun-sen.
This example is illustrative and does not refer to real prices.
Ichimoku Cloud Settings
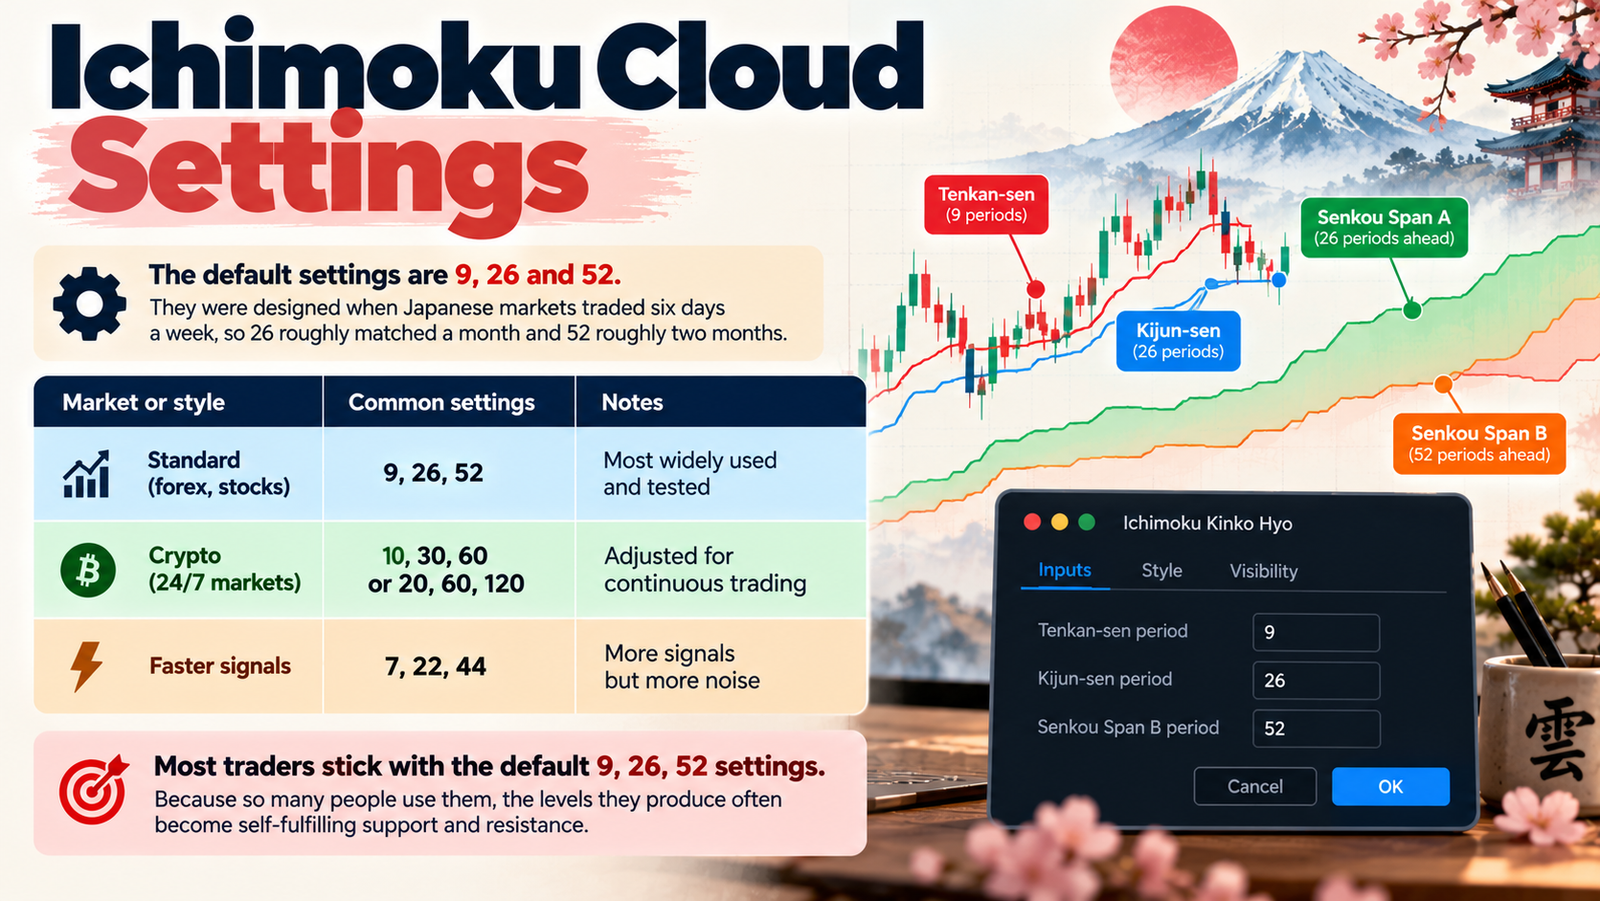
The default settings are 9, 26 and 52. They were designed when Japanese markets traded six days a week, so 26 roughly matched a month and 52 roughly two months.
| Market or style | Common settings | Notes |
|---|---|---|
| Standard (forex, stocks) | 9, 26, 52 | Most widely used and tested |
| Crypto (24/7 markets) | 10, 30, 60 or 20, 60, 120 | Adjusted for continuous trading |
| Faster signals | 7, 22, 44 | More signals but more noise |
Most traders stick with the default 9, 26, 52 settings. Because so many people use them, the levels they produce often become self-fulfilling support and resistance.
Best Timeframes for the Ichimoku Cloud
The Ichimoku Cloud works best on timeframes where trends have room to develop. The daily and 4-hour charts are popular for swing traders, while the weekly chart helps position traders see the bigger picture. On very short timeframes, such as 1-minute or 5-minute charts, the indicator tends to give more false signals because of random price noise.
A useful approach is to check the Ichimoku Cloud on a higher timeframe for trend direction, then use a lower timeframe for entries in that direction.
Strengths and Limitations
Strengths
- All-in-one: Trend, momentum and support and resistance in one indicator.
- Forward-looking: The cloud projects potential support and resistance into the future.
- Clear rules: Signals are easy to define and test.
- Works across markets: Forex, stocks, indices, commodities and crypto.
Limitations
- Busy charts: Five lines plus a cloud can look cluttered at first.
- Lagging in ranges: In sideways markets, price crosses lines often, creating false signals.
- Late entries: Waiting for every component to agree can mean missing the early part of a move.
- Not a standalone system: It works best with sound risk management and awareness of major news.
Common Ichimoku Cloud Mistakes
- Trading inside the cloud: Price inside the Kumo often means indecision. Waiting for a clear break usually pays off.
- Ignoring the Chikou Span: Skipping this filter leads to more weak trades.
- Treating every TK cross the same: A cross below the cloud is much weaker than one above it.
- Over-tweaking settings: Changing settings to fit past data rarely helps in live trading.
- Using it on tiny timeframes: Noise on very short charts makes the indicator less reliable.
- Forgetting risk management: No indicator removes the need for stops and sensible position sizes.
Ichimoku Cloud vs Moving Averages
Moving averages and the Ichimoku Cloud both track trends, but they work differently. A moving average uses closing prices and shows a single line. Ichimoku uses midpoints of highs and lows, combines several timeframes in one view, and projects the cloud into the future. If you already use the 20-day and 50-day moving averages, you can think of the Tenkan-sen and Kijun-sen as similar fast and slow lines, with the cloud adding an extra layer of context.
FAQs
What does Ichimoku mean?
Ichimoku Kinko Hyo roughly means “one glance equilibrium chart” in Japanese, reflecting the goal of reading the market at a glance.
What do the colours of the cloud mean?
A green cloud usually means Senkou Span A is above Span B, which is bullish. A red cloud means Span B is above Span A, which is bearish.
Is the Ichimoku Cloud good for beginners?
Yes, once you learn the five lines. Start by using only the cloud as a trend filter, then add the other signals step by step.
What is the best Ichimoku setting?
The default 9, 26, 52 is the most widely used. Some crypto traders adjust it for 24/7 markets.
Can the Ichimoku Cloud be used for crypto and stocks?
Yes. It works on any market with enough liquidity and clear trends.
Conclusion
The Ichimoku Cloud may look complicated, but its logic is simple: stay with the trend, buy strength above the cloud, sell weakness below it, and stay cautious when price is inside the cloud. Its five lines, the Tenkan-sen, Kijun-sen, Senkou Span A, Senkou Span B and Chikou Span, each add a piece of the puzzle.
Start by using the Ichimoku Cloud as a trend filter on the daily chart. Once that feels natural, add TK crosses, Kijun-sen bounces and Chikou Span confirmation. Practise on a demo account, combine it with solid risk management, and over time this “one glance” indicator can give you a clear, structured view of any market.
Disclaimer: This article is for education only and is not investment or trading advice. Trading involves a high risk of loss. Practise on a demo account and consult a registered financial adviser before trading.