
Introduction
Have you ever watched price break out of a quiet range, hit your stop loss, and then race off in the direction you originally expected? If so, you have already seen the idea behind the ICT Power of 3.
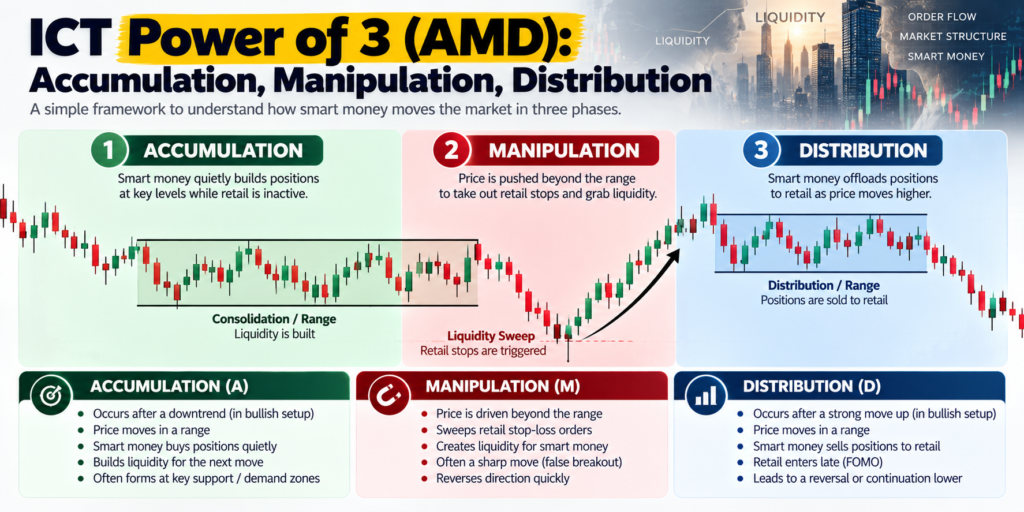
The concept comes from Michael J. Huddleston, better known as the Inner Circle Trader (ICT). It describes a three-stage pattern that many traders believe repeats across days, weeks and individual sessions: accumulation, manipulation and distribution. Traders often shorten it to AMD or PO3.
This guide to the ICT Power of 3 covers:
- What each phase of AMD trading looks like on a chart
- How the Judas swing and liquidity sweeps fit in
- How traders combine PO3 with daily bias, sessions and killzones
- A step-by-step example, common mistakes and honest limitations
What Is the ICT Power of 3?
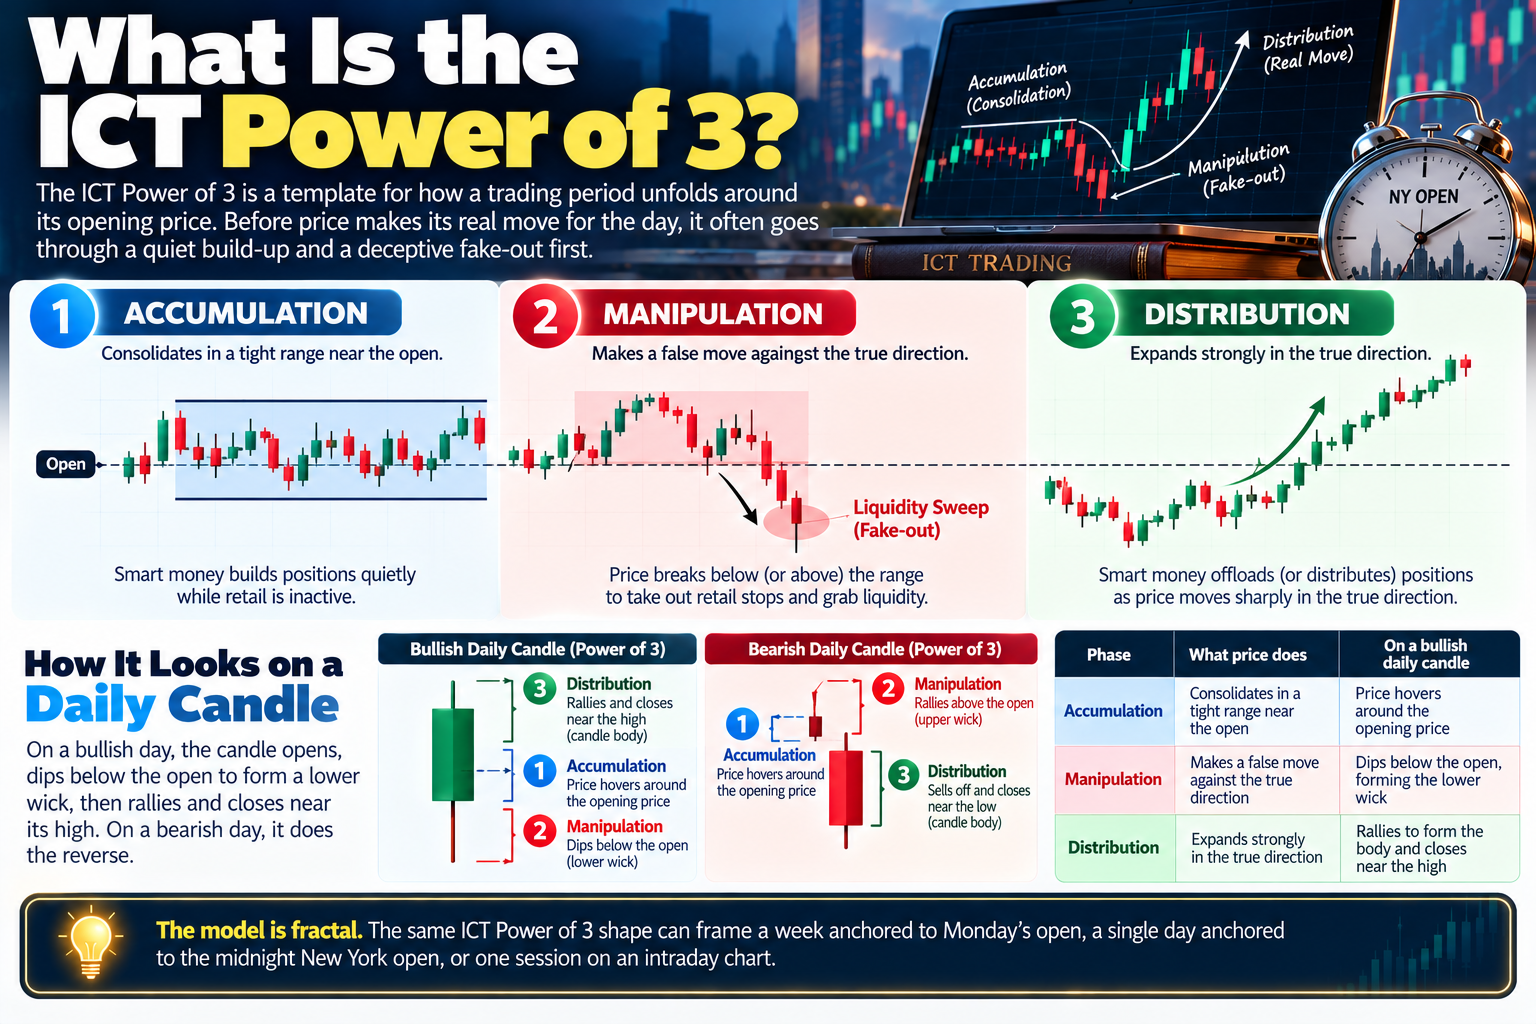
The ICT Power of 3 is a template for how a trading period unfolds around its opening price. The idea is simple: before price makes its real move for the day, it often goes through a quiet build-up and a deceptive fake-out first.
A useful way to picture it is a single daily candle. On a bullish day, the candle opens, dips below the open to form a lower wick, then rallies and closes near its high. On a bearish day, it does the reverse. Those three parts of the candle, the open, the wick and the body, map onto the three phases of the ICT Power of 3.
| Phase | What price does | On a bullish daily candle |
|---|---|---|
| Accumulation | Consolidates in a tight range near the open | Price hovers around the opening price |
| Manipulation | Makes a false move against the true direction | Dips below the open, forming the lower wick |
| Distribution | Expands strongly in the true direction | Rallies to form the body and closes near the high |
The model is fractal. The same ICT Power of 3 shape can frame a week anchored to Monday’s open, a single day anchored to the midnight New York open, or one session on an intraday chart.
Phase 1: Accumulation
Accumulation is the quiet phase. Price moves sideways in a narrow range near the opening price, and volatility is low. In smart money concepts, this is when larger players are said to be building positions without moving price much.
What to look for:
- A tight consolidation with small candles
- Equal highs or equal lows forming at the edges of the range
- Retail breakout traders placing orders just above and below the range
Those clustered stop losses and breakout orders matter, because they become the fuel for the next phase. In intraday PO3 analysis, the Asian session is often treated as the accumulation phase for forex pairs.
Phase 2: Manipulation (the Judas Swing)
Manipulation is the trap. Price breaks out of the accumulation range in the wrong direction, triggering stop losses and pulling in breakout traders. ICT calls this false move the Judas swing, because it betrays traders who follow it.
This is where the liquidity sweep happens. Price runs through obvious levels such as the previous session’s high or low, the edge of the Asian range, or a cluster of equal highs or lows. Once those orders are filled, the move often stalls and reverses.
Signs that manipulation may be complete:
- A sharp push through a clear liquidity pool that fails to hold
- A long wick or rejection candle at the extreme
- A market structure shift on a lower timeframe in the opposite direction
- Price moving back through the opening price
The manipulation leg is the most important part of the model for entries, because it often marks the high or low of the day.
Phase 3: Distribution
Distribution is the real move. After the trap, price expands away from the manipulation extreme with strong momentum, often called displacement. This leg typically leaves fair value gaps behind it as price moves quickly through levels.
In a textbook AMD day, distribution carries price to the opposite end of the day’s range, and the candle closes near its high on a bullish day or its low on a bearish day. Traders aim to ride this phase, either by entering at the end of manipulation or by joining on a pullback into a fair value gap or order block.
Importantly, the distribution leg is what confirms the pattern. Until price expands in the opposite direction, a move through the range could simply be a genuine breakout rather than manipulation.
ICT Power of 3 and the Trading Sessions
For forex traders, the ICT Power of 3 is often mapped onto the daily session cycle. Times below are in New York time, as ICT teaches, with Indian Standard Time shown for readers in India (during US daylight saving time):
| Session | Typical role in PO3 | Approx. time (NY) | Approx. time (IST) |
|---|---|---|---|
| Asian session | Accumulation: range forms | 7:00 pm – midnight | 4:30 am – 9:30 am |
| London killzone | Manipulation: Judas swing | 2:00 am – 5:00 am | 11:30 am – 2:30 pm |
| New York killzone | Distribution or continuation | 7:00 am – 10:00 am | 4:30 pm – 7:30 pm |
ICT killzones are windows when volatility and volume tend to rise, which is why they are used to time entries. Exact times vary between educators, and IST times shift by an hour when US clocks change, so treat these as guides rather than rules.
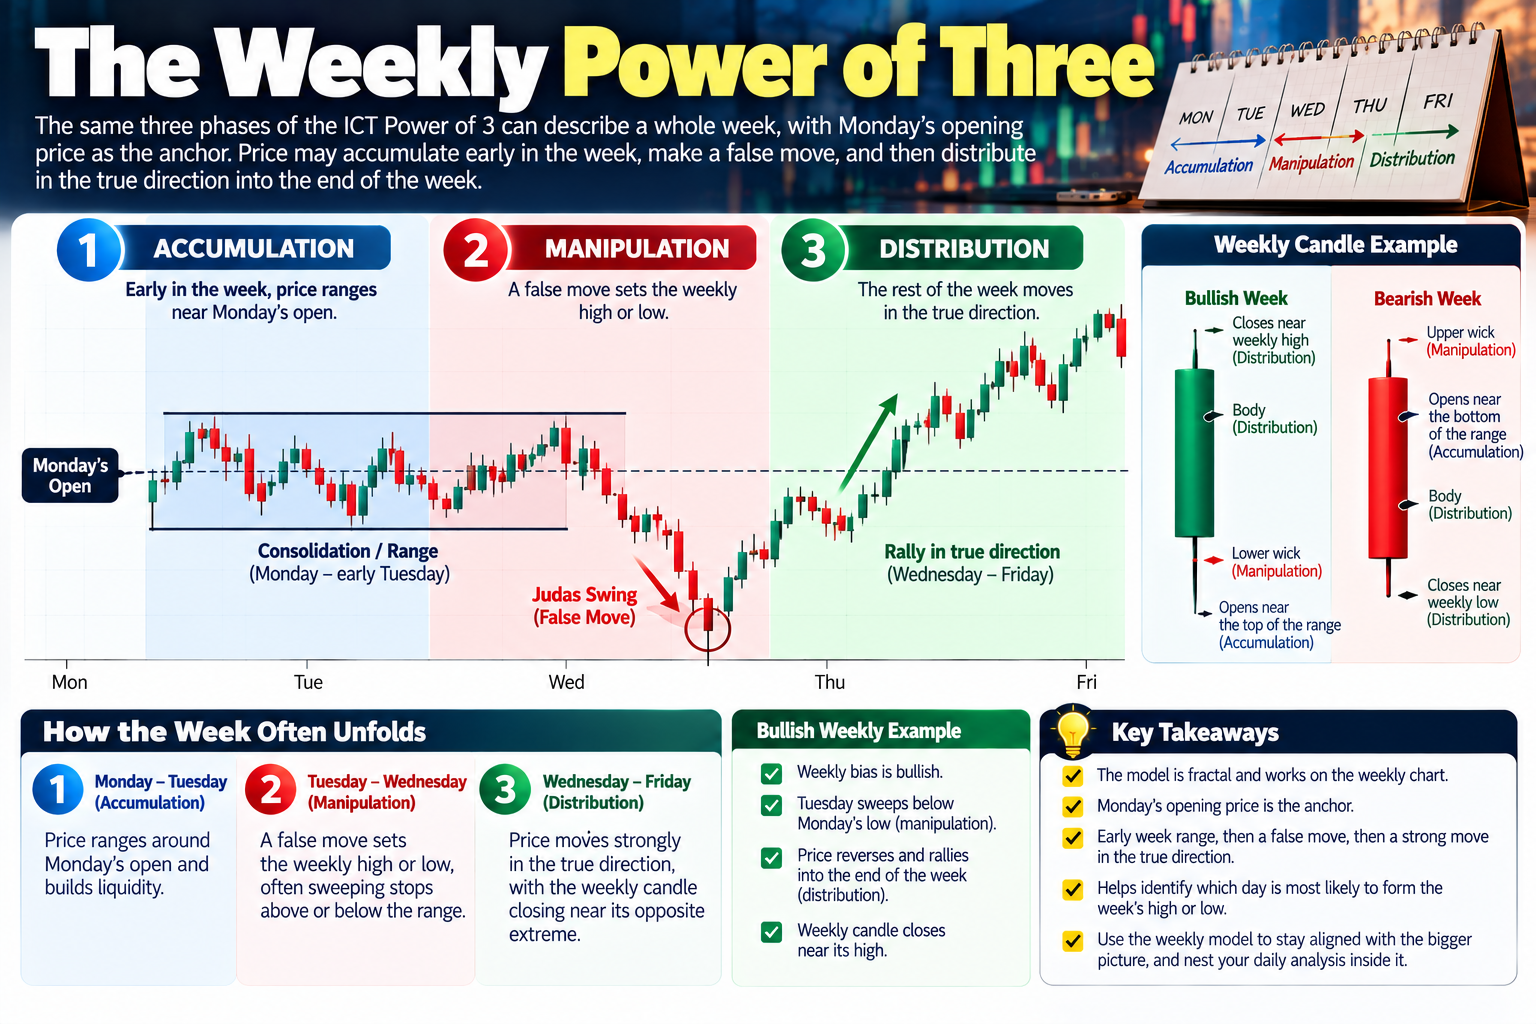
The Weekly Power of Three
Because the model is fractal, the same three phases can describe a whole week. Here the anchor is Monday’s opening price. Early in the week, often Monday and Tuesday, price may range and then make a false move that sets the weekly high or low. The middle and end of the week then carry the distribution leg, with the weekly candle closing near its opposite extreme.
Traders use this to narrow down which day is most likely to form the week’s high or low. If the weekly bias is bullish and Tuesday sweeps below Monday’s low before reversing, that Tuesday low may hold for the rest of the week. Nesting a daily model inside the weekly one helps traders stay aligned with the bigger picture instead of fighting it.
Using Daily Bias with PO3
The ICT Power of 3 works best when you already have a view on the day’s direction, known as daily bias. Without a bias, you can’t tell which side of the open is the trap and which is the real move.
Traders build daily bias from higher-timeframe analysis, such as:
- Weekly and daily market structure (higher highs and higher lows, or the reverse)
- Where price sits relative to recent highs and lows, or premium and discount zones
- Unfilled fair value gaps or liquidity pools on the daily chart
- Major news events, such as central bank decisions or jobs data
With a bullish bias, you expect the manipulation phase to push price below the opening price first. You then look for buying opportunities once price sweeps liquidity below and reclaims the open. With a bearish bias, the logic flips.
How to Trade the ICT Power of 3: Step by Step
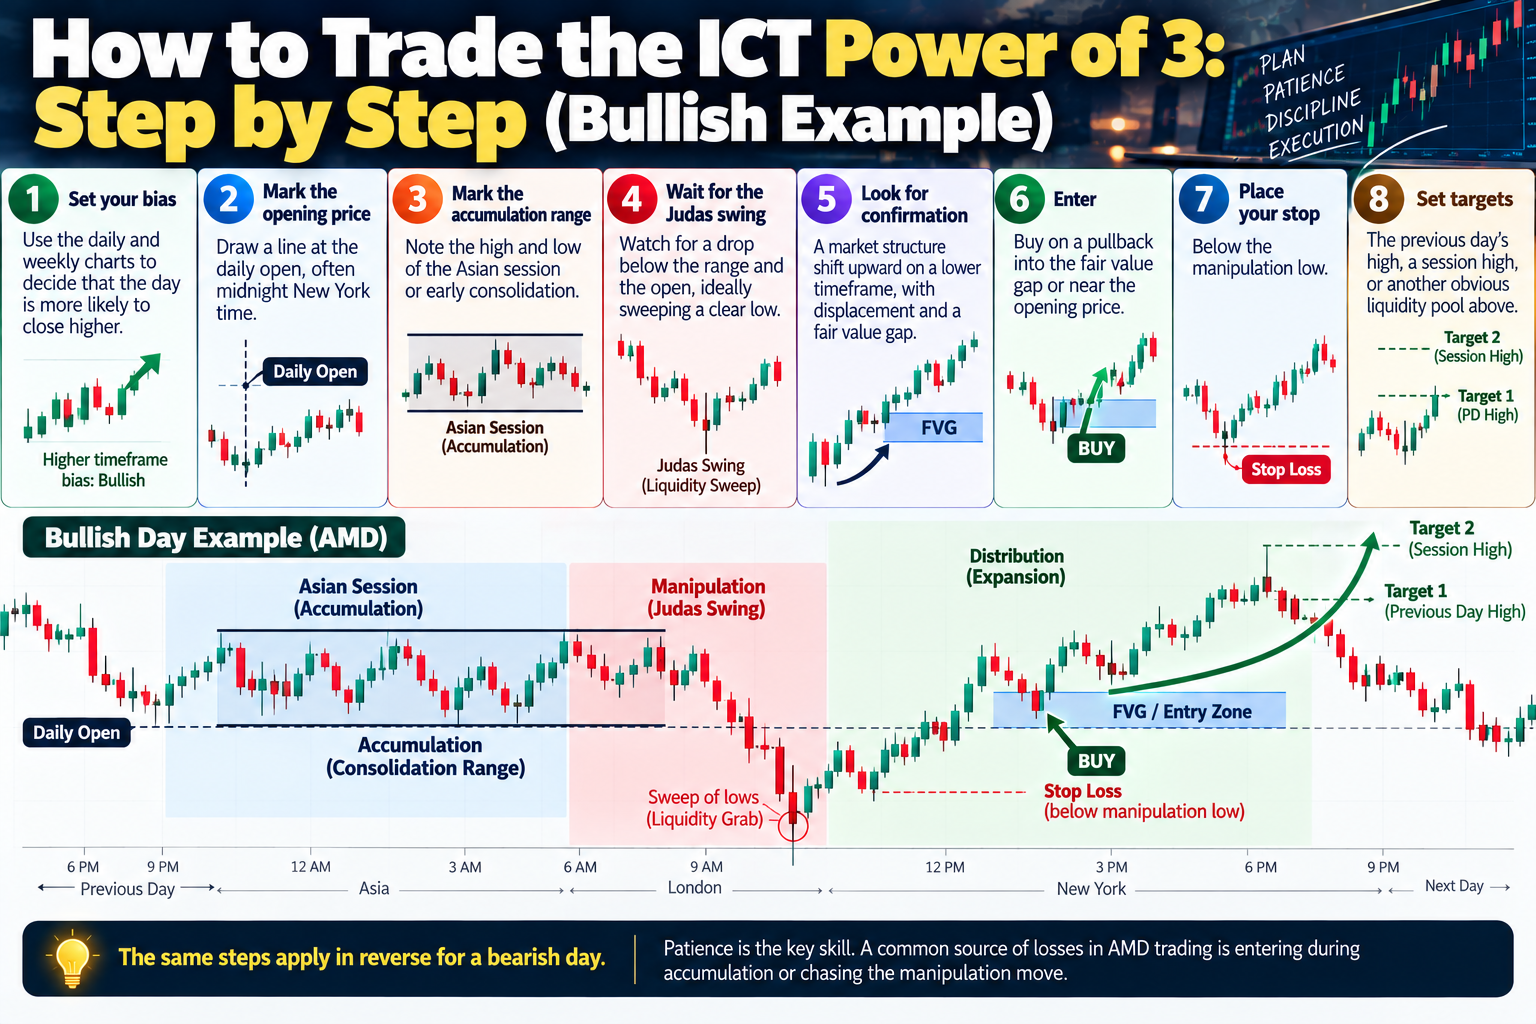
Here is a simple framework many traders use when applying power of three trading to a bullish day:
- Set your bias: Use the daily and weekly charts to decide that the day is more likely to close higher.
- Mark the opening price: Draw a line at the daily open, often midnight New York time.
- Mark the accumulation range: Note the high and low of the Asian session or early consolidation.
- Wait for the Judas swing: Watch for a drop below the range and the open, ideally sweeping a clear low.
- Look for confirmation: A market structure shift upward on a lower timeframe, with displacement and a fair value gap.
- Enter: Buy on a pullback into the fair value gap or near the opening price.
- Place your stop: Below the manipulation low.
- Set targets: The previous day’s high, a session high, or another obvious liquidity pool above.
The same steps apply in reverse for a bearish day. Patience is the key skill: a common source of losses in AMD trading is entering during accumulation or chasing the manipulation move.
A Worked Example on EUR/USD
Imagine your daily bias on EUR/USD is bullish. The day opens at 1.1200. During the Asian session, price ranges between 1.1190 and 1.1210.
At the London open, price drops to 1.1175, sweeping the Asian low and the previous day’s low. That is the manipulation phase. On the 5-minute chart, price then breaks back above a recent swing high, leaving a fair value gap between 1.1185 and 1.1190.
You buy at 1.1188 with a stop below 1.1172. Price reclaims the open, expands through the New York session and reaches 1.1250 near the previous day’s high. That is a textbook ICT Power of 3 day: a quiet range, a fake drop and a strong rally to close near the highs.
This example is illustrative and uses hypothetical prices.
ICT Power of 3 vs the Wyckoff Method
The ideas behind AMD are not entirely new. Richard Wyckoff described accumulation and distribution phases in the early 20th century, including the “spring”, a false break below support that resembles the Judas swing. The key differences:
- Timeframe: Wyckoff schematics often play out over weeks or months, while the ICT Power of 3 is commonly applied to a single day or session.
- Tools: Wyckoff relies heavily on volume, while ICT focuses on time, the opening price and liquidity.
- Structure: Wyckoff uses named events and phases, while PO3 is a simpler three-step template.
Common Mistakes with the ICT Power of 3
- Trading without a bias: You can’t identify the trap if you don’t know the likely direction.
- Entering during accumulation: The range often breaks the wrong way first.
- Mistaking a real breakout for manipulation: Wait for confirmation through a market structure shift and displacement.
- Forcing the pattern: Many days trend from the open with no clear manipulation leg.
- Ignoring news: High-impact data can override the normal session rhythm.
- Poor risk management: No model works every time, so keep risk per trade small.
Limitations of the ICT Power of 3
It is worth being honest about what the ICT Power of 3 can and cannot do. The pattern is easy to see in hindsight but much harder to identify in real time. Many sessions do not follow the template, and there is no peer-reviewed evidence that it consistently predicts price.
That is why most experienced traders treat PO3 as a framing tool, a way to organise the day, rather than a standalone signal. It is most useful when combined with sound risk management, a clear trading plan and thorough backtesting on the markets you trade.
FAQs
What does AMD stand for in trading?
Accumulation, manipulation and distribution, the three phases of the ICT Power of 3 model.
What is the Judas swing?
The false move during the manipulation phase that runs against the day’s true direction, sweeps liquidity, and then reverses.
Which timeframes does PO3 work on?
It is fractal, so traders apply it to weekly, daily and intraday charts. The daily candle is the most common starting point.
Can beginners use the ICT Power of 3?
Yes, as a way to understand price behaviour, but practise on a demo account and backtest before risking real money.
Conclusion
The ICT Power of 3 offers a clear way to think about how price moves: a quiet build-up, a deceptive trap and a strong expansion. Understanding accumulation, manipulation and distribution can help you avoid being stopped out by the Judas swing and instead position yourself for the real move.
Start by marking the opening price, setting a daily bias and watching how each session plays out. Over time, you will learn when the ICT Power of 3 is in play and, just as importantly, when it isn’t.
Disclaimer: This article is for education only and is not investment or trading advice. Trading forex and other leveraged products carries a high risk of loss. Practise on a demo account and consult a registered adviser before trading.