
Introduction
Many beginners learn order blocks, fair value gaps and OTE, then find their entries keep failing. Often the setup itself was fine; it just pointed the wrong way. In smart money concepts (SMC), the first job is to decide which direction you’re trading, based on a higher time frame. That’s what higher timeframe bias SMC traders mean by “HTF bias”: a clear, rule-based view of whether you should be looking for buys, sells, or nothing at all.
Quick answer: To mark higher-timeframe bias, choose one higher time frame (for example daily for 1-hour entries), then check three things: market structure (is price making higher highs and higher lows after a bullish break of structure, or the opposite?), premium or discount (is price above or below the 50% level of the current dealing range?), and draw on liquidity (which obvious high or low is price likely heading toward?). If they agree, you have a bias: bullish means only look for buys in discount; bearish means only look for sells in premium. Mark an invalidation level that would flip or cancel the bias, and stay flat when signals conflict.
Why this matters
- Trading with the higher-timeframe direction reduces the number of low-quality, counter-trend trades.
- A written bias with an invalidation level stops you from flip-flopping every hour.
- Indian traders can apply this to permitted pairs such as USD/INR futures on NSE or BSE, through a SEBI-registered broker. Many SMC examples online use offshore pairs and platforms that aren’t permitted for residents.
What is higher-timeframe bias?
Higher-timeframe bias is your directional view on a larger chart, used to filter trades on a smaller one. It answers one question: “Should I be looking for buys, sells, or neither today?”
It isn’t a prediction that price will go up or down. It’s a rule that keeps your lower-timeframe entries aligned with the bigger picture, and it changes when the higher timeframe tells you it has changed.
Common timeframe pairings
| Trading style | Bias timeframe | Setup timeframe | Entry timeframe |
|---|---|---|---|
| Swing trader | Weekly | Daily | 4-hour |
| Day trader | Daily | 4-hour or 1-hour | 15-minute |
| Intraday scalper | 4-hour | 1-hour | 5-minute |
A common rule of thumb is a ratio of about 4–6× between timeframes. Pick one set and stick with it.
Three ways to read HTF bias
1. Market structure
- Break of structure (BOS): price breaks a prior swing in the direction of the trend, confirming continuation. Higher highs and higher lows point to bullish structure; lower lows and lower highs point to bearish.
- Change of character (CHoCH): the first break against the prevailing trend, an early warning that bias may be shifting.
- Many SMC traders use candle closes, not wicks, beyond the swing to confirm a break.

2. Premium and discount of the dealing range
Mark the current dealing range (the latest significant swing low to swing high, or vice versa) and its 50% level.
- Above 50% = premium, a better area to sell in a bearish bias.
- Below 50% = discount, a better area to buy in a bullish bias.
- Bullish bias plus price in premium usually means wait, not buy now.
3. Draw on liquidity
Ask where price is likely to be drawn next: obvious previous highs or lows, equal highs or lows, or the previous day’s or week’s high or low. In SMC terms, these are pools of resting orders (stop-losses and breakout entries).
- In a bullish bias, the draw is usually an old high above.
- In a bearish bias, the draw is usually an old low below.
Putting it together: bias states
| Structure | Price location | Draw on liquidity | Bias | What to do |
|---|---|---|---|---|
| Bullish (HH/HL, bullish BOS) | Discount | Old high above | Bullish | Look for buys on lower timeframes |
| Bullish | Premium | Old high above | Bullish, but wait | Wait for a pullback into discount |
| Bearish (LL/LH, bearish BOS) | Premium | Old low below | Bearish | Look for sells on lower timeframes |
| Bearish | Discount | Old low below | Bearish, but wait | Wait for a pullback into premium |
| Conflicting (e.g. recent CHoCH) | Mid-range | Unclear | Neutral | Stay flat or reduce size |
Mark an invalidation level
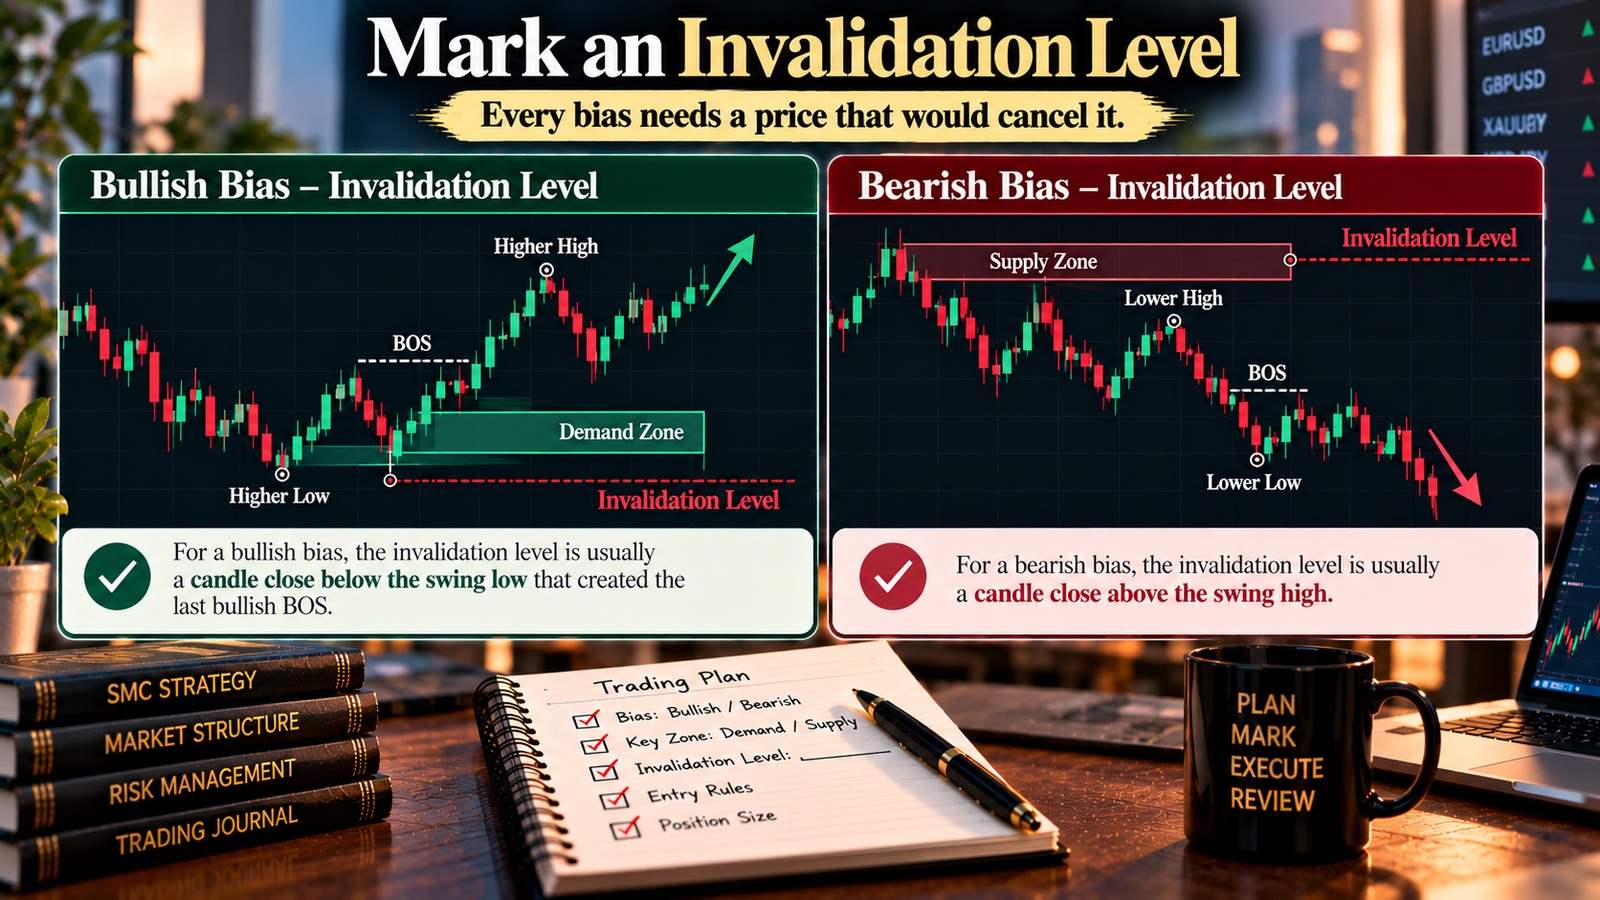
Every bias needs a price that would cancel it. For a bullish bias, that’s usually a candle close below the swing low that created the last bullish BOS. For a bearish bias, it’s a close above the swing high. Write it down with your bias so you don’t argue with the chart later.
Step-by-step: a top-down routine
- Weekly (context): is structure making higher highs and higher lows, or lower lows and lower highs? Mark the last major swing high and low.
- Daily (bias): identify the latest BOS or CHoCH, the current dealing range, and its 50% level.
- Locate price: premium or discount within the daily range?
- Draw on liquidity: mark the obvious high or low price is likely heading toward.
- Write the bias: bullish, bearish or neutral, with an invalidation level.
- Setup timeframe (4H or 1H): wait for price to reach your zone (discount for longs, premium for shorts) and for a lower-timeframe shift in your bias direction.
- Plan the trade: entry, stop beyond the lower-timeframe swing, target short of the draw on liquidity, size from fixed risk.
- Review daily: only change bias when the invalidation level is hit or structure clearly changes.
Worked example: USD/INR futures (illustrative)
Prices are round illustrative numbers, not a forecast.
| Timeframe | Observation | Conclusion |
|---|---|---|
| Weekly | Higher highs and higher lows over recent months | Context bullish |
| Daily | Bullish BOS above a prior high; dealing range 94.80 → 96.20; 50% = 95.50 | Bias bullish |
| Daily | Price pulls back to 95.30, below 95.50 | In discount: look for buys |
| Daily | Equal highs around 96.20–96.25 | Draw on liquidity above |
| Daily | Invalidation: daily close below 94.80 | Bias cancelled if hit |
| 4-hour | Sweep of a minor low to 95.15, then bullish CHoCH | Entry trigger in bias direction |
Trade plan
NSE USD/INR: one lot = $1,000, so a ₹0.01 move = ₹10 per lot.
| Item | Value |
|---|---|
| Entry (buy) | 95.30 |
| Stop-loss (below the 4H sweep low, with buffer) | 95.10 |
| Target (just below the 96.20 draw on liquidity) | 96.00 |
| Risk per lot | (95.30 − 95.10) × 1,000 = ₹200 |
| Potential reward per lot | (96.00 − 95.30) × 1,000 = ₹700 |
| Reward-to-risk | 3.5 : 1 |
| Capital and risk | ₹1,00,000 at 1% = ₹1,000 |
| Position size | ₹1,000 ÷ ₹200 = 5 lots (risk ₹1,000; potential reward ₹3,500) |
Calculated in code; before brokerage, charges and slippage.
If a daily candle closes below 94.80, the bullish bias is invalidated. You’d stop looking for buys, even if lower-timeframe setups appear.
What does the evidence say?
Fact: Moskowitz, Ooi and Pedersen (2012, Journal of Financial Economics) documented significant “time series momentum” in 58 liquid futures markets, including currencies. Past 1–12-month returns tended to persist before partially reversing over longer horizons.
Analysis: That supports the general idea that trading in the direction of a larger-timeframe trend can make sense. But the study measures returns over months, not SMC structure, and it covers diversified portfolios, not single-pair discretionary trades. We found no peer-reviewed research testing SMC’s specific definitions of bias (BOS, CHoCH, premium and discount, draw on liquidity).
Fact: The idea of using a higher timeframe to filter trades is not unique to SMC. Classic multi-timeframe approaches, such as Alexander Elder’s “Triple Screen” method, use the same principle.
Learn more about ATR Indicator in Forex: Volatility and Stop Placement
Expert analysis
Fact: In SMC, higher-timeframe bias is usually read from market structure (BOS and CHoCH), price location within the dealing range (premium or discount), and the likely draw on liquidity. Academic research has found that returns in currency and other futures markets tend to persist over 1–12 months, while SMC’s specific bias definitions haven’t been tested in peer-reviewed studies.
Analysis: The value of HTF bias is mostly filtering: it removes half the possible trades (those against the bigger picture) and forces you to wait for price to reach better areas. The main risks are subjectivity (which swing counts?) and stubbornness (refusing to accept a changed bias). A written invalidation level addresses both.
Opinion: For beginners, simpler is better. Use one bias timeframe, closes rather than wicks for structure, the 50% level for premium and discount, and one obvious draw on liquidity. If you can’t state your bias in one sentence with an invalidation price, treat the day as neutral and stay flat.
Common mistakes
- Using too many timeframes, until the charts contradict each other.
- Changing bias after every lower-timeframe move.
- Treating a CHoCH as an instant reversal, rather than an early warning.
- Buying in premium just because the bias is bullish.
- Ignoring the invalidation level when it’s hit.
- Using wicks one day and closes the next to judge breaks.
- Forcing a bias on choppy, range-bound charts.
- Trading offshore pairs from SMC videos on platforms not permitted for Indian residents.
Myths vs facts
| Myth | Fact |
|---|---|
| “HTF bias tells you where price will go.” | It’s a filter based on current structure, not a prediction. |
| “Bullish bias means buy now.” | Bullish bias means look for buys in discount, with a lower-timeframe trigger. |
| “You must always have a bias.” | Neutral is a valid, useful state when signals conflict. |
| “SMC bias methods are scientifically proven.” | Research supports trend persistence in general, but SMC’s specific rules haven’t been tested in peer-reviewed studies. |
| “More timeframes give more confirmation.” | More timeframes often create more contradictions. |
Key takeaways
- HTF bias is your directional filter: buys, sells, or nothing.
- Read it from structure (BOS/CHoCH), premium or discount of the dealing range, and draw on liquidity.
- Use one consistent set of timeframes, such as weekly, daily and 4-hour.
- Always write an invalidation level, and accept neutral when signals conflict.
- Research on time-series momentum supports trading with larger trends in general, but SMC-specific rules are untested.
- Plan trades with fixed risk. In our example, 5 USD/INR lots risked ₹1,000 for a potential ₹3,500.
FAQs
- What is higher-timeframe bias in SMC? Your directional view on a larger chart, used to decide whether to look for buys, sells or no trades on smaller timeframes.
- Which timeframe should I use for bias? It depends on your style: weekly for swing traders, daily for day traders, 4-hour for intraday scalpers. Use a roughly 4–6× gap to your entry timeframe.
- How do I find daily bias? Check daily structure (latest BOS or CHoCH), whether price is in premium or discount of the dealing range, and the most obvious draw on liquidity.
- What is a break of structure (BOS)? A break of a prior swing in the direction of the trend, confirming continuation.
- What is a change of character (CHoCH)? The first break against the prevailing trend, an early sign that bias may be shifting.
- Should I use wicks or closes for structure breaks? Many SMC traders use candle closes to reduce false breaks. Whichever you choose, be consistent.
- What is premium and discount? The areas above (premium) and below (discount) the 50% level of the current dealing range.
- What is draw on liquidity? The obvious high or low price is likely heading toward, such as previous highs or lows or equal highs or lows.
- What if the weekly and daily disagree? Treat bias as neutral or reduce size until they align, or trade only in the direction of the higher one.
- How often should I update my bias? Review it daily, but change it only when your invalidation level is hit or structure clearly shifts.
- What is an invalidation level? A price that, if broken (usually on a candle close), cancels your current bias.
- Can I trade against the higher-timeframe bias? It’s possible, but counter-trend trades are harder. Beginners usually do better trading only with the bias.
- Is HTF bias the same as trend following? It’s closely related. SMC adds concepts such as premium and discount and draw on liquidity to the basic idea of trading with the larger trend.
- Does research support trading with the higher timeframe? Research on time-series momentum found returns tend to persist over 1–12 months in futures markets including currencies, but SMC-specific rules haven’t been tested in peer-reviewed studies.
- Can I use this on USD/INR? Yes, on NSE or BSE USD/INR futures through a SEBI-registered broker.
- What if the chart is choppy? Mark the bias as neutral and stay flat or reduce size. Forcing a bias in a range leads to poor trades.
- How do I record my bias? Write it in your journal each day: timeframe, bias, reason, key levels, invalidation and draw on liquidity.