Introduction
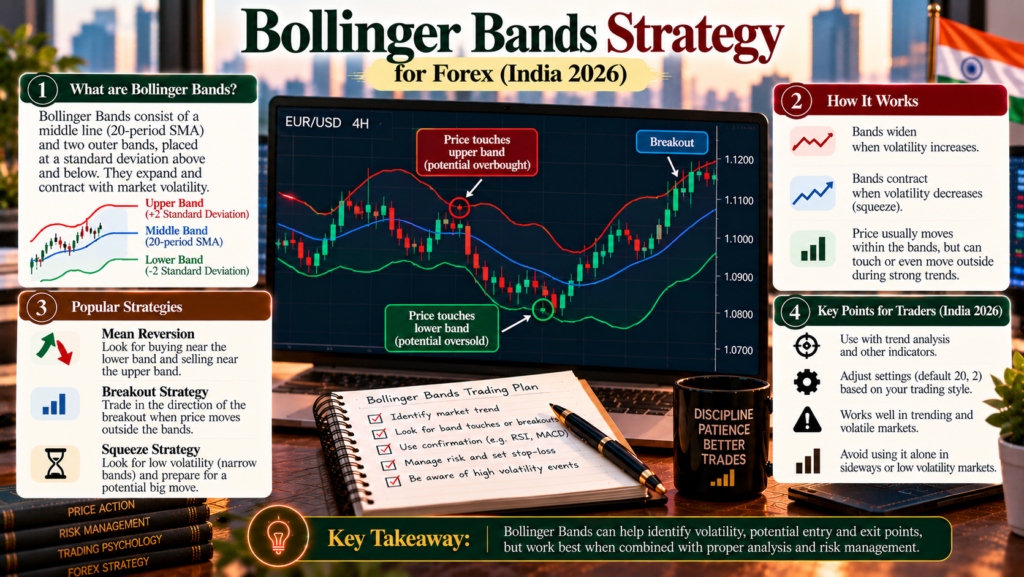
Bollinger Bands are the three lines that wrap around price on a chart: a middle average with an upper and lower band that widen when markets get volatile and narrow when they calm down. They’re popular because they adapt to changing conditions. But the most common beginner Bollinger Bands strategy, selling every touch of the upper band and buying every touch of the lower band, is exactly what the indicator’s creator warns against.
Quick answer: Bollinger Bands plot a 20-period simple moving average with bands 2 standard deviations above and below. They show whether price is relatively high or low compared with its recent range, and whether volatility is expanding or contracting. Traders use them in three main ways: buying near the lower band and selling near the upper band in ranges, watching for breakouts after a squeeze (bands narrowing sharply), and following trends when price walks the bands. A touch of a band isn’t a signal on its own, so combine the bands with trend, price action, a stop-loss and fixed risk.
Why this matters
- Fact: John Bollinger states that “tags of the bands are just that, tags not signals”, and that in trending markets price can walk up the upper band or down the lower band.
- Research on currencies suggests Bollinger Band rules held up better than simple moving-average rules in recent years, but results depend heavily on how they’re used.
- Indian traders can apply Bollinger Bands to permitted pairs such as USD/INR futures on NSE or BSE, through a SEBI-registered broker.
What are Bollinger Bands?
Bollinger Bands were developed by John Bollinger in the 1980s. They measure price relative to its recent average and volatility.
The formula (default settings)
| Line | Formula |
|---|---|
| Middle band | 20-period simple moving average (SMA) |
| Upper band | Middle band + 2 × standard deviation of the last 20 closes |
| Lower band | Middle band − 2 × standard deviation of the last 20 closes |
| %b | (Close − lower band) ÷ (upper band − lower band) |
| BandWidth | (Upper band − lower band) ÷ middle band |
Fact: Bollinger describes the 20-period and 2-standard-deviation settings as “just that, defaults”, not fixed rules.
Worked calculation (illustrative USD/INR closes)
Twenty daily closes drift up from 95.40 to 95.80, then jump to 95.95 on the last day.
| Item | Calculation | Result |
|---|---|---|
| Middle band (20 SMA) | Average of 20 closes | 95.6070 |
| Standard deviation | Population standard deviation of 20 closes | 0.1357 |
| Upper band | 95.6070 + 2 × 0.1357 | 95.8784 |
| Lower band | 95.6070 − 2 × 0.1357 | 95.3356 |
| %b (last close 95.95) | (95.95 − 95.3356) ÷ (95.8784 − 95.3356) | 1.13 |
| BandWidth | (95.8784 − 95.3356) ÷ 95.6070 | 0.57% |
Calculated in code; prices are illustrative.
Reading it: a %b above 1 means the close is above the upper band. That shows strength relative to the recent range, and on its own it is not a sell signal. If the trend is up, price may keep walking along the upper band.
How to read Bollinger Bands
| What you see | What it suggests |
|---|---|
| Price near the upper band | Relatively high versus the recent range |
| Price near the lower band | Relatively low versus the recent range |
| Bands narrowing sharply (squeeze) | Volatility has contracted; a larger move may follow, in either direction |
| Bands widening | Volatility expanding, often at the start of a move |
| Price walking the upper or lower band | A strong trend |
| Price crossing the middle band | A possible change in short-term direction |
A statistics caveat
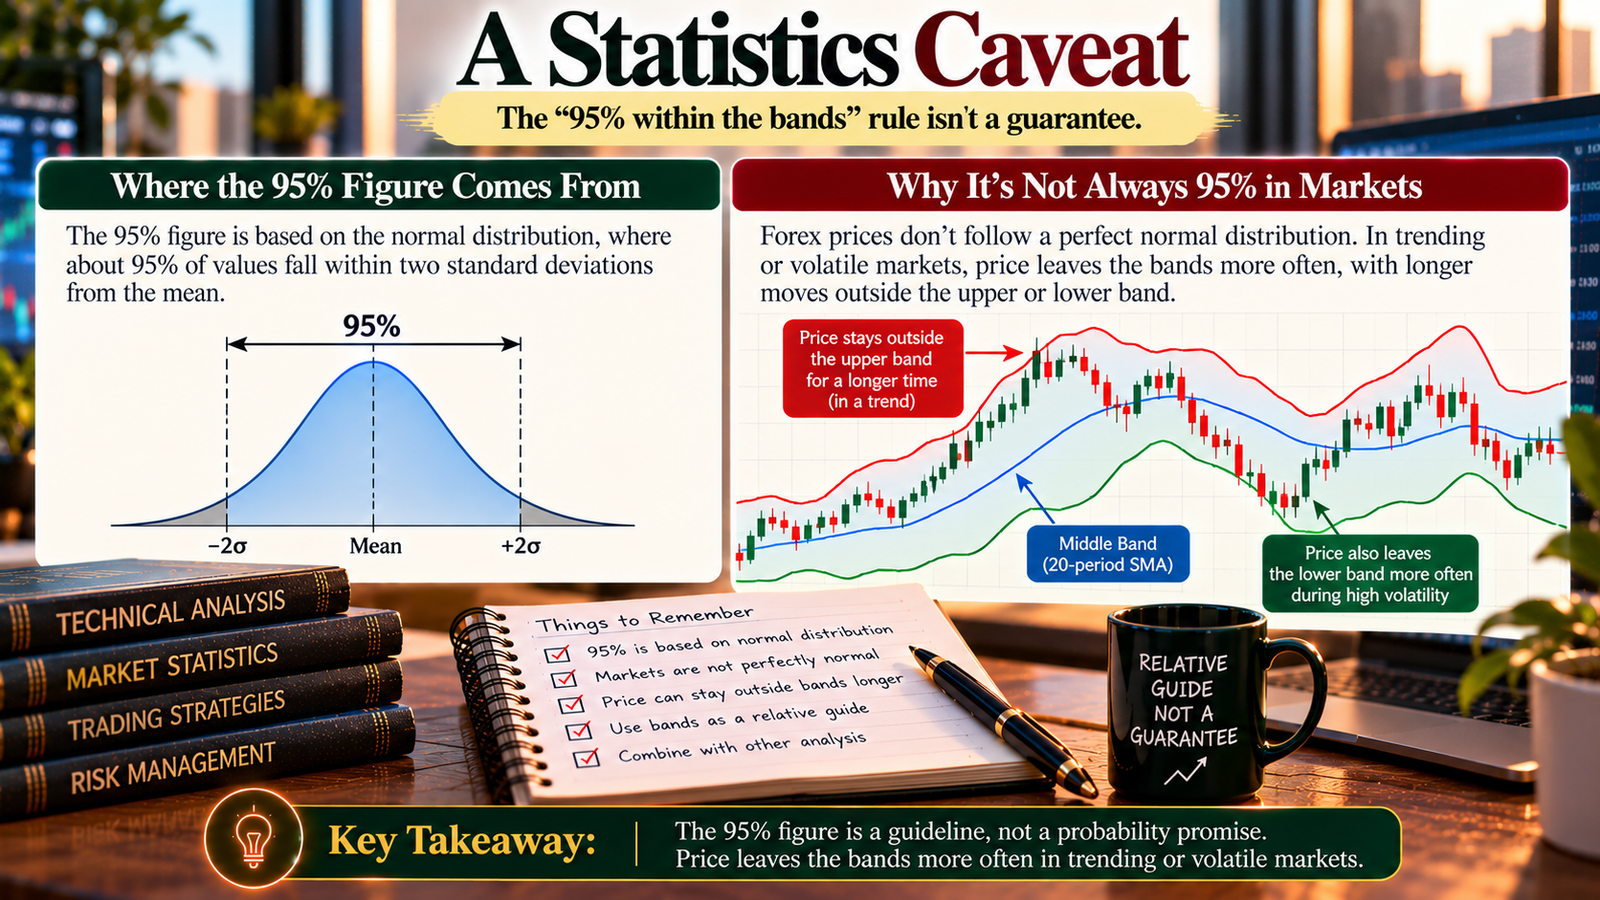
You may read that “95% of prices stay within the bands”. That figure comes from the normal distribution, and market prices don’t follow it neatly. Price leaves the bands more often in trending or volatile markets, so treat the bands as a relative guide, not a probability promise.
Three Bollinger Bands strategies
1. Mean reversion in ranges
When price is moving sideways between clear support and resistance, and the bands are relatively flat, traders look to buy near the lower band and sell near the upper band, targeting the middle band.
- Works best: in quiet, range-bound markets.
- Fails when: a breakout starts. Price then walks the band instead of reversing.
- Filter: confirm with a rejection candle, and avoid trading this way just before major news.
2. The squeeze (volatility breakout)
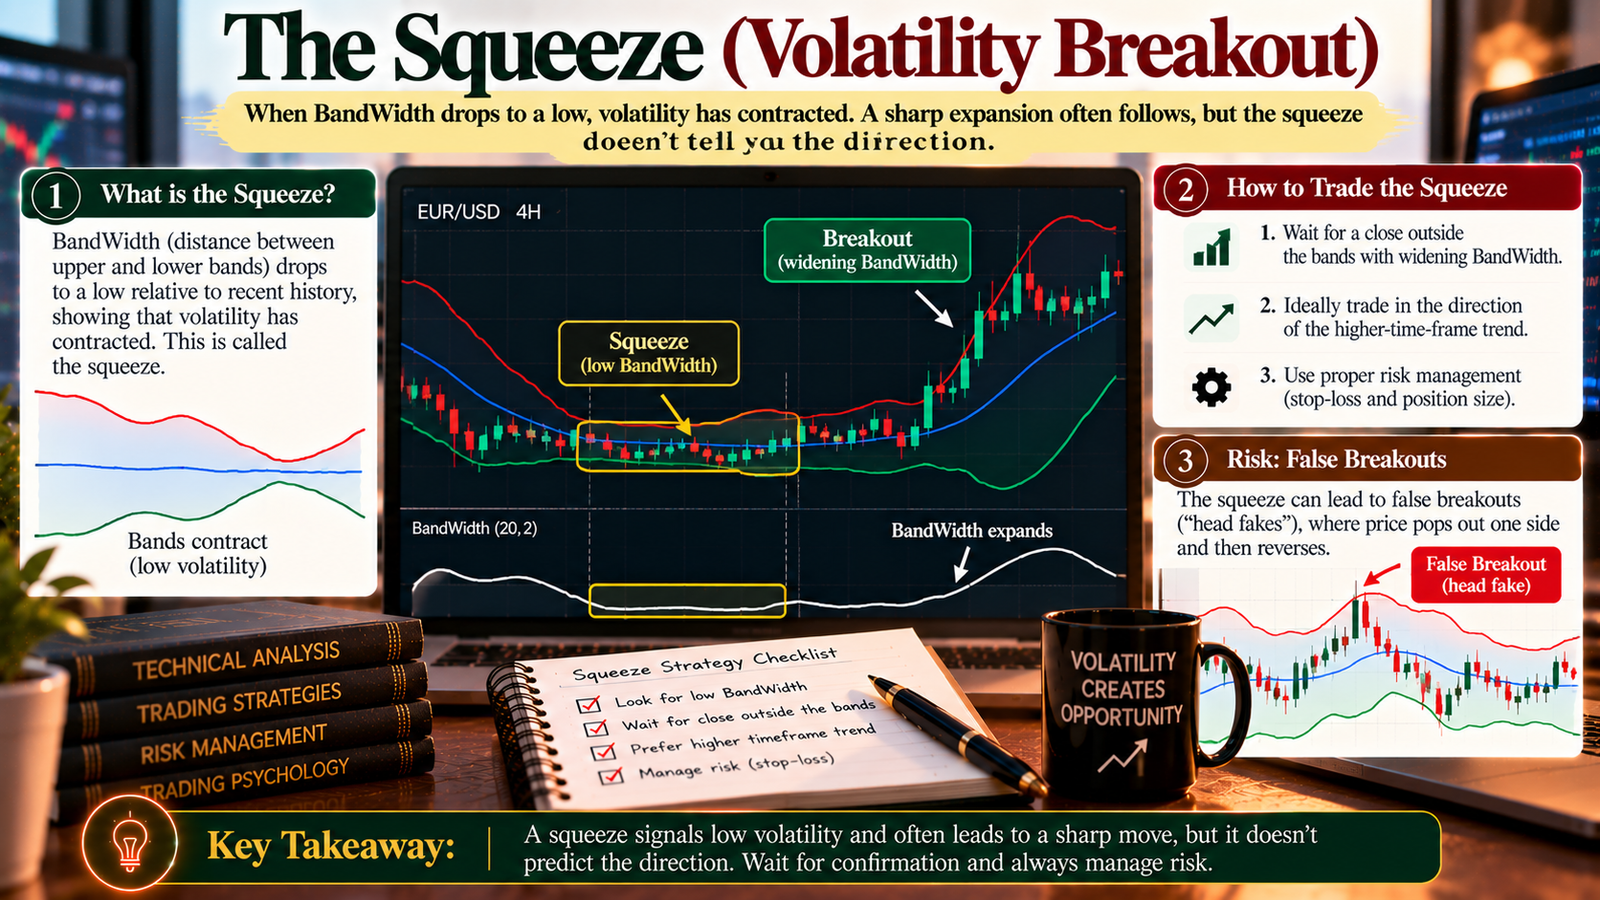
When BandWidth drops to a low relative to recent history, volatility has contracted. Bollinger calls this the squeeze. A sharp expansion often follows, but the squeeze doesn’t tell you the direction.
- Approach: wait for a close outside the bands with widening bandwidth, ideally in the direction of the higher-time-frame trend.
- Risk: false breakouts (“head fakes”) where price pops out one side and then reverses.
3. Walking the bands (trend following)
In strong trends, price repeatedly touches or closes outside one band. Traders use pullbacks to the middle band as entries in the trend’s direction, rather than selling upper-band touches.
Strategy comparison
| Strategy | Market condition | Entry idea | Main risk |
|---|---|---|---|
| Mean reversion | Range, flat bands | Near outer band, with rejection | Breakout against you |
| Squeeze breakout | Low BandWidth | Close outside the bands as they widen | False breakout |
| Walking the bands | Strong trend | Pullback to the middle band | Late entry as the trend ends |
What does the evidence say?
Fact: Coakley, Marzano and Nankervis (2016, International Review of Financial Analysis) tested 113,148 technical trading rules across 22 currencies. After controlling for data snooping, classic moving-average rules were insignificant in 2006–2015, while some rules based on Bollinger Bands and RSI remained profitable in that period.
Analysis: That’s encouraging for Bollinger-based ideas, but it’s one study, the profitable rules aren’t necessarily the simple “buy lower band, sell upper band” approach, and past results in a specific period may not continue. Treat the bands as a structured way to read volatility and relative price, and test your specific rules.
Worked example: USD/INR range trade (illustrative)
USD/INR futures have been ranging, with flat Bollinger Bands. Price dips to the lower band near 95.35, forms a bullish rejection candle, and the range support sits just below.
| Item | Value |
|---|---|
| Entry (buy) | 95.35 |
| Stop-loss (below range support) | 95.20 |
| Target (middle band) | 95.60 |
| Risk per lot | (95.35 − 95.20) × 1,000 = ₹150 |
| Potential reward per lot | (95.60 − 95.35) × 1,000 = ₹250 |
| Reward-to-risk | About 1.7 : 1 |
| Capital and risk | ₹1,00,000 at 1% = ₹1,000 |
| Position size | ₹1,000 ÷ ₹150 = 6.7, round down to 6 lots (risk ₹900; potential reward ₹1,500) |
One NSE USD/INR lot is $1,000, so a ₹0.01 move equals ₹10 per lot. Figures are before brokerage, charges and slippage. If the bands start widening and price closes below 95.20, the range has likely broken, and the stop handles it.
Step-by-step: trading Bollinger Bands
- Identify the market condition: range, squeeze or trend.
- Choose the matching strategy, and don’t mix them.
- Wait for price action confirmation at the band or middle line.
- Set the stop beyond the level that proves you wrong (range edge, swing or opposite band).
- Set the target: middle band in ranges; trailing or prior swing in trends.
- Size from your risk per trade.
- Check the economic calendar; volatility bands can expand sharply on news.
- Record every trade and review over 50–100 trades.
Expert analysis
Fact: Bollinger Bands use a 20-period SMA with bands 2 standard deviations above and below by default. Their creator says band tags aren’t signals on their own and that price can walk the bands in trends. A 2016 study of 22 currencies found some Bollinger Band-based rules remained profitable in 2006–2015 after adjusting for data snooping.
Analysis: Bollinger Bands are most useful as a context tool. They answer two questions: is price high or low relative to its recent range, and is volatility expanding or contracting? The right strategy depends on the answer. Mean reversion suits flat bands in a range, breakout approaches suit a squeeze, and trend-following suits bands that are widening with price walking one side. Most losses come from using the range strategy in a trend.
Opinion: Beginners should start by labelling the market condition before looking at the bands, then pick only one of the three strategies for a test period. Avoid adding RSI or other momentum oscillators that repeat the same information; Bollinger himself advises that if you use more than one indicator, they shouldn’t be directly related to one another.
Common mistakes
- Selling every upper-band touch in an uptrend.
- Buying every lower-band touch in a downtrend.
- Assuming a squeeze tells you the direction. It only signals that volatility may expand.
- Chasing the first close outside the bands without confirmation, and getting caught by head fakes.
- Believing “95% of prices stay inside”. Market returns aren’t normally distributed.
- Constantly tweaking the 20 and 2 settings.
- Stacking related indicators that repeat the same message.
- Skipping stops because price is “too far” from the middle band.
Myths vs facts
| Myth | Fact |
|---|---|
| “Touching the upper band is a sell signal.” | Bollinger says tags aren’t signals; in trends, price can walk the upper band. |
| “Bollinger Bands contain 95% of price action.” | That assumes a normal distribution; real prices break the bands more often. |
| “A squeeze predicts the breakout direction.” | It signals low volatility, not direction. |
| “The 20 and 2 settings are fixed rules.” | Bollinger calls them defaults. |
| “Bollinger Bands are proven to make money.” | One study found some band-based FX rules profitable in 2006–2015; that isn’t a guarantee for any specific strategy. |
Key takeaways
- Bollinger Bands = 20 SMA ± 2 standard deviations; %b and BandWidth add useful detail.
- They show relative high and low, and volatility expansion or contraction.
- Match the strategy to the market: mean reversion in ranges, squeeze breakouts, and walking the bands in trends.
- A band touch isn’t a signal on its own; confirm with price action and trend.
- Always use a stop and fixed risk. In our example, 6 USD/INR lots risked ₹900 for a potential ₹1,500.
- Test one strategy over 50–100 trades before changing settings.
FAQs
- What are Bollinger Bands? A volatility indicator with a 20-period moving average in the middle and bands 2 standard deviations above and below, developed by John Bollinger.
- How are Bollinger Bands calculated? Middle band = 20 SMA. Upper band = middle + 2 × standard deviation. Lower band = middle − 2 × standard deviation.
- What is the best Bollinger Bands setting for forex? 20 and 2 are the defaults. Bollinger himself describes them as defaults, not rules. Test before changing.
- What does it mean when price touches the upper band? Price is high relative to its recent range. It isn’t a sell signal on its own; in uptrends price can walk the upper band.
- What is a Bollinger Band squeeze? A period when the bands narrow sharply, showing low volatility. A larger move often follows, but the squeeze doesn’t show its direction.
- What is %b? A measure of where price sits relative to the bands: 1 is at the upper band, 0 at the lower band, above 1 is outside the upper band.
- What is BandWidth? The distance between the bands divided by the middle band. It measures volatility and helps identify squeezes.
- What does “walking the bands” mean? In strong trends, price repeatedly touches or closes near one band, showing persistent strength or weakness.
- Do 95% of prices stay within Bollinger Bands? Not reliably. That idea assumes a normal distribution, which market prices don’t follow closely.
- Do Bollinger Bands work in forex? One study across 22 currencies found some Bollinger Band-based rules remained profitable in 2006–2015 after adjusting for data snooping, but results depend on the rules used.
- Can I use Bollinger Bands on USD/INR? Yes, on NSE or BSE USD/INR futures traded through a SEBI-registered broker.
- Which strategy is best for beginners? Start with one: range mean reversion is simplest to understand, but only use it when the market is clearly ranging.
- What is a head fake? A false breakout where price closes outside a band after a squeeze and then quickly reverses.
- Should I combine Bollinger Bands with RSI? You can, but they overlap somewhat. Bollinger advises that combined indicators shouldn’t be directly related to one another.
- Where should I place my stop-loss? Beyond the level that proves the trade wrong, such as below range support or beyond the recent swing, not simply at the band.
- Are Bollinger Bands leading or lagging? They’re based on a moving average and recent volatility, so they lag. They describe current conditions rather than predict.
- How do I test a Bollinger Bands strategy? Define exact rules for market condition, entry, stop and target, apply them to 50–100 trades, and review results in R after costs.