Introduction
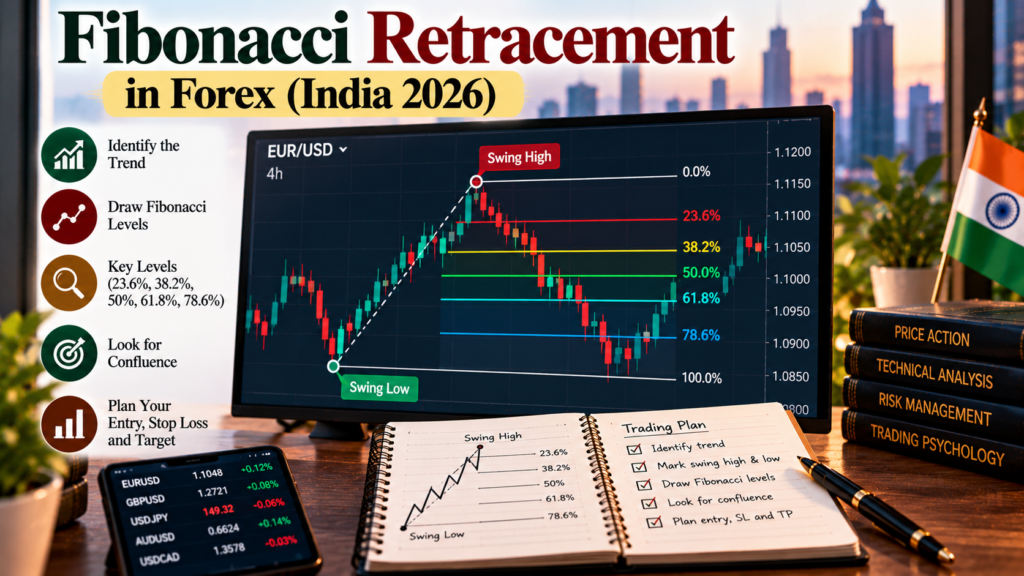
Prices rarely move in straight lines. After a strong move up, a currency often pulls back before continuing, and traders want to know where that pullback might stop. Fibonacci retracement is one of the most popular tools for estimating those levels. It draws horizontal lines at set percentages of a price move, most commonly 38.2%, 50% and 61.8%, which many traders watch as possible support or resistance.
Quick answer: To use Fibonacci retracement in forex, identify a clear swing (low to high in an uptrend, high to low in a downtrend), draw the tool from one end to the other, and watch the 38.2%, 50% and 61.8% levels as possible zones where a pullback could pause. Don’t trade a level on its own: look for confluence with support and resistance, trend direction and price action, and always use a stop-loss and fixed risk. Research on stock indices has found no evidence that Fibonacci levels work better than other levels, so treat them as a planning aid, not a prediction.
Why this matters
- Fibonacci tools come built into most charting platforms, so beginners meet them early.
- Because so many traders watch the same levels, they can shape where people place orders, even if the levels have no special mathematical power.
- Indian traders can apply the tool to permitted pairs such as USD/INR futures on NSE or BSE, traded through a SEBI-registered broker.
What is Fibonacci retracement?
The Fibonacci sequence is 0, 1, 1, 2, 3, 5, 8, 13, 21, 34, 55, 89, 144…, where each number is the sum of the two before it. Ratios between numbers in the sequence settle towards fixed values, and traders use those values as percentage levels.
| Level | Where it comes from | Example (55 in the sequence) |
|---|---|---|
| 23.6% | A number divided by the one three places later | 55 ÷ 233 ≈ 0.236 |
| 38.2% | A number divided by the one two places later | 55 ÷ 144 ≈ 0.382 |
| 50% | Not a Fibonacci ratio; included by convention | — |
| 61.8% | A number divided by the next one (the “golden ratio” inverse) | 55 ÷ 89 ≈ 0.618 |
| 78.6% | Square root of 0.618 | √0.618 ≈ 0.786 |
Fact: 61.8% is about 1 ÷ 1.618, where 1.618 is the golden ratio. 38.2% is 0.618 squared, and 23.6% is 0.618 cubed.
The formula
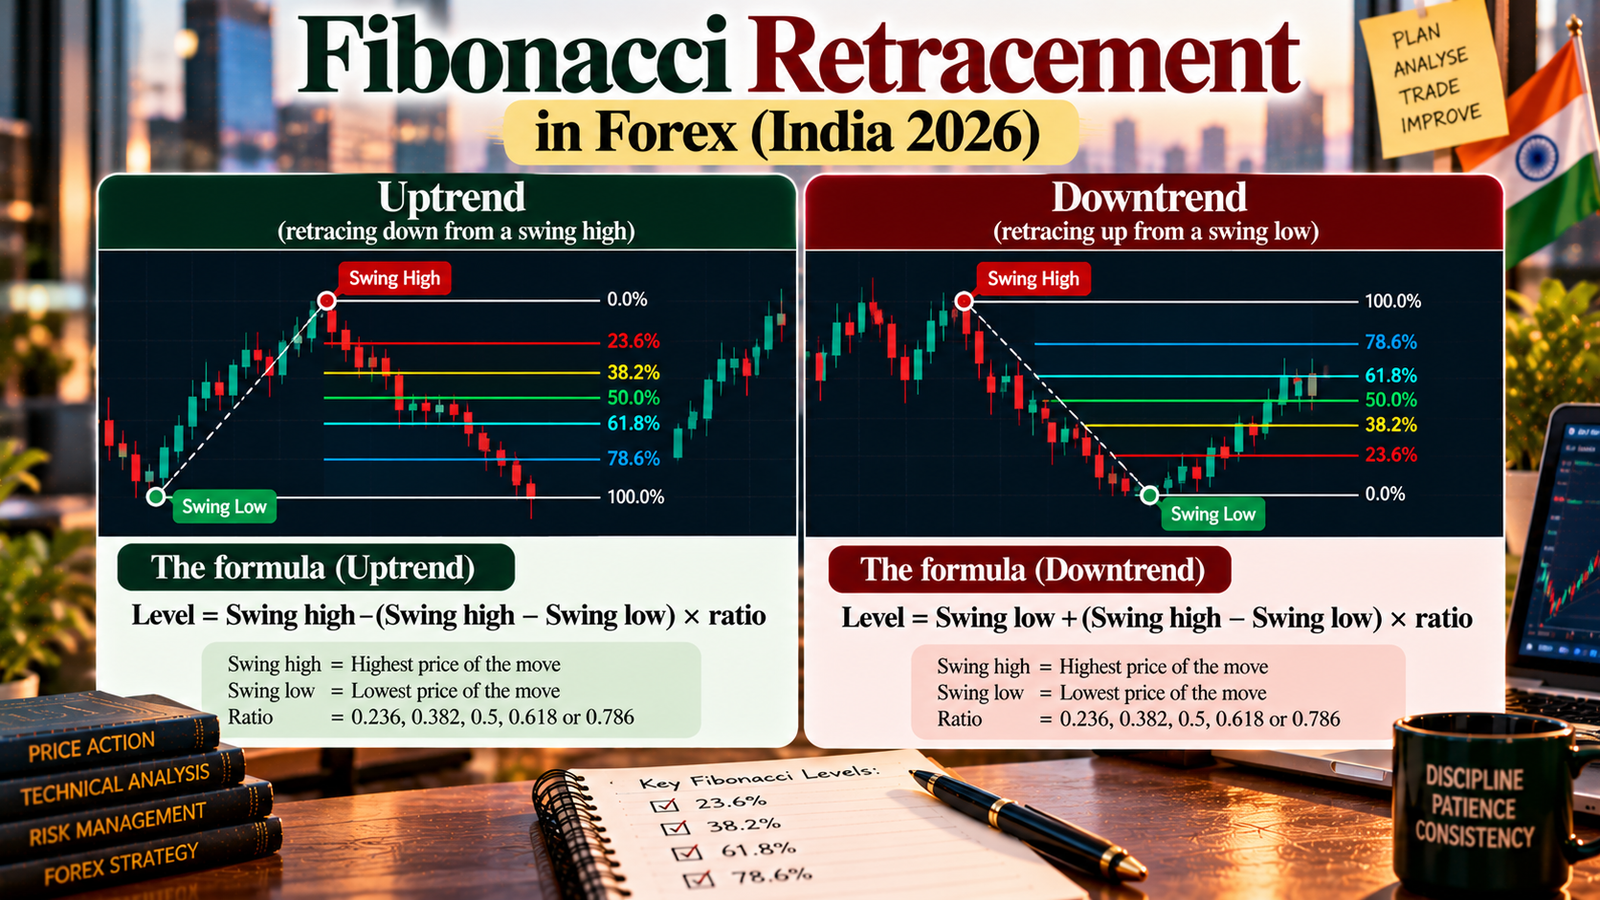
Uptrend (retracing down from a swing high): Level = Swing high − (Swing high − Swing low) × ratio
Downtrend (retracing up from a swing low): Level = Swing low + (Swing high − Swing low) × ratio
How to draw it
- Pick a clear, recent swing on your trading time frame. Obvious swings work best; if you have to hunt for one, the setup is probably weak.
- In an uptrend, drag the tool from the swing low to the swing high. In a downtrend, drag from the swing high to the swing low.
- Read the levels the platform draws between the two points.
- Mark zones, not exact lines. Price rarely turns at an exact number, so treat each level as a small area.
What does the evidence say?
Fact: A study by Tsinaslanidis, Guijarro and Voukelatos, published in Expert Systems with Applications (2022), automatically identified Fibonacci retracements across Dow Jones, NASDAQ-100 and DAX stocks. It found that the probability of prices bouncing at a Fibonacci zone was statistically indistinguishable from bouncing at any other, non-Fibonacci zone, and that wider zones caught more bounces but didn’t produce profitable strategies.
Analysis: That study covered equities, not forex, but it’s a useful reality check. Fibonacci levels aren’t magic. Any benefit likely comes from (a) marking a sensible pullback area within a trend, and (b) many traders watching the same levels. That’s why confluence and risk management matter more than the ratio itself.
Worked example: USD/INR futures (illustrative)
Assume USD/INR futures rise from a swing low of 94.80 to a swing high of 96.20, a range of ₹1.40. The prices are illustrative round numbers, not a forecast.
Step 1: calculate the levels
| Level | Calculation | Price (uptrend retracement) |
|---|---|---|
| 23.6% | 96.20 − 1.40 × 0.236 | 95.8696 |
| 38.2% | 96.20 − 1.40 × 0.382 | 95.6652 |
| 50% | 96.20 − 1.40 × 0.500 | 95.5000 |
| 61.8% | 96.20 − 1.40 × 0.618 | 95.3348 |
| 78.6% | 96.20 − 1.40 × 0.786 | 95.0996 |
If the move had been down from 96.20 to 94.80, the same ratios would be measured upward from the low: 38.2% at 95.3348, 50% at 95.5000 and 61.8% at 95.6652.
Step 2: look for confluence
Suppose the 61.8% level (about 95.33) also lines up with a previous resistance level that has turned into support, and the higher-time-frame trend is up. That combination is stronger than the Fibonacci level alone.
Step 3: plan the trade
NSE USD/INR futures trade in ticks of ₹0.0025, and one lot is $1,000, so a ₹0.01 move equals ₹10 per lot.
| Item | Value |
|---|---|
| Entry (buy limit, rounded to tick) | 95.335 |
| Stop-loss (below the 78.6% level) | 95.050 |
| Target (back to the swing high) | 96.200 |
| Risk per lot | (95.335 − 95.050) × 1,000 = ₹285 |
| Potential reward per lot | (96.200 − 95.335) × 1,000 = ₹865 |
| Reward-to-risk | About 3.0 : 1 |
Step 4: size the position
With capital of ₹1,00,000 and risk of 1% (₹1,000) per trade: ₹1,000 ÷ ₹285 = 3.5, so round down to 3 lots. Actual risk is ₹855 (0.86%), and the potential reward at target is ₹2,595, before brokerage, charges and slippage.
Remember: the trade can simply fail. Price may slice through 61.8% and hit the stop, which is exactly why the stop and size are set first.
How to combine Fibonacci with other tools
| Confluence factor | Why it helps |
|---|---|
| Higher-time-frame trend | Retracements are more useful as pullbacks within a trend |
| Previous support or resistance | A level many traders already watch |
| Round numbers (e.g. 95.50) | Often attract orders |
| Moving average | Adds another commonly watched reference |
| Price action (e.g. a rejection candle) | Shows buyers or sellers actually stepping in |
| Economic calendar | Avoids entering just before high-impact news |
Fibonacci extensions (a brief note)
Extensions such as 127.2% and 161.8% project levels beyond the swing, and some traders use them as profit targets. The same caution applies: they’re reference points, not predictions.

Step-by-step checklist
- Confirm the trend on a higher time frame.
- Identify a clear swing low and swing high.
- Draw the retracement in the direction of the move.
- Mark 38.2%, 50% and 61.8% as zones.
- Look for at least one other confluence factor.
- Wait for price action confirmation.
- Set the stop beyond the next level or the swing, and the target at the swing or an extension.
- Size from your risk per trade, then enter.
- Record the trade and outcome in your journal.
Learn more about Forex Order Types: Market, Limit and Stop Orders
Expert analysis
Fact: Fibonacci retracement levels (23.6%, 38.2%, 61.8%, 78.6%) come from ratios in the Fibonacci sequence; 50% is added by convention. A 2022 study of Dow Jones, NASDAQ-100 and DAX stocks found bounces at Fibonacci zones were statistically no more likely than at other zones.
Analysis: Fibonacci retracement is best understood as a structured way to mark a pullback area inside a trend, not as a hidden law of markets. Its practical value comes from making you plan entry, stop and target before price arrives, and from the fact that many participants watch similar levels. Its weakness is subjectivity: different swing points give different levels, which makes it easy to see what you want to see.
Opinion: Beginners can use Fibonacci as one input among several, but should never rely on it alone. Pick swings by a consistent rule, require at least one other confluence factor, and test the approach on 50–100 trades in your journal before trusting it with real money.
Common mistakes
- Choosing swing points after the fact to make levels “fit”.
- Treating levels as exact prices instead of zones.
- Trading every Fibonacci level without trend or confluence.
- Drawing in the wrong direction, such as high-to-low in an uptrend.
- Placing stops exactly at the next level, where many others place theirs. Give a buffer.
- Ignoring news. Fibonacci levels won’t hold through a big data surprise.
- Believing the golden ratio makes levels special. Evidence doesn’t support this.
- Skipping position sizing because the setup “looks perfect”.
Myths vs facts
| Myth | Fact |
|---|---|
| “Markets follow the golden ratio.” | Research on equity indices found Fibonacci zones were no more likely to hold than other zones. |
| “50% is a Fibonacci ratio.” | It isn’t; it’s included by convention. |
| “61.8% always holds.” | Price often breaks through Fibonacci levels. That’s why stops matter. |
| “Fibonacci works the same on every time frame.” | Lower time frames produce many more swings and more noise. |
| “More Fibonacci levels on the chart means better analysis.” | Too many lines make it easy to justify any trade. |
Key takeaways
- Fibonacci retracement marks possible pullback zones at 23.6%, 38.2%, 50%, 61.8% and 78.6% of a swing.
- In an uptrend, draw from swing low to swing high; in a downtrend, from swing high to swing low.
- Formula (uptrend): high − (high − low) × ratio.
- Research has found no special statistical power in Fibonacci levels, so use them with confluence, not alone.
- Always plan stop, target and position size first; in our example, 3 USD/INR lots risked ₹855 for a potential ₹2,595.
- Test the approach in your journal before trading it with real money.
FAQs
- What is Fibonacci retracement in forex? A charting tool that draws horizontal lines at set percentages of a price swing (23.6%, 38.2%, 50%, 61.8%, 78.6%) to mark possible pullback zones.
- How do I draw Fibonacci retracement? In an uptrend, drag the tool from the swing low to the swing high. In a downtrend, drag from the swing high to the swing low.
- Which Fibonacci level is most important? Many traders watch 38.2%, 50% and 61.8% most closely. No level is guaranteed to hold.
- Is 50% a Fibonacci number? No. It isn’t derived from the Fibonacci sequence but is included by convention because traders often watch halfway retracements.
- Where does 61.8% come from? It’s the approximate ratio of a Fibonacci number to the next one (e.g. 55 ÷ 89 ≈ 0.618), the inverse of the golden ratio (about 1.618).
- Does Fibonacci retracement really work? A 2022 study of Dow Jones, NASDAQ-100 and DAX stocks found Fibonacci zones were no more likely to hold than other zones. It works best as a planning aid combined with other factors.
- What is the formula for Fibonacci retracement? Uptrend: swing high − (swing high − swing low) × ratio. Downtrend: swing low + (swing high − swing low) × ratio.
- Can I use Fibonacci retracement on USD/INR? Yes, on any liquid chart, including NSE USD/INR futures. Indian residents should trade permitted pairs on NSE or BSE through SEBI-registered brokers.
- Which time frame is best for Fibonacci? There’s no single best time frame. Higher time frames usually give cleaner swings; lower ones produce more noise.
- Where should I place my stop-loss? Beyond the next Fibonacci level or beyond the swing point, with a small buffer, and sized so the loss fits your risk per trade.
- What is confluence? When several independent factors, such as a Fibonacci level, previous support and the trend, point to the same zone.
- What are Fibonacci extensions? Levels beyond 100% of the swing, such as 127.2% and 161.8%, which some traders use as profit targets.
- What is the “golden pocket”? A term some traders use for the zone between roughly 61.8% and 65%. It’s a trading convention, not a proven edge.
- Should beginners use Fibonacci? It can help structure a trade plan, but beginners should combine it with trend, support and resistance, and strict risk management.
- Why do different traders get different Fibonacci levels? They choose different swing points or time frames. Use a consistent rule for selecting swings.
- Do Fibonacci levels work during news releases? Often not. Major data can push price straight through levels, so check the economic calendar.
- How do I test a Fibonacci strategy? Define exact rules, apply them to 50–100 historical or practice trades, record results in R, and review expectancy after costs.