
Introduction
In the stock market, a bull market means prices are rising and a bear market means they’re falling. Forex adds a twist: currencies are always quoted in pairs, so when one currency rises, the other falls against it. Understanding bull vs bear market forex logic is the first step to reading any currency chart correctly, especially USD/INR, the pair most Indian traders follow.
Quick answer: A forex bull market is a sustained uptrend in a currency pair: the price makes higher highs and higher lows, meaning the base currency (the first one) is strengthening against the quote currency. A bear market is a sustained downtrend with lower highs and lower lows. Every pair is bullish for one currency and bearish for the other at the same time. For example, a bull market in USD/INR means the dollar is rising and the rupee is weakening.
Why this matters right now
- Fact: USD/INR traded around 96.1 on 29 September 2026, after the rupee fell 16 paise in early trade to 96.13 from a previous close of 95.97, according to news reports. Reports cited Brent crude near $107 a barrel, foreign investor selling and rising US yields.
- Fact: According to Trading Economics, the rupee had weakened about 8% against the dollar over the previous 12 months.
- Analysis: In plain terms, USD/INR has been in a bull phase (dollar up, rupee down). Knowing that helps Indian traders and businesses read the trend, but a trend describes the past and can change.
This guide covers what bull and bear markets mean in forex, how to spot them, what drives them, and how to approach each as a beginner.
Bull vs bear markets in forex: the basics
Every pair has two sides
In a pair like USD/INR, USD is the base currency and INR is the quote currency. The price tells you how many rupees one dollar costs.
| If USD/INR… | The dollar is… | The rupee is… | Called |
|---|---|---|---|
| Rises from 94 to 96 | Strengthening | Weakening | Bullish USD/INR (bearish rupee) |
| Falls from 96 to 94 | Weakening | Strengthening | Bearish USD/INR (bullish rupee) |
So when someone says “the market is bullish”, always ask: bullish on which currency?
No official threshold
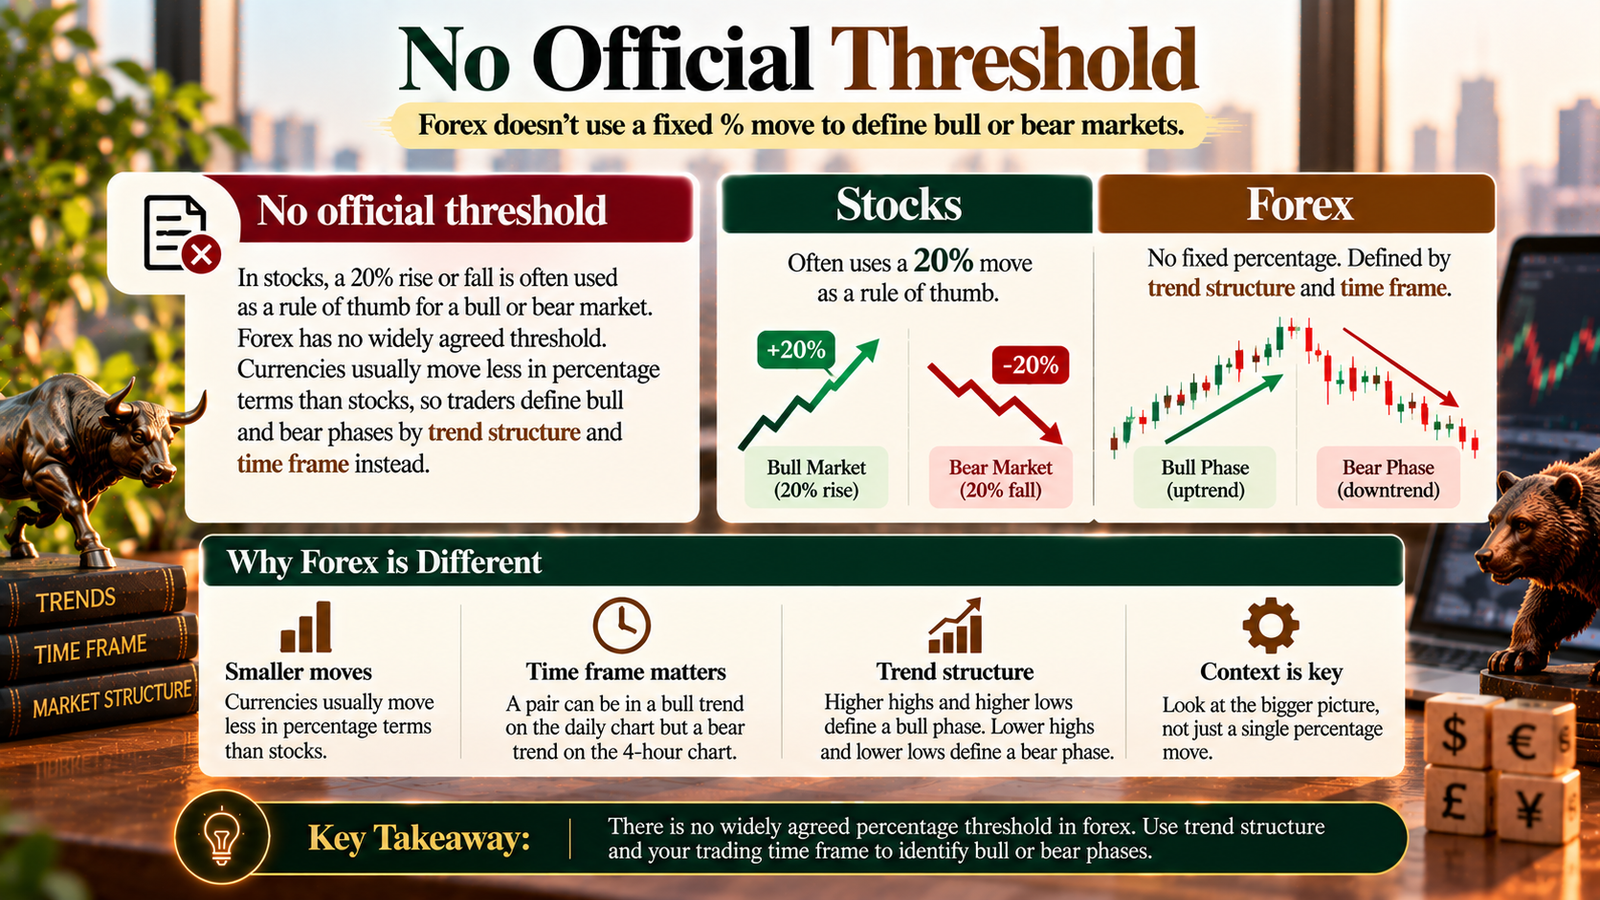
In stocks, a 20% rise or fall is often used as a rule of thumb for a bull or bear market. Forex has no widely agreed threshold. Currencies usually move less in percentage terms than stocks, so traders define bull and bear phases by trend structure and time frame instead.
Bull vs bear market at a glance
| Bull market (uptrend) | Bear market (downtrend) | |
|---|---|---|
| Price structure | Higher highs and higher lows | Lower highs and lower lows |
| Base currency | Strengthening | Weakening |
| Price vs moving averages | Mostly above rising averages | Mostly below falling averages |
| Pullbacks | Shallow dips that get bought | Brief rallies that get sold |
| Typical trade direction | Long (buy) | Short (sell) |
| Common mistake | Shorting “because it’s too high” | Buying “because it’s cheap” |
There’s also a third state, a range (sideways market), where price moves between support and resistance without clear higher highs or lower lows. Many pairs spend long periods ranging.
How to identify the trend
- Price structure. Mark swing highs and lows on your chart. Higher highs and higher lows mean an uptrend; lower highs and lower lows mean a downtrend.
- Moving averages. A common approach is to check whether price is above or below a longer average, such as the 200-day moving average, and whether that average is sloping up or down. This is a filter, not a signal to trade.
- Time frame. A pair can be bullish on the weekly chart and bearish on the hourly chart. Decide which time frame defines “the trend” for your trading and stay consistent.
- The dollar index (DXY). It measures the US dollar against a basket of major currencies. A rising DXY suggests broad dollar strength, which often (not always) coincides with a rising USD/INR. News reports put the DXY at about 101.2 on 29 September 2026.
What drives bull and bear phases?
| Driver | Tends to support the base currency when… |
|---|---|
| Interest rates | Its central bank raises rates, or is expected to, relative to the other |
| Capital flows | Foreign investors buy its assets |
| Trade balance and oil | For India, lower oil prices reduce dollar demand and help the rupee |
| Risk sentiment | In “risk-off” periods, safe havens such as the US dollar usually gain |
| Inflation | Lower inflation than the other country supports value over time |
| Central bank action | Intervention can slow a trend, as the RBI does to smooth sharp rupee moves |
Case study: USD/INR in 2026
Fact: On 29 September 2023, the rupee closed at 83.04 per dollar, per All India Radio. Around 29 September 2026, it traded near 96.1. That’s roughly 15.7% more rupees per dollar over three years, or a fall of about 13.6% in the rupee’s dollar value.
Fact: Recent reports linked the rupee’s weakness to Brent crude near $107, foreign investors selling Indian shares (net sales of ₹5,353 crore on 28 September alone), and rising US yields drawing money out of emerging markets. They also noted RBI intervention near the 96 level.
Analysis: Over several years, USD/INR has trended higher overall, a long-term bull market for the dollar against the rupee. The path hasn’t been a straight line. There have been pullbacks, ranges and RBI-slowed phases along the way, and sources differ on the exact 2026 peak. That’s typical: a long-term bull trend contains many short-term bear moves.
Opinion: Beginners shouldn’t assume the trend will simply continue. Analysts quoted in the news gave both a resistance level (96.50) and a support level (95.50), a reminder that even professionals frame outlooks as levels and scenarios, not certainties.
Trading each phase: worked examples (illustrative)
On NSE, one USD/INR futures lot is $1,000, so a ₹1 move equals ₹1,000 per lot. Prices below are round illustrative numbers.
| Phase | Trade | Entry → exit | Result per lot | Result on 2 lots |
|---|---|---|---|---|
| Bull (dollar rising) | Buy USD/INR futures | 95.00 → 96.00 | +₹1,000 | +₹2,000 |
| Bull, but you short against the trend | Sell USD/INR futures | 95.00 → 96.00 | −₹1,000 | −₹2,000 |
| Bear (rupee strengthening) | Sell USD/INR futures | 96.00 → 95.00 | +₹1,000 | +₹2,000 |
| Range between 95.50 and 96.50 | Buy near support, sell near resistance | 95.60 → 96.40 | +₹800 | +₹1,600 |
These exclude brokerage, taxes and other charges.
Strategies for each phase
In a bull market
- Look for buy-the-dip setups: pullbacks to support or a rising moving average.
- Place stops below the most recent higher low.
- Avoid shorting just because price looks “too high”.
In a bear market
- Look for sell-the-rally setups: bounces into resistance or a falling moving average.
- Place stops above the most recent lower high.
- Avoid buying just because price looks “cheap”.
In a range
- Trade between clear support and resistance, or stay out.
- Keep targets modest and stops just outside the range.
- Expect breakouts to fail sometimes; wait for confirmation.
When the trend may be changing
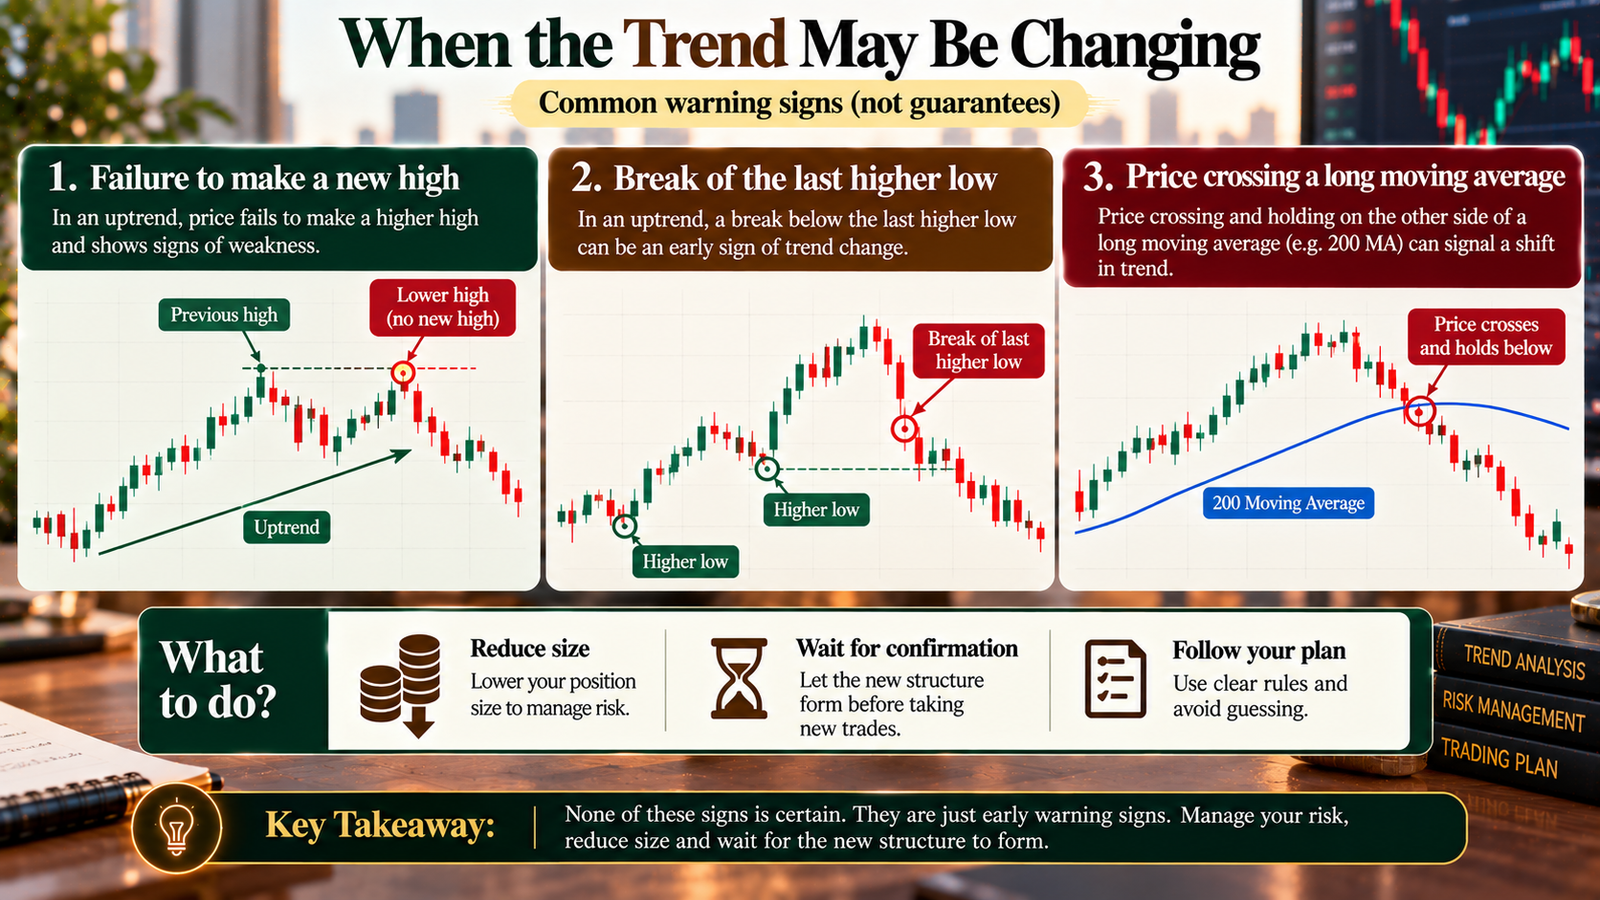
Warning signs include a failure to make a new high in an uptrend, a break of the last higher low, or price crossing and holding on the other side of a long moving average. None of these is certain. Reduce size and wait for the new structure to form.
For Indian traders: trade permitted pairs such as USD/INR only on recognised exchanges through SEBI-registered brokers. For rupee pairs, RBI rules are designed around users with an underlying currency exposure, so check the current requirements with your broker.
Expert analysis
Fact: Currency pairs always move relative to each other, so a bull market in a pair is a bear market for its quote currency. Forex has no standard percentage threshold for bull or bear markets. The rupee has weakened against the dollar over recent years, from 83.04 in September 2023 to around 96 in late September 2026.
Analysis: For beginners, the most useful takeaway isn’t a label but a habit: identify the trend on your chosen time frame before every trade, and trade with it rather than against it. Trends in currencies are driven by slow-moving forces such as rate differentials, capital flows and trade balances, which is why they can persist. Central banks and sudden risk shifts can also end them abruptly.
Opinion: Beginners lose a lot of money trying to pick tops and bottoms (“the rupee can’t fall further”). A simpler approach is to trade in the direction of the higher-time-frame trend, sit out when the market is choppy, and treat any trend call as a scenario with a stop-loss, not a certainty.
Common mistakes
- Forgetting which currency you’re bullish on. Buying USD/INR is a bet against the rupee.
- Calling tops and bottoms. Trends often go further than feels reasonable.
- Mixing time frames. A short-term pullback isn’t a new bear market.
- Ignoring ranges. Trend strategies struggle in sideways markets.
- Treating the dollar index as a USD/INR signal. It measures the dollar against major currencies and doesn’t include the rupee.
- Ignoring central bank intervention. The RBI can slow or reverse short-term rupee moves.
- Trading without a stop because “the trend will come back”. Trends end.
Myths vs facts
| Myth | Fact |
|---|---|
| “Bull markets are good and bear markets are bad.” | In forex, one currency’s bull market is the other’s bear market. You can trade both directions. |
| “A 20% move defines a forex bull or bear market.” | That’s a stock-market rule of thumb. Forex has no standard threshold. |
| “A weak rupee always means a bad economy.” | Global dollar strength, oil prices and capital flows can weaken the rupee even when growth is solid. |
| “Trends always continue.” | Trends end, sometimes suddenly after policy changes or shocks. |
| “You can only profit in a bull market.” | Futures let you go short, so traders can aim to profit in either direction, with equal risk of loss. |
Key takeaways
- A forex bull market is a sustained uptrend in a pair; a bear market is a sustained downtrend.
- Every pair is bullish for one currency and bearish for the other.
- Identify trends with price structure, moving averages and a consistent time frame.
- Drivers include interest rates, capital flows, oil and trade, risk sentiment and central bank action.
- USD/INR has trended higher over recent years (rupee weaker), with pullbacks and ranges along the way.
- Trade with the trend on your chosen time frame, use stops, and trade only on regulated Indian exchanges.
FAQs
- What is a bull market in forex? A sustained uptrend in a currency pair, with higher highs and higher lows, meaning the base currency is strengthening against the quote currency.
- What is a bear market in forex? A sustained downtrend in a pair, with lower highs and lower lows, meaning the base currency is weakening against the quote currency.
- Can a currency pair be bullish and bearish at the same time? Yes. A bull market in USD/INR is a bull market for the dollar and a bear market for the rupee. It can also be bullish on one time frame and bearish on another.
- What does “bullish rupee” mean? That the rupee is expected to strengthen, which means USD/INR would fall.
- Is USD/INR in a bull market? Over recent years it has trended higher, from 83.04 in September 2023 to around 96 in late September 2026. Trends can change, so check the current chart on your chosen time frame.
- Is there a percentage rule for forex bull and bear markets? No standard one. The 20% rule of thumb comes from stocks; forex traders usually define trends by price structure and time frame.
- How do I identify a trend in forex? Look for higher highs and higher lows (uptrend) or lower highs and lower lows (downtrend), and check price against a longer moving average on a consistent time frame.
- What is a range-bound market? A market moving sideways between support and resistance without a clear trend.
- What drives bull and bear phases in currencies? Interest rate differences, capital flows, trade balances and oil prices, risk sentiment, inflation and central bank action.
- What is the dollar index (DXY)? A measure of the US dollar against a basket of major currencies. It doesn’t include the rupee but reflects broad dollar strength.
- Can I profit in a bear market in forex? Futures let you sell (go short) to aim to profit from falling prices, but losses are equally possible if price rises.
- How much is a ₹1 move worth on USD/INR futures? One NSE lot is $1,000, so a ₹1 move equals ₹1,000 per lot, before costs.
- Why does the rupee weaken when oil prices rise? India imports most of its crude oil, so higher oil prices raise demand for dollars to pay for imports.
- What are signs a trend is ending? Failure to make new highs (or lows), a break of the last swing low (or high), or price holding on the other side of a long moving average.
- Should beginners trade with or against the trend? Trading with the higher-time-frame trend is generally simpler. Picking tops and bottoms is harder and riskier.
- Does RBI intervention stop a bull market in USD/INR? It can slow or smooth moves, but it doesn’t target a fixed level, and fundamentals usually drive the longer trend.
- Can Indian residents trade EUR/USD or GBP/USD? Only as permitted cross-currency contracts on recognised Indian exchanges through SEBI-registered brokers, not via offshore platforms.