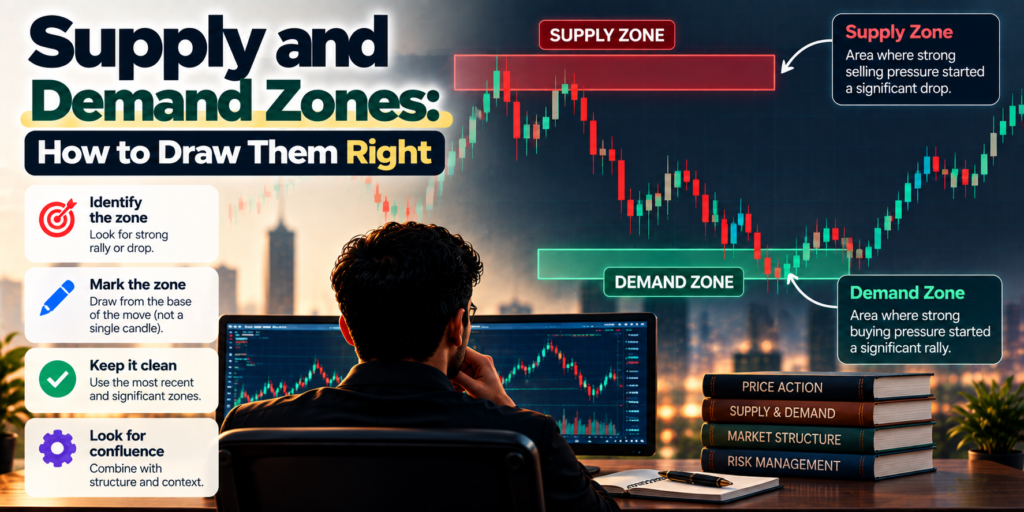
Quick answer
Supply and demand zones in forex are areas where institutional selling (supply) or buying (demand) overwhelmed the other side, causing a sharp move. You draw them from the tight ‘base’ just before that explosive move, using a proximal line (near price) and a distal line (far edge). Fresh, explosive zones are strongest.
Introduction
Supply and demand zones are among the most powerful ideas in trading – and among the most badly drawn. Get the drawing right and you have clean areas where price is likely to react, with tight risk. Get it wrong and you end up with vague blobs that ‘work’ only in hindsight. This guide focuses on the part most tutorials rush: how to draw supply and demand zones in forex correctly, so they’re precise and tradeable.
We’ll cover what the zones really are, the four types, the exact drawing method with proximal and distal lines, what makes a zone strong, and how to trade the return. This is educational content, not investment advice – zones improve your analysis but guarantee nothing.
What Are Supply and Demand Zones?
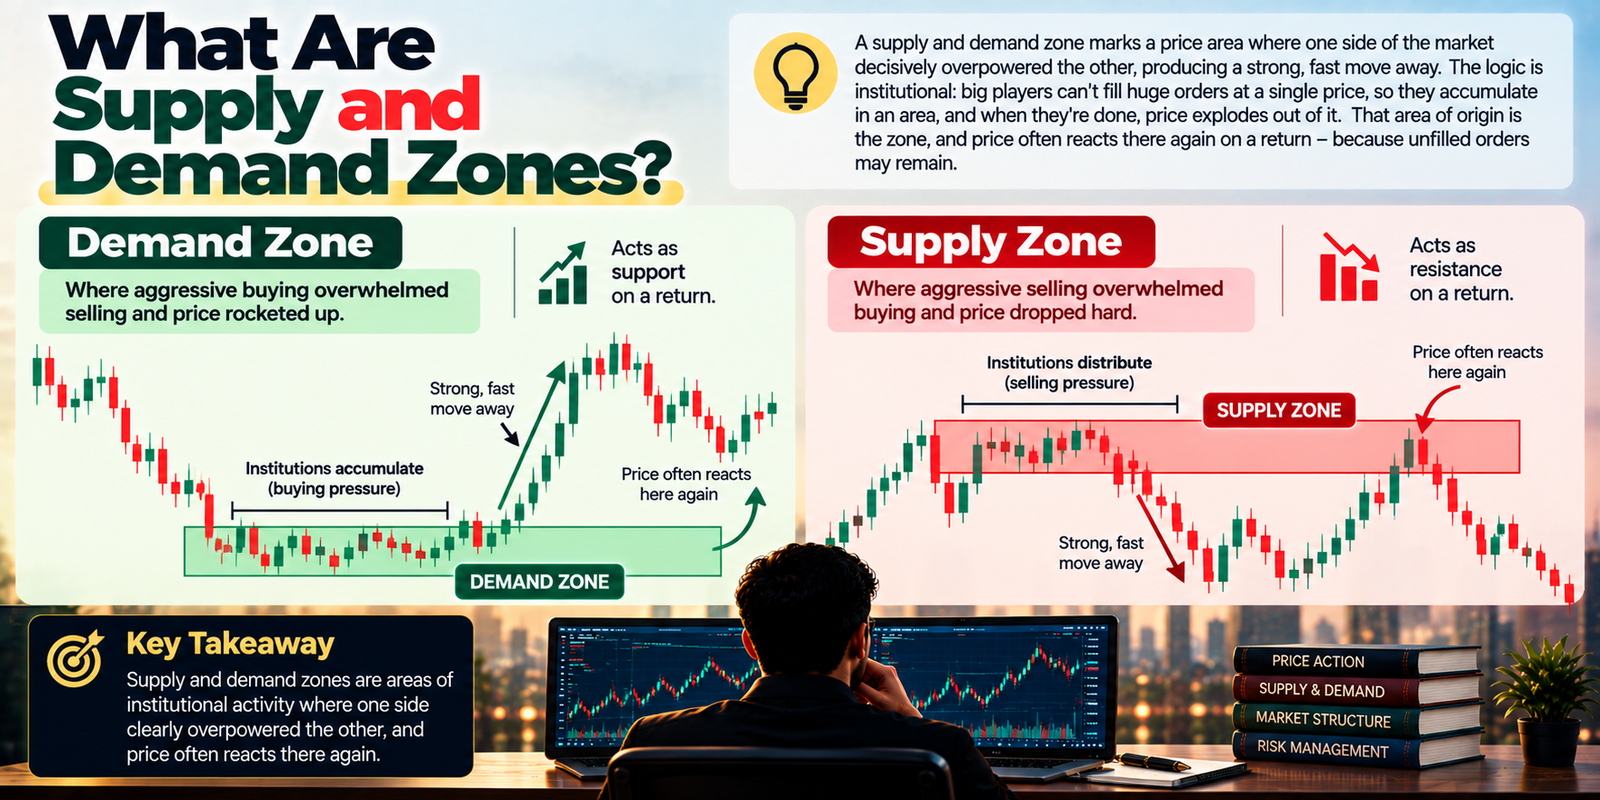
A supply and demand zone marks a price area where one side of the market decisively overpowered the other, producing a strong, fast move away. The logic is institutional: big players can’t fill huge orders at a single price, so they accumulate in an area, and when they’re done, price explodes out of it. That area of origin is the zone, and price often reacts there again on a return – because unfilled orders may remain.
- Demand zone – where aggressive buying overwhelmed selling and price rocketed up; acts as support on a return.
- Supply zone – where aggressive selling overwhelmed buying and price dropped hard; acts as resistance on a return.
How They Differ From Support and Resistance
Supply and demand refines the older idea of support and resistance. Support and resistance are usually drawn as lines at levels price has touched repeatedly. Supply and demand zones are areas, drawn not from repeated touches but from the origin of a single explosive move – the place institutions transacted. This makes zones more precise about where and why a reaction should occur, and gives you a defined area (with an edge to place your stop beyond) rather than a single line.
The Base-and-Departure Logic
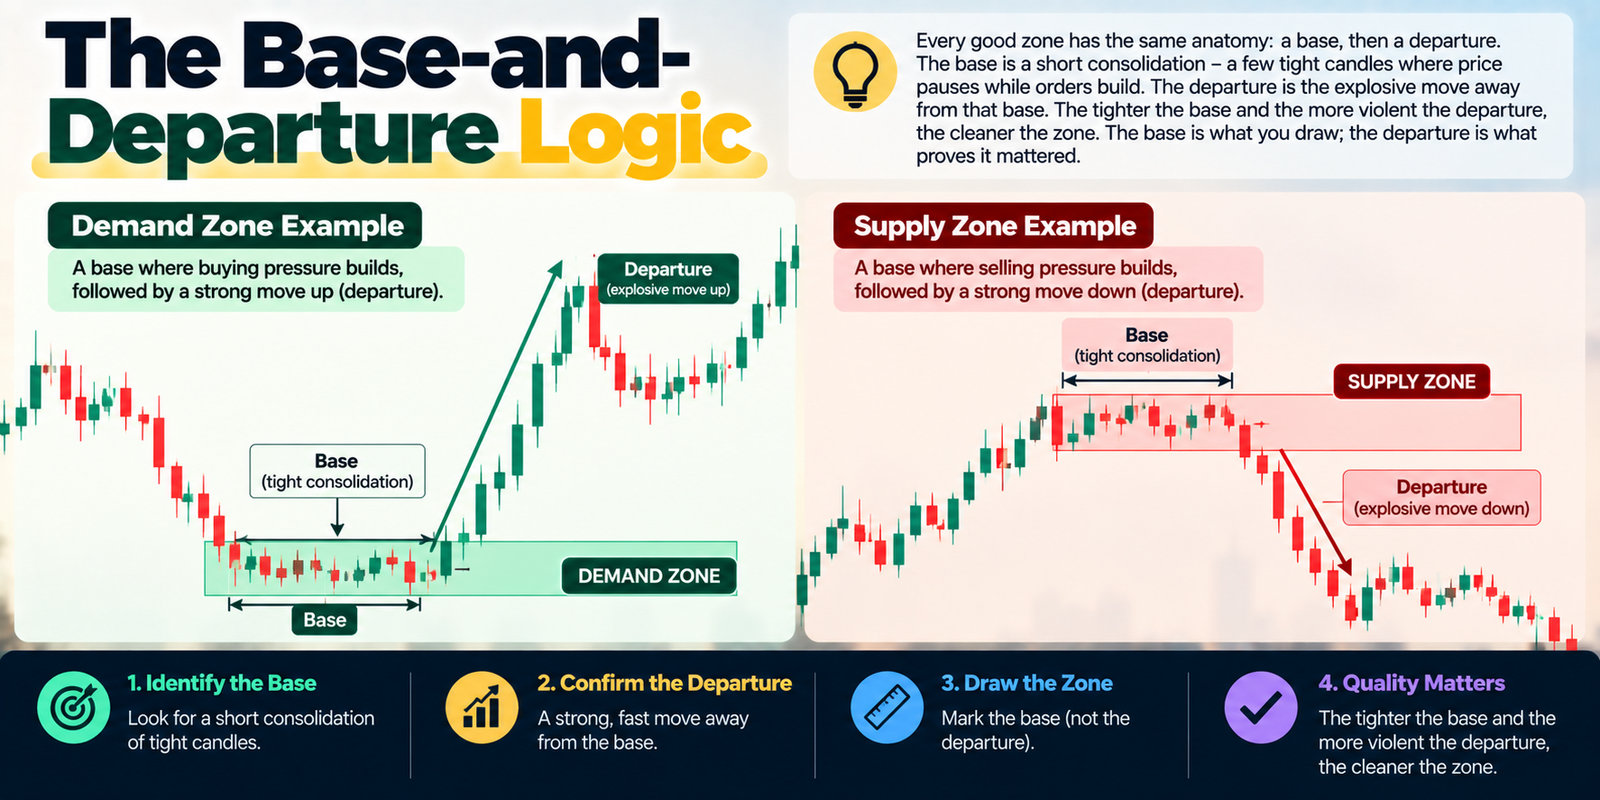
Every good zone has the same anatomy: a base, then a departure. The base is a short consolidation – a few tight candles where price pauses while orders build. The departure is the explosive move away from that base. The tighter the base and the more violent the departure, the cleaner the zone. The base is what you draw; the departure is what proves it mattered.
The Four Zone Types
Zones are classified by what happens before and after the base – giving four classic patterns:
| Pattern | Type | Signal |
|---|---|---|
| Rally-Base-Rally (RBR) | Demand | Bullish continuation – price paused, then continued up |
| Drop-Base-Rally (DBR) | Demand | Bullish reversal – price fell, based, then reversed up |
| Drop-Base-Drop (DBD) | Supply | Bearish continuation – price paused, then continued down |
| Rally-Base-Drop (RBD) | Supply | Bearish reversal – price rose, based, then reversed down |
Reversal zones (DBR, RBD) often mark major turning points; continuation zones (RBR, DBD) are pauses within a trend. Both are traded the same way – as areas to join the move on a return.
How to Draw a Zone Right (Step by Step)
Here is the practical method that separates clean zones from messy ones:
- Find an explosive move – spot a strong, fast departure that left an imbalance; that’s your clue a zone exists.
- Locate the base – the tight cluster of candles immediately before that move – ideally one to a few small candles.
- Draw the distal line – the far edge of the zone: the extreme (high of a supply base, low of a demand base), including the wick.
- Draw the proximal line – the near edge, closest to current price: typically the open/close boundary of the base candles.
- Keep it tight – a good zone is narrow; if it’s huge, you’ve probably included too much and lost precision.
Proximal vs distal
Proximal line = the edge of the zone nearest to current price (where price first re-enters the zone – your entry area). Distal line = the far edge (where the zone would be considered broken – beyond it goes your stop-loss). These two lines define the whole zone and your risk.
What Makes a Zone Strong?
Not all zones are equal. Weight them by these factors:
- Freshness – an untested (unmitigated) zone, where price hasn’t returned since it formed, is strongest; each retest weakens it.
- Strength of departure – the more explosive the move away (a big imbalance), the more significant the zone.
- Tightness of the base – a small, quick base shows decisive orders; a long, sloppy base is weaker.
- Alignment with trend and structure – a demand zone in an uptrend, or supply in a downtrend, is higher-probability.
- Higher timeframe – zones drawn on higher timeframes generally hold better than those on very low ones.
How to Trade Supply and Demand Zones
- Wait for the return – let price come back to the proximal line of a fresh zone in the trend’s direction.
- Look for a reaction – a rejection candle or shift as price enters adds confirmation before you commit.
- Enter at the zone – buy at a demand zone, sell at a supply zone.
- Stop beyond the distal line – if price closes through the far edge, the zone has failed – exit.
- Target the next zone or structure – aim for the opposite zone or a logical structure level, keeping a sound risk-reward.
Supply/Demand vs Order Blocks (SMC)
If you’ve studied Smart Money Concepts, this will sound familiar: an order block is essentially a supply or demand zone described in SMC language. Both mark the area of institutional orders before a strong move. The main differences are terminology and emphasis – SMC ties order blocks tightly to liquidity and market structure, while classic supply and demand focuses on the base-and-departure zone itself. Learn one and you’ve largely learned the other; many traders use them interchangeably.
Common Mistakes
- Drawing zones too wide, so ‘the zone held’ becomes meaningless.
- Marking a base with no explosive departure – without the move, there’s no zone.
- Trading tested, stale zones as if they were fresh.
- Ignoring trend and structure and buying supply or selling demand.
- Placing the stop inside the zone instead of beyond the distal line.
Myths vs Facts
| Myth | Fact |
|---|---|
| Supply/demand zones are just support/resistance. | They’re areas drawn from a move’s origin, not lines from repeated touches. |
| Bigger zones are safer. | Tight, precise zones give cleaner entries and better risk. |
| A zone works forever. | Fresh zones are strongest; each retest weakens them. |
| Zones and order blocks are unrelated. | An order block is essentially a supply/demand zone in SMC terms. |
Risk disclaimer
This article is for educational purposes only and is not investment advice. Supply and demand zones improve analysis but do not guarantee outcomes, and zones can and do fail. Trading involves risk of loss, and most retail traders lose money. Always use a stop-loss beyond the zone and sound position sizing, trade only through SEBI-registered brokers on recognised exchanges, and consult a qualified professional before trading.
Expert Analysis
The reason so many traders struggle with supply and demand zones isn’t the concept – it’s the drawing, and the drawing is where the edge actually lives. A zone is only useful if it’s precise enough to give you a tight, well-defined risk, and precision comes from discipline: identify a genuinely explosive departure first, then isolate the small base that launched it, and mark exactly two lines – proximal and distal – that bound the area. Traders who instead shade in a vague rectangle ‘around where price bounced’ get the worst of both worlds: entries that are neither tight nor reliable, and stops so wide the risk-reward collapses. Getting the mechanics right transforms supply and demand from a hindsight story into a forward-looking plan with a clear invalidation.
The deeper skill is judging which zones to trust, and that’s where freshness and context do the heavy lifting. A fresh, unmitigated zone born from a violent move, sitting in the direction of the higher-timeframe trend, is a genuinely high-probability area; a stale zone that price has already revisited twice, drawn against the trend, is close to worthless no matter how neatly you shade it. This is also where supply and demand meets the rest of technical analysis – the strongest setups are zones that coincide with market structure and, in Smart Money terms, with liquidity and order blocks. Treat the zone as one layer of confluence rather than a standalone signal, wait for price to return and react rather than front-running it, and always place your stop beyond the distal line so a failed zone costs little. Drawn tightly and filtered strictly, supply and demand zones are one of the cleanest ways to enter a trend – which is exactly why they reward the patience most beginners skip.
Key Takeaways
- Supply and demand zones mark where institutions transacted before an explosive move – drawn from the base.
- Demand zones act as support; supply zones act as resistance.
- Draw two lines: proximal (near price, your entry) and distal (far edge, beyond which goes your stop).
- Strongest zones are fresh, from an explosive departure, with a tight base, aligned with the trend.
- An order block is essentially a supply/demand zone in SMC language.
Frequently Asked Questions (FAQ)
Q: What are supply and demand zones in forex?
A: Price areas where institutional selling (supply) or buying (demand) overwhelmed the other side, causing a strong move; price often reacts there again on a return.
Q: What is a demand zone?
A: An area where aggressive buying overwhelmed selling and price rose sharply; it tends to act as support when price returns.
Q: What is a supply zone?
A: An area where aggressive selling overwhelmed buying and price dropped sharply; it tends to act as resistance when price returns.
Q: How do I draw a supply or demand zone?
A: Find an explosive move, locate the tight base before it, then draw a distal line at the far extreme and a proximal line at the near edge.
Q: What are proximal and distal lines?
A: The proximal line is the zone’s edge nearest current price (your entry area); the distal line is the far edge, beyond which your stop goes.
Q: What are the four zone types?
A: Rally-Base-Rally and Drop-Base-Rally (demand), and Drop-Base-Drop and Rally-Base-Drop (supply).
Q: What makes a zone strong?
A: Freshness (untested), an explosive departure, a tight base, alignment with the trend and a higher timeframe.
Q: How is supply and demand different from support and resistance?
A: Support/resistance are lines from repeated touches; supply/demand are areas drawn from the origin of a single explosive move.
Q: What is a fresh zone?
A: An unmitigated zone that price hasn’t returned to since it formed; fresh zones are the strongest, and each retest weakens them.
Q: How do I trade a supply or demand zone?
A: Wait for price to return to the proximal line in the trend’s direction, look for a reaction, enter, and stop beyond the distal line.
Q: Where do I place my stop-loss?
A: Just beyond the distal line – the far edge of the zone – so a close through it means the zone has failed.
Q: Are supply/demand zones the same as order blocks?
A: Effectively yes; an order block is a supply or demand zone described in Smart Money Concepts terms.
Q: What timeframe is best for zones?
A: Higher timeframes generally produce more reliable zones; many traders mark zones on higher timeframes and enter on lower ones.
Q: Do supply and demand zones work in India?
A: Yes. They read price behaviour and apply to any market, including forex and Indian currency derivatives.
Q: Why did my zone fail?
A: Common reasons include a zone drawn too wide, a stale/tested zone, trading against the trend, or a weak base with no real departure.