
Quick answer: An order block is the last opposite-colour candle (or small cluster) before a strong move that breaks market structure. Traders expect price to react when it returns there. A breaker block is an order block that failed: price swept liquidity beyond it, then broke back through it in the opposite direction. The failed zone “flips” and is traded from the other side. In short, an order block is an expected zone of continuation; a breaker block is a broken zone expected to act as flipped support or resistance.
| Order block | Breaker block | |
|---|---|---|
| What it is | Last opposing candle before a strong, structure-breaking move | A failed order block that price has broken through |
| Needs a liquidity sweep first? | No | Usually yes, beyond a prior high or low |
| Needs a break of structure? | Yes, in the direction of the move | Yes, in the opposite direction to the original block |
| Expected role | Price reacts in the original direction on return | Old support becomes resistance, or old resistance becomes support |
| Closest classic idea | Supply/demand zone | Support-resistance “role reversal” (polarity) |
| Typical use | Trend continuation entries | Reversal entries after a sweep |
Both concepts come from “smart money concepts” (SMC) and ICT-style price action teaching. They are ways of reading charts, not proven trading edges. This guide defines them precisely, shows how a breaker forms step by step, gives rule-based examples, and explains what research does and doesn’t support.
What is an order block?
Definition: An order block is the last opposite-direction candle (or tight group of candles) before a strong move that breaks a recent swing high or low. The idea is that large orders were placed there, and some may remain unfilled.
Bullish and bearish order blocks
| Type | How to find it | Zone to mark |
|---|---|---|
| Bullish order block | The last down (red) candle before a strong rally that breaks above a recent swing high | That candle’s low to high (some traders use open to low) |
| Bearish order block | The last up (green) candle before a strong decline that breaks below a recent swing low | That candle’s low to high (some traders use open to high) |
A testable checklist for a valid order block
Because definitions vary, write your own rules and apply them the same way every time. For example:
- Displacement: the move away is strong, e.g., a candle body larger than 1.5 × ATR(14).
- Break of structure: the move closes beyond a recent swing high (bullish) or swing low (bearish).
- Unmitigated: price has not yet returned to the zone.
- Context: the block is in the direction of the higher-timeframe trend.
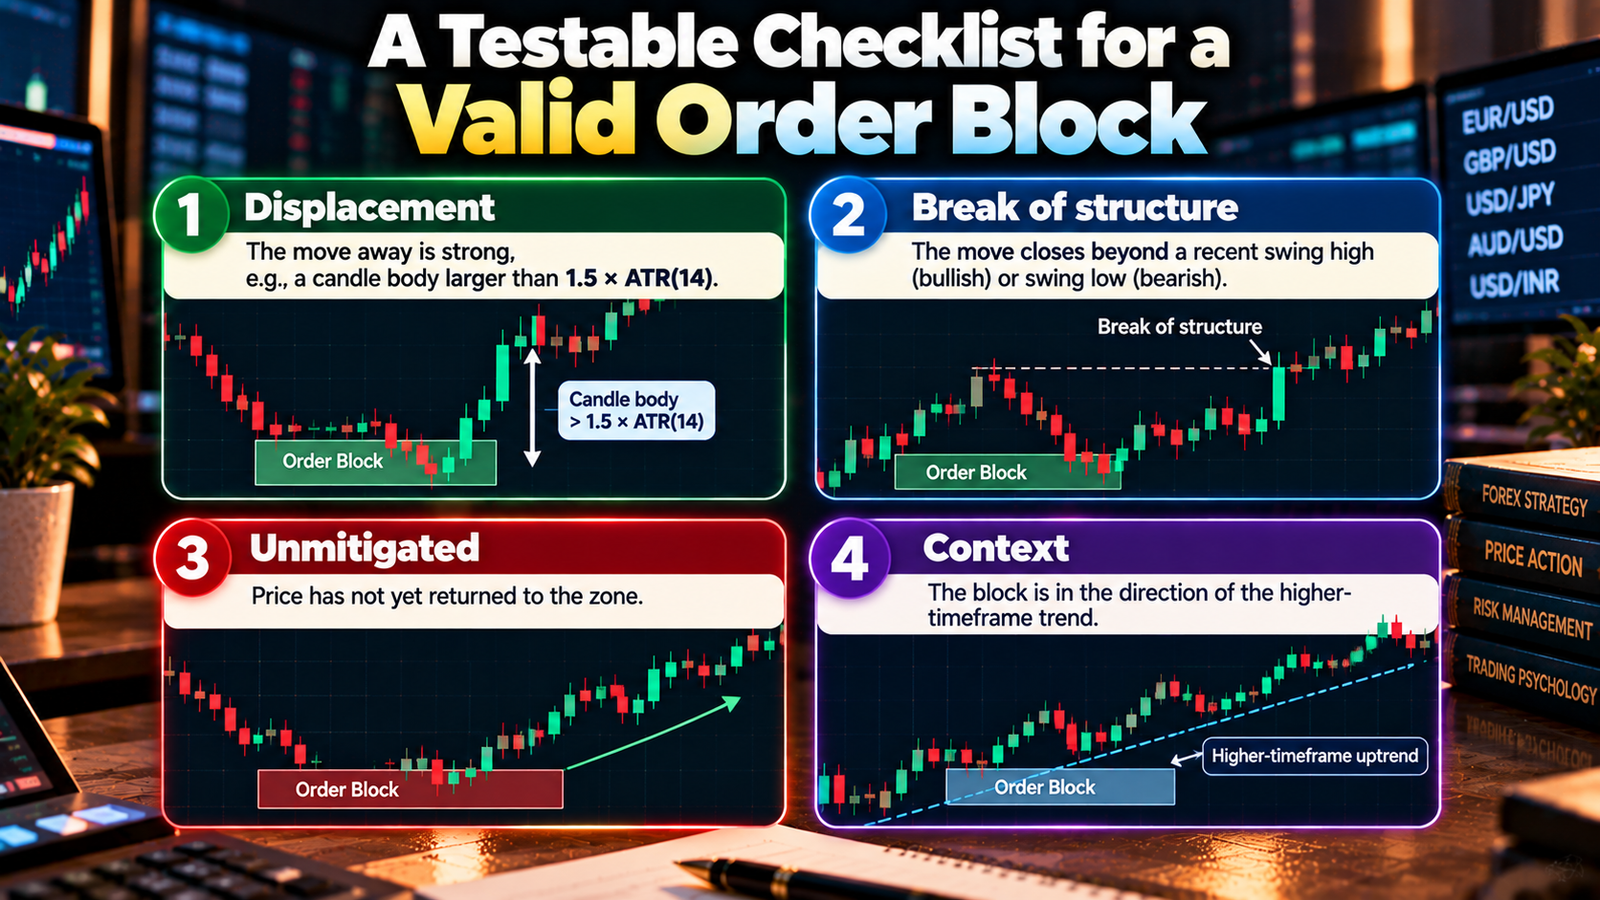
If any rule fails, don’t label it an order block. This avoids seeing blocks everywhere after the fact.
What is a breaker block?
Definition: A breaker block is an order block that failed. Price swept liquidity beyond a prior high or low, then broke decisively through the order block the other way, shifting market structure. The broken zone is then expected to act from the opposite side.
How a bullish breaker forms
flowchart LR
A[Swing high forms;<br/>last up candle = bearish OB] –> B[Price drops and<br/>sweeps a prior low]
B –> C[Strong rally breaks<br/>above the bearish OB<br/>and the swing high]
C –> D[Failed bearish OB<br/>= bullish breaker]
D –> E[Price pulls back into<br/>the breaker: long setup]
- A bearish order block forms at a swing high: the last up-candle before a drop.
- Price falls and sweeps sell-side liquidity below a prior low, triggering stops.
- Price then rallies hard and closes above the bearish order block and the swing high, a break of structure to the upside.
- The failed bearish order block is now a bullish breaker: old resistance expected to act as support.
- On a pullback into the breaker, traders look for long entries.
A bearish breaker is the mirror image: a bullish order block fails after a sweep of buy-side liquidity above a prior high, price breaks below it, and the zone is expected to act as resistance.
Breaker vs related terms
| Term | Key difference |
|---|---|
| Breaker block | Formed after a liquidity sweep beyond a prior high/low, then a break of structure |
| Mitigation block | Similar flip, but without a sweep of the prior high/low first (a failure swing) |
| Support-resistance flip | The classic version: a broken level switches role; no candle-specific zone |
| Order block | Not broken; expected to hold in its original direction |
The breaker combines three ideas covered elsewhere in this series: a liquidity sweep (often of equal highs or lows), a break of structure, and support-resistance role reversal.
How to trade order blocks and breaker blocks
Rules for both
- Mark zones on a higher timeframe (1-hour or 4-hour), then plan entries on a lower one.
- Wait for price to return to the zone. Don’t chase the move away from it.
- Enter with a limit order at the zone edge, or wait for a confirming candle close inside it.
- Put the stop beyond the whole zone plus a buffer, e.g., 0.5 × ATR.
- Target the next liquidity pool: a prior swing high/low or equal highs/lows.
- Require at least 1:2 risk/reward, otherwise skip.
- Size from your risk budget, not from margin.
- Invalidate the idea if price closes through the far side of the zone.
Example 1: Bullish breaker in Nifty futures (illustrative)
- A bearish order block (last up-candle before a drop) sits at 24,960–24,985.
- Price drops, sweeps a prior low at 24,880, then rallies and closes above 25,020, breaking structure. The old bearish block is now a bullish breaker.
- On a pullback, a limit buy fills at the top of the breaker: 24,985.
- Stop: below the zone low (24,960) minus 0.5 × ATR (40 points × 0.5 = 20), so 24,940.
- Target: the next swing high at 25,090.
| Item | Value |
|---|---|
| Risk | 45 points × 65 = ₹2,925 per lot |
| Reward | 105 points × 65 = ₹6,825 per lot |
| Risk / reward | about 1 : 2.3 |
| Lots at ₹5,000 risk (1% of ₹5 lakh) | 5,000 ÷ 2,925 = 1.7, so 1 lot |
Example 2: Bearish breaker in USD/INR futures (illustrative)
An exporter expecting dollar receipts, with a genuine exposure, wants to sell USD/INR futures to hedge.
- A bullish order block at ₹95.80–₹95.84 fails: price sweeps buy-side liquidity above a prior high, then breaks below the block and a recent swing low.
- The failed block is now a bearish breaker. On a pullback, a limit sell fills at ₹95.80.
- Stop: above the zone (₹95.84) plus a buffer, at ₹95.88.
- Target: the next low at ₹95.60.
| Item | Value |
|---|---|
| Risk | ₹0.08 (32 ticks) × 1,000 = ₹80 per lot |
| Reward | ₹0.20 (80 ticks) × 1,000 = ₹200 per lot |
| Risk / reward | 1 : 2.5 |
| Lots at ₹2,000 risk | 2,000 ÷ 80 = 25 lots |
Rupee-linked currency derivatives are for hedging a genuine exposure under RBI rules. The example shows the mechanics; it is not a recommendation to trade.
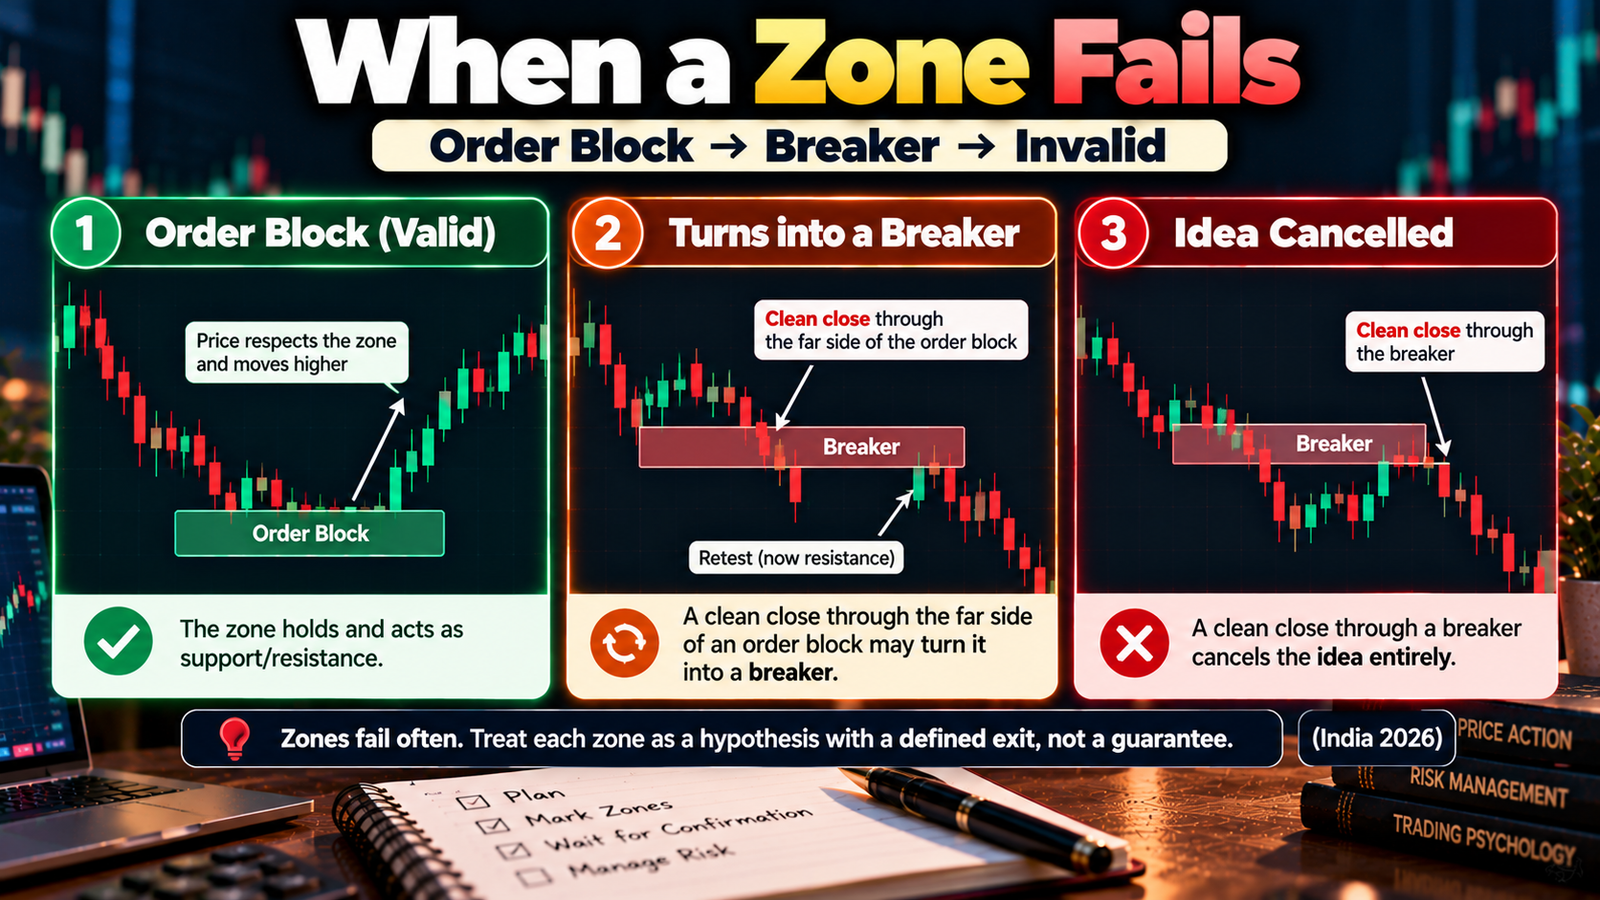
When a zone fails
Zones fail often. A clean close through the far side of an order block may turn it into a breaker. A clean close through a breaker cancels the idea entirely. Treat each zone as a hypothesis with a defined exit, not a guarantee.
What the evidence says
What research supports
- Orders cluster at obvious levels. Research at the Federal Reserve Bank of New York using real currency order data found that take-profit orders cluster at round numbers, while stop-loss orders cluster just beyond them. Once those stops trigger, price moves can speed up (Osler).
- Published support and resistance levels had some predictive power. A study of levels published by six firms for intraday currency trading found “strong evidence that the levels help to predict intraday trend interruptions,” though the power “is found to vary across the exchange rates and firms examined” (Osler, FRBNY Economic Policy Review, 2000).
- Classic chart patterns carried modest information. Lo, Mamaysky and Wang (Journal of Finance, 2000) found some technical patterns provided incremental information in US stocks, though not a guarantee of profit.
What research does not show
- There is no peer-reviewed study showing that “order blocks” or “breaker blocks”, as defined in SMC/ICT content, are consistently profitable.
- The claim that these zones show where “institutions” or “banks” placed orders is an interpretation. No public data shows who traded at a given candle in spot forex.
A fair reading
Order blocks and breakers repackage well-known ideas: supply and demand zones, liquidity sweeps, breaks of structure and support-resistance role reversal. The underlying mechanisms (order clustering, stop cascades) are real. Whether a specific rule set built on them is profitable after costs is something you have to test yourself, on enough past trades, with fixed rules.
Learn more about Handling a Losing Streak in Trading
Expert analysis
Fact: New York Fed research found that stop-loss orders cluster just beyond round numbers and can intensify moves when triggered. Published support and resistance levels showed some ability to predict intraday trend interruptions in currencies, varying by pair and firm.
Fact: SEBI found that about 91% of individual F&O traders lost money in FY25. No chart method, SMC included, changes those odds on its own.
Analysis: a breaker block is essentially a support-resistance flip that happens after a liquidity sweep. That sequence (sweep, break of structure, retest) gives a clear, testable story, which is why it’s popular. But the same chart can be labelled differently by different traders, which makes discipline in definitions essential.
Analysis: most SMC examples online are shown in hindsight on winning charts. The real test is how the rules perform across 50–100 consecutive setups, including the failures, after charges.
Opinion: for beginners, the practical value of order blocks and breakers is in risk planning: they give a logical place for a stop and a defined point where the idea is wrong. Treat them as zones to plan around, not signals to trade blindly.
Common mistakes
- Marking every candle before a move as an order block.
- Calling a zone a breaker without a clear sweep and break of structure.
- Entering on first touch without a stop beyond the zone.
- Placing stops exactly at the zone edge, where they are easy to sweep.
- Ignoring higher-timeframe trend and scheduled news.
- Trading setups from social media without testing the rules yourself.
- Sizing by margin instead of by risk.
Myths vs facts
| Myth | Fact |
|---|---|
| Order blocks show where banks placed their orders | No public data shows who traded at a given candle; it’s an interpretation |
| Breaker blocks always hold | Many fail; a close through the zone ends the idea |
| SMC is a completely new method | It repackages supply/demand, liquidity and role-reversal ideas |
| More zones on the chart means more opportunities | More zones usually means more confusion and overtrading |
| A breaker works without a stop because it’s a strong zone | Every zone needs a defined stop and fixed risk |
Key takeaways
- An order block is the last opposing candle before a structure-breaking move; a breaker is a failed order block.
- A breaker forms after a liquidity sweep and a break of structure in the opposite direction.
- Bullish breaker: a failed bearish order block that now acts as support. Bearish breaker: a failed bullish order block that now acts as resistance.
- Use written, testable rules: displacement, break of structure, unmitigated zone, higher-timeframe context.
- Enter on the retest, stop beyond the whole zone plus a buffer, target the next liquidity pool, and require at least 1:2.
- Research supports order clustering and support-resistance effects, but not the profitability of SMC setups themselves.
FAQs
1. What is a breaker block in trading?
A breaker block is an order block that failed: price swept liquidity beyond a prior high or low, then broke through the block in the opposite direction, so the zone is expected to act from the other side.
2. What is an order block?
It is the last opposite-direction candle before a strong move that breaks a recent swing high or low. Traders expect price to react when it returns there.
3. What is the difference between a breaker block and an order block?
An order block is expected to hold in its original direction. A breaker is a broken order block that has flipped role, like support turning into resistance.
4. What is a bullish breaker block?
A failed bearish order block. After price sweeps a prior low and breaks above the bearish block and the swing high, the zone is expected to act as support.
5. What is a bearish breaker block?
A failed bullish order block. After price sweeps a prior high and breaks below the bullish block and the swing low, the zone is expected to act as resistance.
6. What is the difference between a breaker block and a mitigation block?
A breaker forms after a liquidity sweep beyond a prior high or low. A mitigation block flips without that sweep.
7. How do I enter a breaker block trade?
Wait for price to pull back into the zone, then enter with a limit order or after a confirming candle close. Put the stop beyond the whole zone plus a buffer.
8. Where should I place my stop-loss on a breaker block?
Beyond the far edge of the zone plus a buffer, such as half the ATR, so a small spike through the edge doesn’t stop you out.
9. Do order blocks and breaker blocks really work?
There is no peer-reviewed evidence that these specific setups are consistently profitable. Research does support related ideas, like order clustering and support-resistance effects.
10. Is SMC the same as ICT?
The terms overlap. Smart money concepts (SMC) is a broader label for methods that use order blocks, liquidity and market structure, many popularised through ICT-style content.
11. Which timeframe is best for order blocks?
Mark zones on a higher timeframe such as 1-hour or 4-hour, and use a lower timeframe such as 15 minutes to time entries.
12. How is a breaker block related to a liquidity sweep?
A breaker usually forms right after a sweep of a prior high or low. The sweep traps traders on the wrong side, and the reversal breaks the order block.
13. Can I use breaker blocks on Nifty and USD/INR?
The chart logic applies to any liquid market. For USD/INR futures, RBI rules require a genuine underlying currency exposure.
14. How many lots should I trade on a breaker setup?
Divide your rupee risk by the risk per lot from entry to stop, and round down. For example, ₹2,000 risk ÷ ₹80 per USD/INR lot = 25 lots.
15. What makes an order block invalid?
A candle close through its far side, a lack of real displacement, no break of structure, or price having already returned to the zone.
16. Should beginners use SMC concepts?
They can help with planning stops and targets, but beginners should test any rules on past charts and keep risk to 0.5–1% per trade.