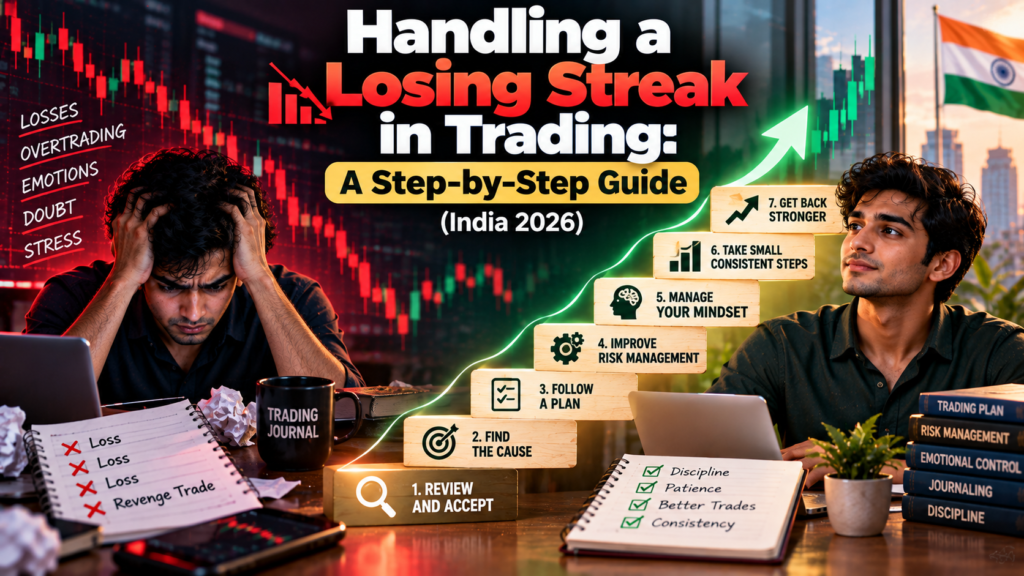
Quick answer: To handle a losing streak, first stop and check whether you followed your plan. Then cut your risk per trade (for example from 1% to 0.5%), pause after a set number of losses, and review your last 20–30 trades before judging the strategy. Losing streaks are normal: a trader who wins 40% of the time has about a 49% chance of losing 8 in a row somewhere in 100 trades. The real danger is not the streak itself but what traders do during it: bigger bets, revenge trades and abandoning a sound plan.
Every trader has losing streaks, including professionals with profitable systems. What separates those who survive is how they respond: smaller size, clear rules, and a calm review instead of a panicked change of strategy.
This guide shows the maths of how long streaks normally get, how to tell bad luck from a broken strategy, how position sizing decides whether you survive, and a step-by-step plan for what to do during a streak.
Why losing streaks happen
Even a profitable strategy loses often. If you win 40% of the time, you lose 60% of the time, and losses bunch together more than intuition expects.
How likely is a losing streak? (100 trades)
Chance of at least one streak of this many losses in a row, somewhere in 100 independent trades:
| Win rate | 5 in a row | 6 in a row | 8 in a row | 10 in a row | 12 in a row |
|---|---|---|---|---|---|
| 40% | 97.6% | 87.3% | 49.0% | 20.5% | 7.7% |
| 50% | 81.0% | 54.6% | 17.0% | 4.4% | 1.1% |
| 60% | 45.9% | 21.2% | 3.6% | 0.6% | 0.1% |
Typical longest streak in 100 trades
| Win rate | Median longest losing streak | 1-in-10 worst case |
|---|---|---|
| 40% | 7 | 11 |
| 50% | 6 | 8 |
| 60% | 4 | 6 |
These figures come from an exact probability calculation and a 20,000-run simulation. They assume each trade is independent with a fixed win rate. Real markets can be streakier, when conditions change for a period.
What this means: a trend-following trader with a 40% win rate should expect a run of about 7 losses in every 100 trades, and a run of 11 in a bad stretch. Neither proves the strategy is broken.
Other reasons streaks happen
- Market regime change: a trend strategy in a choppy, range-bound market, or a range strategy in a strong trend.
- Event-driven volatility: RBI or Fed decisions, big data releases or geopolitical news can hit stops more often.
- Execution slipping: late entries (FOMO), stops placed at obvious levels, or trading outside your best hours.
- Emotional spiral: after a few losses, traders break their own rules, which creates more losses.
Bad luck or a broken strategy?
Start with expectancy
Expectancy = (win rate × average win) − (loss rate × average loss)
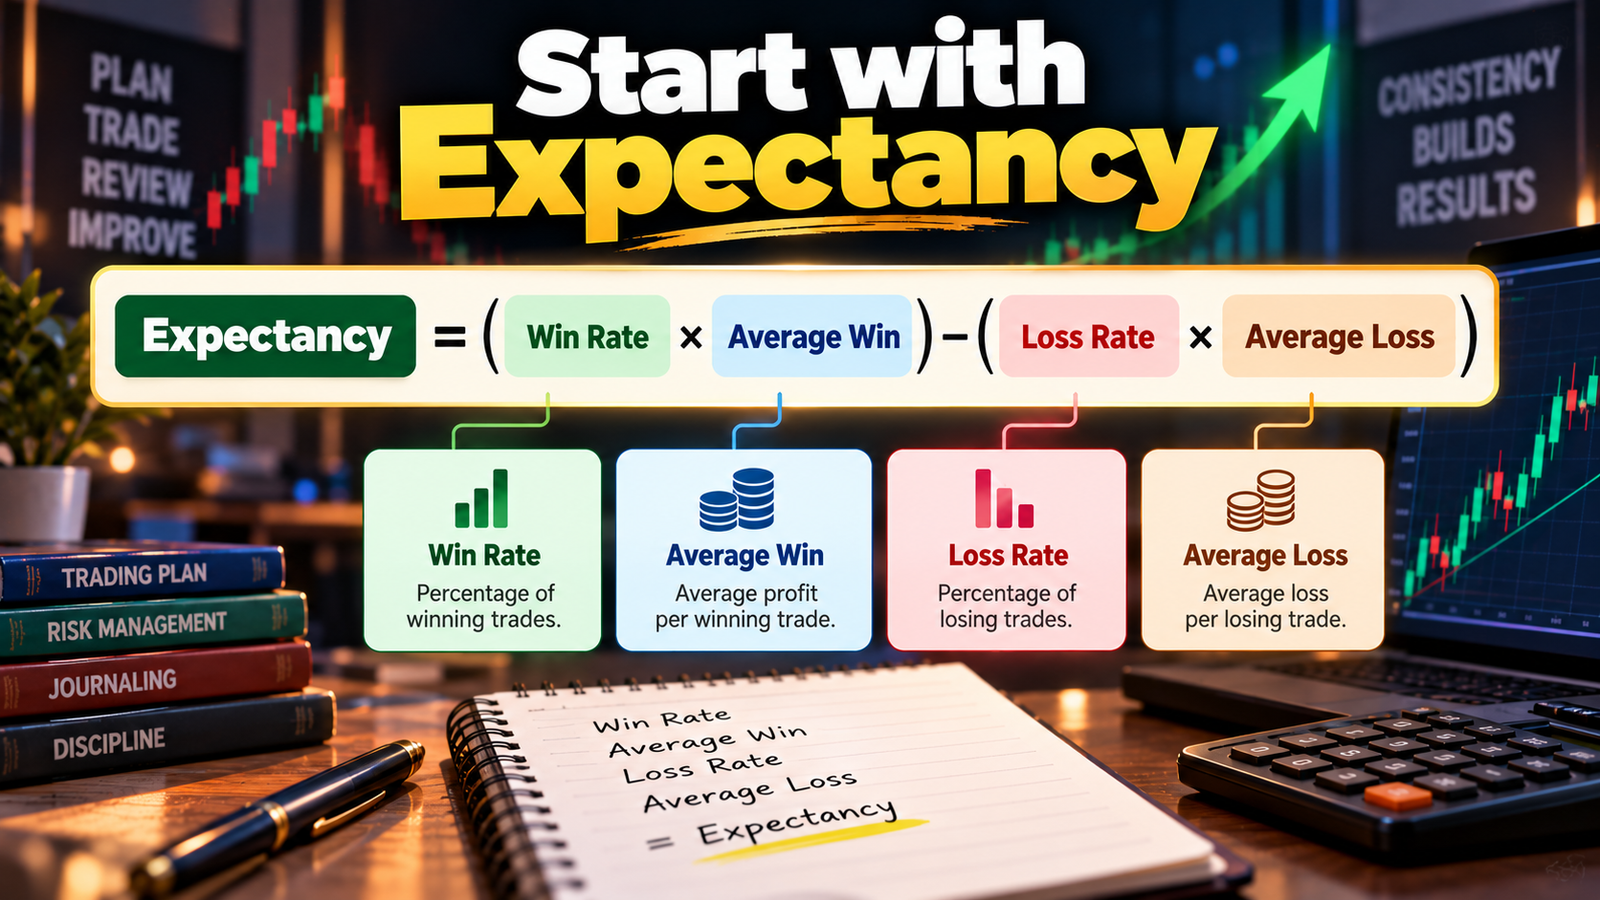
Example: 40% wins at +2R and 60% losses at −1R. Expectancy = 0.4 × 2 − 0.6 × 1 = +0.2R per trade. Over 100 trades that is about +20R, even with the long streaks shown above. (R = the amount risked per trade.)
Small samples mislead
Your measured win rate is noisy over a small number of trades. For a strategy whose true win rate is 40%:
| Trades reviewed | Typical margin of error (95%) | Win rate could look like |
|---|---|---|
| 20 | ±21.5 points | About 18% to 62% |
| 30 | ±17.5 points | About 22% to 58% |
| 50 | ±13.6 points | About 26% to 54% |
| 100 | ±9.6 points | About 30% to 50% |
So judging a strategy on 10–20 trades is close to guessing. Aim for at least 30–50 trades, and ideally 100, before deciding it has stopped working.
Diagnostic checklist
| Question | If yes, it’s more likely… |
|---|---|
| Did I follow my rules on every losing trade? | Variance (bad luck) |
| Is the streak within the normal range for my win rate (see table above)? | Variance |
| Are my average win and average loss sizes unchanged? | Variance |
| Did I break rules, chase entries or oversize? | Execution problem, not the strategy |
| Has the market changed (e.g., trending to ranging, much higher volatility)? | Regime mismatch; the strategy may need a pause |
| Is the streak far beyond the normal range, with a lower average win? | The edge may have faded; review and test |
Use a drawdown limit set in advance
Decide before a streak what level of drawdown triggers a full review, for example 1.5–2 times the worst drawdown in your past trading or backtest. Deciding in advance stops you from quitting a good strategy too early, or clinging to a broken one too long.
Drawdown maths: why position size decides survival
How much you lose in a streak
Drawdown after consecutive losses, when you risk a fixed percentage of your current capital on each trade:
| Losses in a row | Risk 1% per trade | Risk 2% per trade | Risk 5% per trade |
|---|---|---|---|
| 5 | 4.9% | 9.6% | 22.6% |
| 8 | 7.7% | 14.9% | 33.7% |
| 10 | 9.6% | 18.3% | 40.1% |
At 1% risk, even a 10-trade streak costs under 10%. At 5% risk, the same streak costs about 40%.
How hard it is to recover
Gain needed to recover = drawdown ÷ (100% − drawdown)
| Drawdown | Gain needed to get back to start |
|---|---|
| 10% | 11.1% |
| 20% | 25.0% |
| 30% | 42.9% |
| 50% | 100.0% |
The deeper the hole, the steeper the climb out. That’s why controlling risk during a streak matters more than winning back losses quickly.
Rupee example: ₹5 lakh account, 8 losses in a row
| Approach | Risk per trade | Account after 8 losses | Loss |
|---|---|---|---|
| Fixed 1% of current capital | ₹5,000 at the start, shrinking with the account | ₹4,61,372 | ₹38,628 (7.7%) |
| Doubling after each loss (martingale) | 1% → 2% → 4% → … | After just 5 losses, 31% of starting capital is gone; a 6th doubled bet would risk another 32% | Account-threatening |
Doubling up after losses feels like a way to “get it back in one trade.” Mathematically, a normal streak turns it into a disaster.
Cut size during a streak
One practical rule: after 5 consecutive losses, halve your risk per trade until you have a winning week.
With a ₹5 lakh account, 5 losses at 1% then 5 more at 0.5%, the account ends at about ₹4,63,726, a loss of about ₹36,274 (7.3%) after 10 losses. That compares with about 9.6% if you stayed at 1% throughout. The difference grows the longer the streak runs.
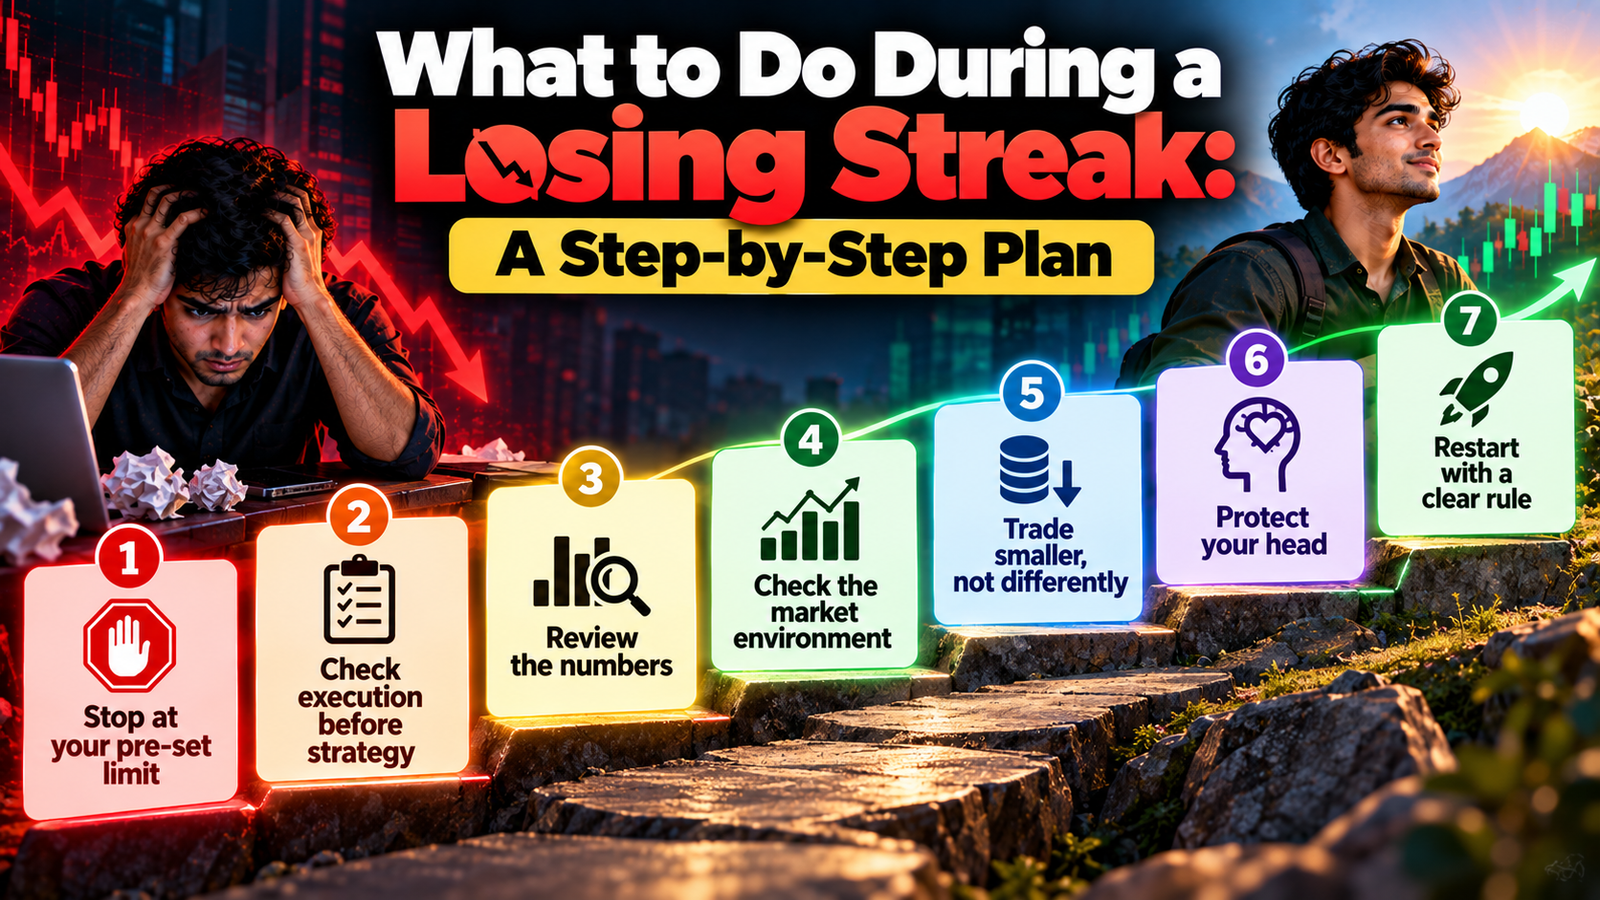
What to do during a losing streak: a step-by-step plan
Step 1: Stop at your pre-set limit
Have hard limits written down before the streak, for example:
| Trigger | Action |
|---|---|
| 2% of capital lost in a day | Stop trading for the day |
| 3 losses in a row | Take a 30-minute break before the next trade |
| 5 losses in a row | Halve risk per trade |
| 5% of capital lost in a week | Stop for the rest of the week and review |
| Drawdown beyond your planned limit (e.g., 10–15%) | Stop live trading; do a full review and test before resuming |
Step 2: Check execution before strategy
For each losing trade, answer: Did it match a written setup? Was the entry on time, or chased? Was the stop where the plan said? Was size correct? If most losses came from broken rules, the fix is discipline, not a new strategy.
Step 3: Review the numbers
Look at your last 30–50 trades: win rate, average win, average loss and expectancy. Compare them with your longer history. Ask whether the streak falls within the normal range for your win rate.
Step 4: Check the market environment
Has volatility jumped (e.g., India VIX up sharply)? Has the market shifted from trending to range-bound? Are big events (RBI, Fed, CPI) clustering? Your strategy may simply be out of season.
Step 5: Trade smaller, not differently
Keep your rules; cut the size. Consider paper trading or trading the smallest size available until you’ve followed your plan correctly for 10–20 trades in a row.
Step 6: Protect your head
Sleep, exercise and time away from screens all affect decisions. Talk to someone you trust. If losses are causing serious stress or putting money you need at risk, stop trading completely until that changes.
Step 7: Restart with a clear rule
Return to normal size only after a specific condition is met, for example a winning week, or 10 trades that followed the plan exactly, regardless of outcome.
Losing-streak checklist
- I have stopped at my daily or weekly loss limit.
- I have checked every recent loss for rule breaks.
- I have compared the streak with the normal range for my win rate.
- I have checked for a change in market conditions.
- I have reduced my risk per trade.
- I will not increase size to win losses back.
- I know the exact condition for returning to normal size.
Learn more about How to Stop Overtrading
The emotional side of losing streaks
A streak rarely hurts only your account. It affects confidence, sleep and judgement, and that is when most of the damage happens.
| Emotional reaction | What it leads to | Counter-rule |
|---|---|---|
| Frustration, urge to get even | Revenge trading, bigger size | Daily loss limit; no size increases during a streak |
| Loss of confidence | Skipping valid setups, exiting winners early | Trade smaller rather than not at all |
| Doubt about the strategy | Switching systems every week | Judge only after 30–50 trades and a pre-set drawdown limit |
| Shame or secrecy | Hiding losses, taking bigger risks to fix them quietly | Keep an honest journal; talk to someone you trust |
When to step away completely: if you are trading with money you need for essentials, borrowing to trade, losing sleep, or feeling persistent anxiety or hopelessness about losses, stop trading and talk to someone. In India, the government’s Tele-MANAS mental health helpline is available on 14416.
What the Indian data shows
- SEBI found about 91% of individual F&O traders lost money in FY25, with net losses of ₹1,05,603 crore.
- More than 75% of loss-making F&O traders kept trading after consecutive losing years (SEBI, September 2024).
- In SEBI’s FY23 intraday study, loss-makers made more trades on average than profit-makers.
Streaks are a normal part of trading, but persistent losses year after year are a signal to reassess whether active trading suits you at all.
Expert analysis
Fact: with a 40% win rate, there is about a 49% chance of losing 8 trades in a row somewhere in 100 trades, and a 20% chance of 10 in a row (exact probability calculation, assuming independent trades).
Fact: at 1% risk per trade, 10 straight losses cost about 9.6% of capital; at 5% risk, about 40%, which needs a 67% gain to recover.
Analysis: most accounts are not destroyed by the streak itself but by the reaction to it: oversizing, revenge trades and constant strategy changes. The maths shows that small, fixed risk makes almost any normal streak survivable.
Analysis: a win rate measured over 20 trades is very unreliable, with a margin of about ±20 percentage points. Traders who abandon a strategy after a short streak often throw away a real edge at the worst time.
Opinion: for beginners, the best response to a streak is boring: stop at your limit, check your execution, halve your size and wait. Excitement and urgency are warning signs, not strategies.
Common mistakes
- Doubling position size to win back losses.
- Changing strategy after a handful of losses.
- Removing or widening stops to avoid “another loss.”
- Trading more often to “get back to even.”
- Judging a strategy on fewer than 30 trades.
- Ignoring a real regime change because “it worked last month.”
Myths vs facts
| Myth | Fact |
|---|---|
| After several losses, a win is “due” | Each trade is roughly independent; past losses don’t make a win more likely |
| A long streak means the strategy is broken | With a 40% win rate, 7–11-trade streaks are normal over 100 trades |
| Bigger size helps you recover faster | It also makes the next loss bigger; recovery needs smaller size |
| Professionals don’t have losing streaks | They do; they size for them in advance |
| Taking a break means giving up | A planned pause is a risk-control tool |
Key takeaways
- Losing streaks are normal: at a 40% win rate, a 7-loss run in 100 trades is typical.
- Judge a strategy on 30–100 trades, not 10–20.
- At 1% risk per trade, even 10 losses in a row cost under 10%.
- Recovery gets harder the deeper you fall: a 30% drawdown needs a 42.9% gain.
- Set stop rules in advance: daily loss limit, break after 3 losses, halve size after 5.
- Check execution first, then the numbers, then the market environment.
- Never double up to win it back.
FAQs
1. How do I handle a losing streak in trading?
Stop at your pre-set loss limit, check whether you followed your rules, cut your risk per trade, review your last 30–50 trades, and return to normal size only after a clear condition is met.
2. How many losing trades in a row is normal?
It depends on your win rate. At 40%, a longest streak of about 7 in 100 trades is typical, and 11 is possible in a bad stretch. At 60%, about 4 is typical.
3. Should I stop trading after a losing streak?
Take a planned pause at your loss limit, then return at reduced size. Stop completely if you’ve broken your own rules repeatedly, are trading money you need, or feel under serious stress.
4. How do I know if my strategy has stopped working?
Compare your recent 30–100 trades with your history. If rules were followed, the streak is far beyond the normal range, and average wins have shrunk, the edge may have faded.
5. How many trades do I need to judge a strategy?
At least 30–50, ideally 100. With 20 trades, a strategy with a true 40% win rate can look like anything from about 18% to 62%.
6. Should I reduce position size during a losing streak?
Yes. A common rule is to halve risk per trade after 5 consecutive losses, and return to normal after a winning week or a set of trades that followed the plan.
7. Is doubling up after losses a good idea?
No. Doubling after each loss (martingale) risks 31% of starting capital within five losses when starting at 1%, and a normal streak can wipe out the account.
8. How much does a losing streak cost at 1% risk?
About 4.9% for 5 losses, 7.7% for 8 losses and 9.6% for 10 losses, when risking 1% of current capital each time.
9. How much gain do I need to recover from a drawdown?
Gain needed = drawdown ÷ (100% − drawdown). A 20% drawdown needs 25%, and a 50% drawdown needs 100%.
10. What is revenge trading?
It is taking bigger or unplanned trades to quickly win back losses. It is one of the most common ways a normal streak becomes a large drawdown.
11. Is a win “due” after several losses?
No. Each trade is roughly independent. Past losses don’t make the next trade more likely to win.
12. Can market conditions cause a losing streak?
Yes. A trend strategy in a choppy market, or any strategy during high-volatility event periods, can run into a string of losses.
13. Should I switch to a new strategy after a streak?
Not on impulse. Review execution and statistics first. A new strategy should be tested on past data and small size before replacing the old one.
14. How can a trading journal help during a streak?
It shows whether losses came from rule breaks or normal variance, and helps you compare recent results with your longer track record.
15. When should I return to full position size?
After a condition you set in advance, for example a winning week, or 10 trades that followed your plan exactly, whatever the outcome.
16. What if losses are affecting my mental health?
Stop trading and talk to someone you trust. In India, the Tele-MANAS mental health helpline is available on 14416.