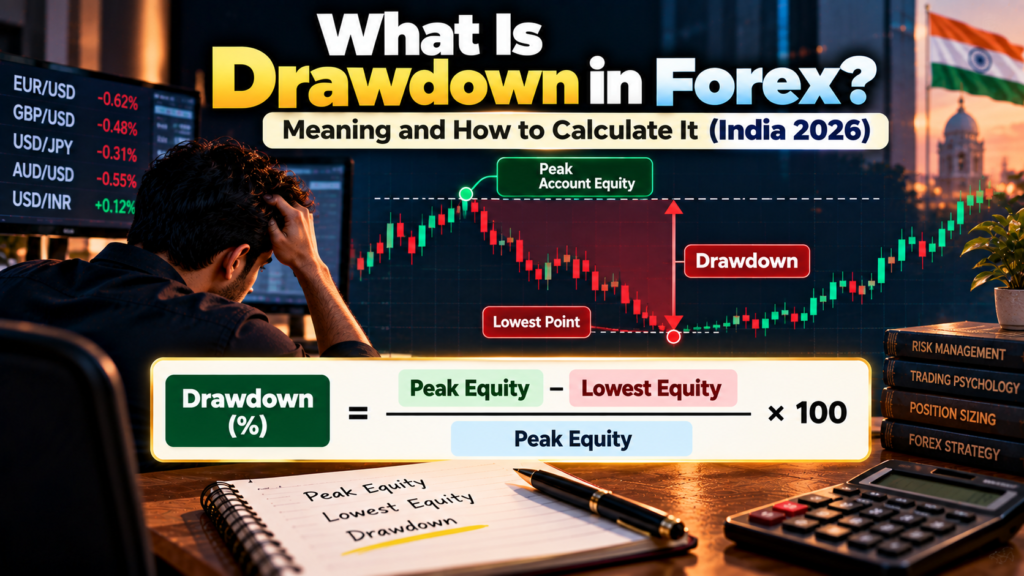
Quick answer: Drawdown is how far your account has fallen from its highest point (peak) before it makes a new high. The formula is Drawdown % = (Peak − Current value) ÷ Peak × 100. Maximum drawdown is the largest such fall over a period. For example, if your account grows to ₹2,12,000 and then drops to ₹1,90,000, the drawdown is (2,12,000 − 1,90,000) ÷ 2,12,000 = 10.38%.
Drawdown is not the same as a single losing trade. It measures the full peak-to-trough fall of your account, often across many trades. That makes it one of the most honest measures of risk: it shows how much pain a strategy caused before it recovered.
This guide explains the types of drawdown, walks through a full calculation on a worked equity curve, shows why deep drawdowns are so hard to recover from, and gives practical limits and spreadsheet formulas.
Types of drawdown
| Type | What it measures | Formula |
|---|---|---|
| Drawdown (current) | How far below the latest peak you are now | (Peak − Current) ÷ Peak |
| Maximum drawdown (MDD) | The largest peak-to-trough fall over the whole period | Max of all drawdowns |
| Absolute drawdown | How far the account fell below the starting capital | Starting capital − Lowest value (if below start) |
| Relative drawdown | Maximum drawdown as a percentage of the peak it fell from | Largest (Peak − Trough) ÷ Peak |
| Drawdown duration | How long it took to get back to the old peak | Time from peak to new high |
Balance vs equity drawdown
- Balance drawdown counts only closed trades.
- Equity drawdown also counts open (floating) losses.
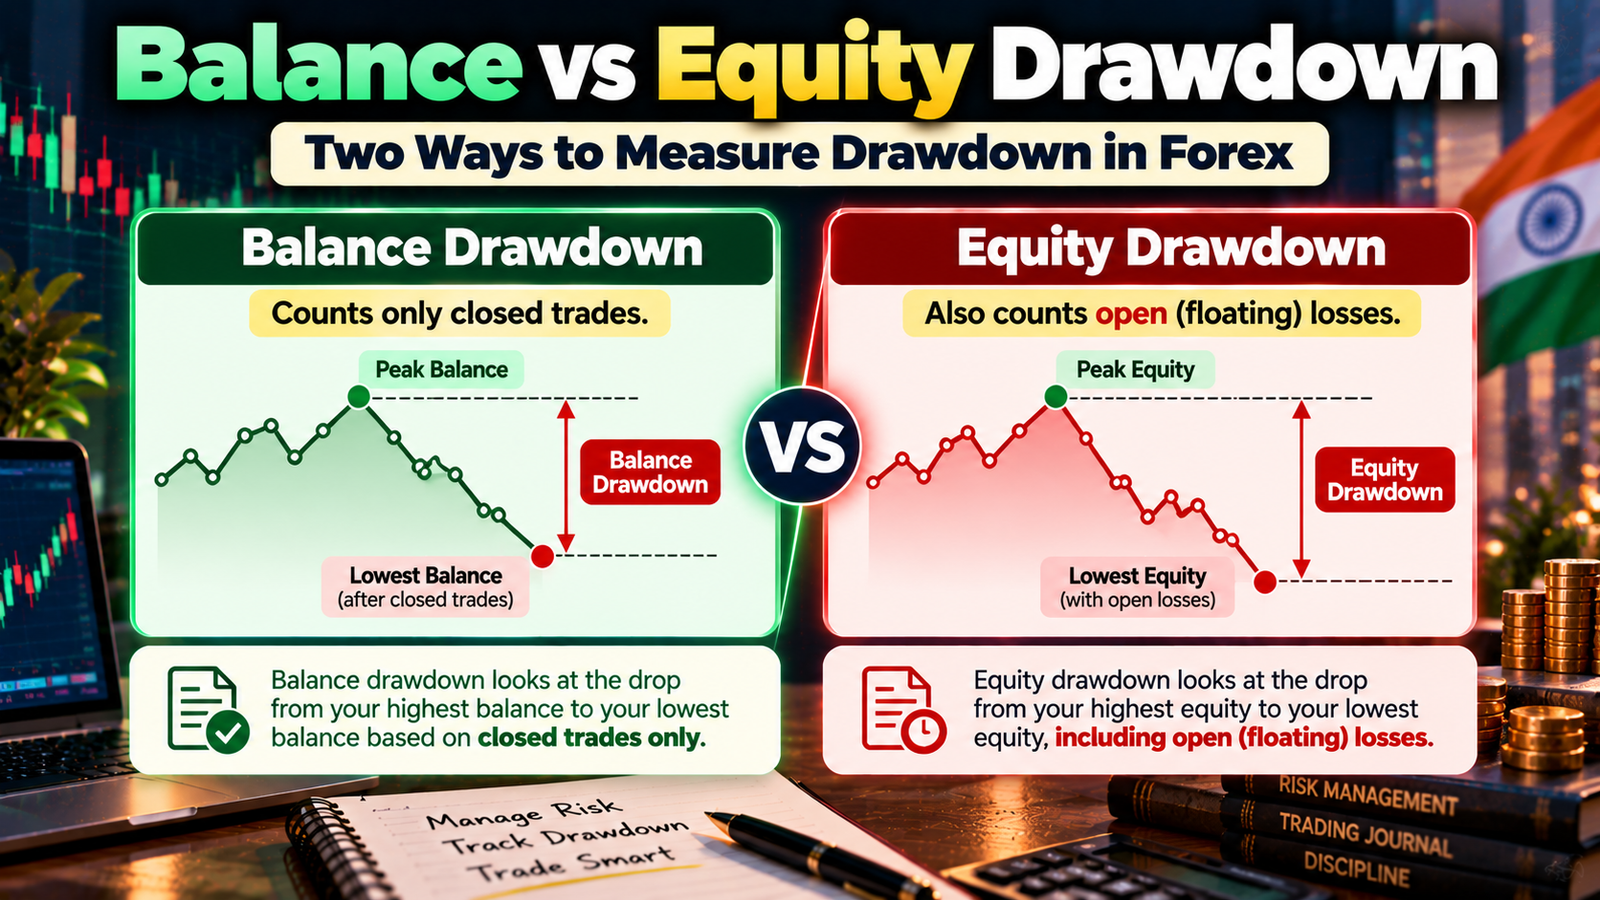
Equity drawdown is usually larger and is the more honest figure. An account can look fine on a closed-trade basis while an open position is deep in loss.
Drawdown vs loss
| Loss | Drawdown | |
|---|---|---|
| Measured from | Your entry price or starting capital | The account’s highest point |
| Covers | One trade or one period | A sequence of trades from peak to trough |
| Can happen while you’re still in profit overall? | No | Yes: you can be up 10% for the year and still be in a 5% drawdown from the peak |
How to calculate drawdown: a worked example
An illustrative ₹2 lakh trading account, recorded at the end of each week:
| Week | Account value | Running peak | Drawdown (₹) | Drawdown (%) |
|---|---|---|---|---|
| 0 | ₹2,00,000 | ₹2,00,000 | ₹0 | 0.00% |
| 1 | ₹2,06,000 | ₹2,06,000 | ₹0 | 0.00% |
| 2 | ₹2,12,000 | ₹2,12,000 | ₹0 | 0.00% |
| 3 | ₹2,04,000 | ₹2,12,000 | ₹8,000 | 3.77% |
| 4 | ₹1,96,000 | ₹2,12,000 | ₹16,000 | 7.55% |
| 5 | ₹2,01,000 | ₹2,12,000 | ₹11,000 | 5.19% |
| 6 | ₹1,90,000 | ₹2,12,000 | ₹22,000 | 10.38% |
| 7 | ₹1,98,000 | ₹2,12,000 | ₹14,000 | 6.60% |
| 8 | ₹2,09,000 | ₹2,12,000 | ₹3,000 | 1.42% |
| 9 | ₹2,16,000 | ₹2,16,000 | ₹0 | 0.00% |
| 10 | ₹2,11,000 | ₹2,16,000 | ₹5,000 | 2.31% |
| 11 | ₹2,22,000 | ₹2,22,000 | ₹0 | 0.00% |
Step by step
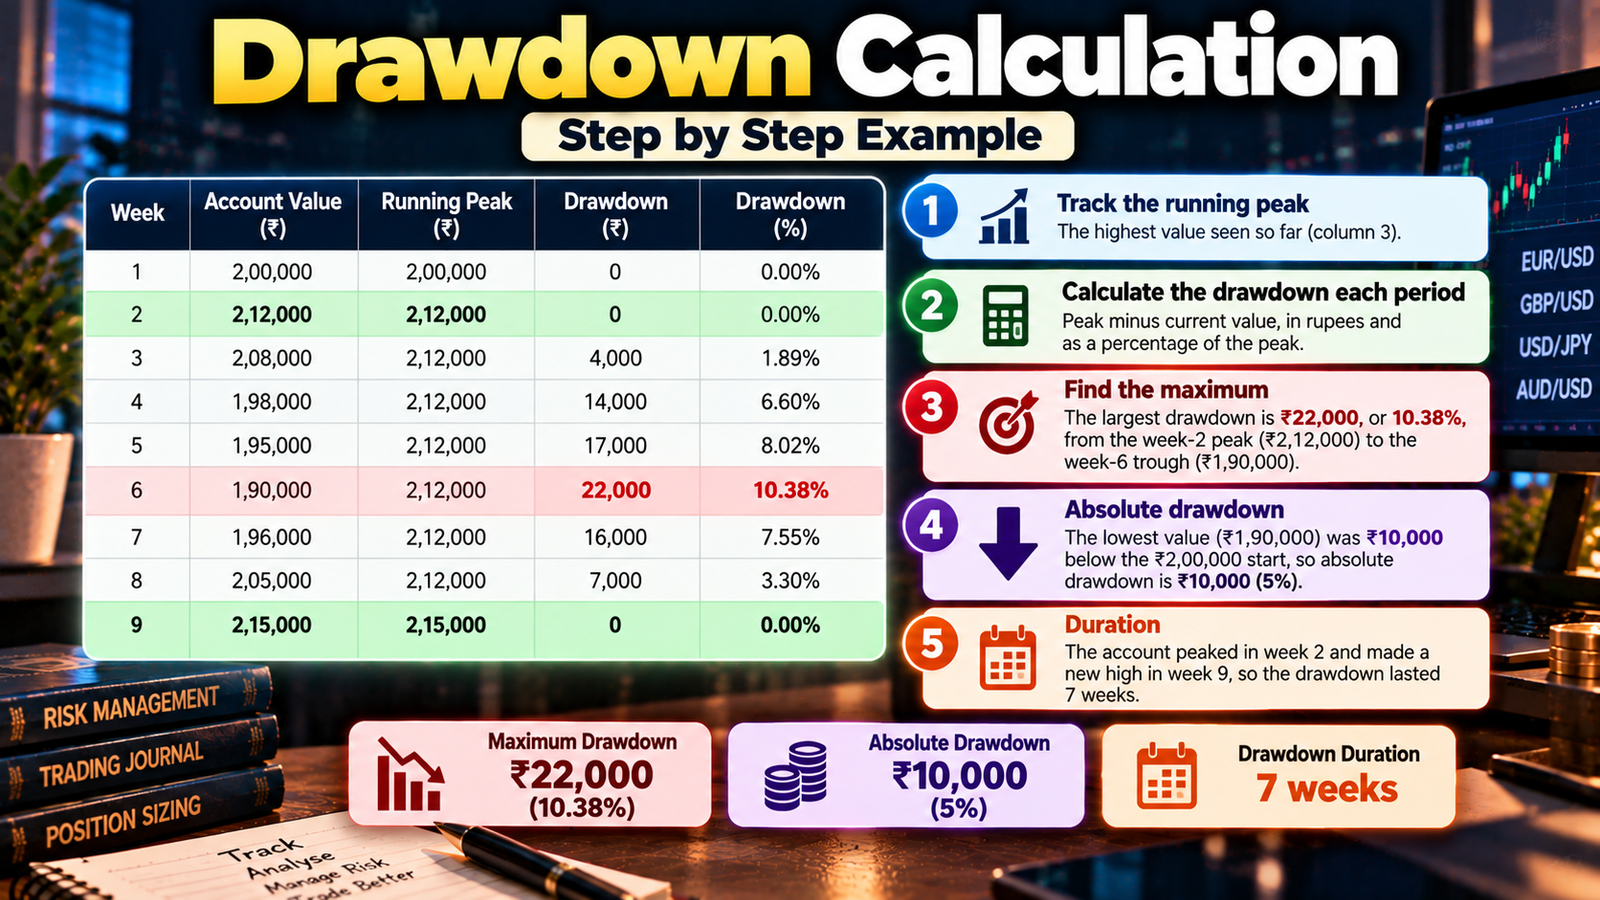
- Track the running peak: the highest value seen so far (column 3).
- Calculate the drawdown each period: peak minus current value, in rupees and as a percentage of the peak.
- Find the maximum: the largest drawdown is ₹22,000, or 10.38%, from the week-2 peak (₹2,12,000) to the week-6 trough (₹1,90,000).
- Absolute drawdown: the lowest value (₹1,90,000) was ₹10,000 below the ₹2,00,000 start, so absolute drawdown is ₹10,000 (5%).
- Duration: the account peaked in week 2 and made a new high in week 9, so the drawdown lasted 7 weeks.
Summary for this account
| Metric | Value |
|---|---|
| Net profit over 11 weeks | ₹22,000 (11%) |
| Maximum drawdown | ₹22,000 (10.38%) |
| Absolute drawdown | ₹10,000 (5%) |
| Longest drawdown duration | 7 weeks |
| Recovery factor (net profit ÷ max drawdown) | 22,000 ÷ 22,000 = 1.0 |
The account ended up 11%, but at one point it was more than 10% below its high. That is the risk a trader actually had to sit through.
Why deep drawdowns are dangerous: recovery maths
Gain needed to recover = Drawdown ÷ (1 − Drawdown)
| Drawdown | Gain needed to get back to the peak | Months to recover at 2% a month (compounded) |
|---|---|---|
| 5% | 5.3% | — |
| 10% | 11.1% | about 5.3 |
| 20% | 25.0% | about 11.3 |
| 30% | 42.9% | about 18.0 |
| 40% | 66.7% | — |
| 50% | 100.0% | about 35.0 |
| 75% | 300.0% | — |
The months column assumes a steady 2% monthly return, which few traders sustain. It shows the shape of the problem: recovery time grows much faster than the drawdown itself.
Useful drawdown ratios
| Ratio | Formula | What it tells you |
|---|---|---|
| Recovery factor | Net profit ÷ maximum drawdown | How much profit the strategy earned for each rupee of peak-to-trough pain; above 2–3 over a long record is generally considered healthy |
| Calmar ratio | Annualised return ÷ maximum drawdown | Return per unit of drawdown risk, usually measured over three years |
| Return-to-drawdown | Total return % ÷ max drawdown % | A quick check that returns justify the drawdowns |
These ratios need a long track record (ideally 100+ trades or several years) to mean much.
Real market drawdowns: Nifty 50
| Event | Peak | Trough | Drawdown | Recovery |
|---|---|---|---|---|
| 2008 global financial crisis | about 6,357 (January 2008) | about 2,253 (October 2008) | about 65% | Did not sustainably regain the peak until around late 2013 |
| 2020 Covid crash | about 12,431 (January 2020) | about 7,511 (March 2020) | about 40% | Back above the old peak by November 2020 |
Even the broad Indian market has had drawdowns of 40–65%. A leveraged trading account can fall much faster, which is why individual traders need their own drawdown limits.
How to manage drawdown
1. Control it with position size
Drawdown after consecutive losses, risking a fixed percentage of current capital:
| Losses in a row | 0.5% risk | 1% risk | 2% risk |
|---|---|---|---|
| 5 | 2.5% | 4.9% | 9.6% |
| 10 | 4.9% | 9.6% | 18.3% |
Smaller risk per trade is the single most effective drawdown control. See the lot size calculator to turn a risk percentage into lots.
2. Set drawdown “circuit breakers” in advance
| Drawdown from peak | Action (example rules) |
|---|---|
| 5% | Review recent trades for rule breaks |
| 10% | Halve risk per trade |
| 15% | Stop live trading; paper-trade and review the strategy |
| 20% | Full reassessment before any further live trading |
Choose levels that fit your strategy. A useful anchor is 1.5–2 times the worst drawdown in your backtest or past record.
3. Return to full size gradually
Restore normal risk only after a condition you set in advance, for example recovering half the drawdown, or 10–20 trades that followed the plan exactly.
4. Watch equity, not just balance
Track floating losses on open positions. A position held without a stop can create a deep equity drawdown that doesn’t show up in closed-trade results until it’s too late.
Spreadsheet formulas
Put the date in column A and account value in column B, starting in row 2.
| Column | Label | Formula in row 2 | Formula in row 3 (copy down) |
|---|---|---|---|
| C | Running peak | =B2 | =MAX(C2,B3) |
| D | Drawdown (₹) | =C2-B2 | =C3-B3 |
| E | Drawdown (%) | =D2/C2 | =D3/C3 |
Then:
- Maximum drawdown %: =MAX(E:E)
- Maximum drawdown ₹: =MAX(D:D)
- Absolute drawdown: =MAX(0, B2-MIN(B:B))
- Recovery factor: =(last value – B2) / MAX(D:D)
Check: the 12 weekly values in the worked example give a maximum drawdown of 10.38% (₹22,000) and an absolute drawdown of ₹10,000.
Expert analysis
Fact: a 30% drawdown needs a 42.9% gain to recover; a 50% drawdown needs 100%.
Fact: Nifty 50 fell about 40% from January to March 2020 and about 65% from January to October 2008.
Analysis: maximum drawdown is often a better guide to real risk than volatility or win rate. It shows what a trader actually had to live through, and whether they would have kept following the plan.
Analysis: a backtest’s maximum drawdown is usually an underestimate of what live trading will produce. Future streaks can be longer, and real execution adds slippage and emotion. Planning for 1.5–2 times the historical maximum is a sensible buffer.
Analysis: in India, SEBI found about 91% of individual F&O traders lost money in FY25. High leverage turns ordinary losing streaks into deep drawdowns, and deep drawdowns lead to the revenge trading and oversizing that make things worse.
Opinion: for beginners, the most important number to set is not a profit target but a maximum drawdown you will not go beyond, with rules to cut risk before you reach it.
Common mistakes
- Measuring drawdown from starting capital instead of from the peak.
- Tracking only closed trades and ignoring floating losses.
- Judging a strategy’s risk on a short backtest.
- Increasing size during a drawdown to recover faster.
- Having no pre-set limit, so every decision is made under stress.
- Confusing a single large loss with a drawdown (a drawdown can build from many small losses).
Myths vs facts
| Myth | Fact |
|---|---|
| A 50% loss needs a 50% gain to recover | It needs a 100% gain |
| If I’m in profit for the year, I’m not in drawdown | You can be up overall and still be well below your peak |
| A good strategy has no drawdowns | Every strategy has them; the question is how deep and how long |
| Backtest max drawdown is the worst that can happen | Live drawdowns are often deeper |
| Bigger size helps recover a drawdown faster | It also makes the drawdown deeper if losses continue |
Key takeaways
- Drawdown % = (Peak − Current) ÷ Peak × 100.
- Maximum drawdown is the largest peak-to-trough fall; absolute drawdown is the fall below starting capital.
- Track equity (including open losses), not just closed trades.
- Recovery gets much harder as drawdown deepens: 20% needs 25%, 50% needs 100%.
- Recovery factor = net profit ÷ maximum drawdown.
- Control drawdown with small risk per trade (0.5–1%) and pre-set circuit breakers.
- Plan for live drawdowns 1.5–2 times deeper than your backtest shows.
FAQs
1. What is drawdown in forex?
Drawdown is the fall in your account value from its highest point before it makes a new high, usually shown as a percentage of that peak.
2. How do you calculate drawdown?
Drawdown % = (Peak value − Current value) ÷ Peak value × 100.
3. What is maximum drawdown?
It is the largest peak-to-trough fall over a period. In the worked example, it is ₹22,000, or 10.38%.
4. What is the difference between absolute and relative drawdown?
Absolute drawdown measures how far the account fell below its starting capital. Relative drawdown measures the largest fall as a percentage of the peak it fell from.
5. Is drawdown the same as a loss?
No. A loss is measured from your entry or starting capital. Drawdown is measured from the account’s highest point and can span many trades.
6. What is a good maximum drawdown?
There’s no single number. Many traders aim to keep it below 10–20%. What matters is that it fits your risk tolerance and that returns justify it.
7. How much gain do I need to recover from a drawdown?
Gain needed = drawdown ÷ (1 − drawdown). A 20% drawdown needs 25%; 30% needs 42.9%; 50% needs 100%.
8. What is drawdown duration?
It is how long it takes to get back to the previous peak. In the worked example it was 7 weeks.
9. What is the difference between balance and equity drawdown?
Balance drawdown counts only closed trades. Equity drawdown includes open (floating) losses and is usually larger.
10. What is the recovery factor?
Net profit divided by maximum drawdown. It shows how much profit a strategy earned for each rupee of drawdown.
11. What is the Calmar ratio?
Annualised return divided by maximum drawdown, usually over three years. Higher means more return per unit of drawdown risk.
12. How do I calculate drawdown in Excel?
Track a running peak with =MAX(previous peak, current value), then drawdown = (peak − value) ÷ peak. Maximum drawdown is the MAX of that column.
13. How do I reduce drawdown?
Risk a small, fixed percentage per trade, set drawdown limits that cut risk automatically, and avoid increasing size during losing streaks.
14. What drawdown did the Nifty have in 2020?
Nifty 50 fell from about 12,431 in January 2020 to about 7,511 in March 2020, a drawdown of about 40%. It was back above the old peak by November 2020.
15. Should I stop trading during a drawdown?
Follow limits set in advance: review at a small drawdown, cut risk at a moderate one, and stop live trading at your maximum limit.
16. Why is my live drawdown bigger than my backtest?
Live trading adds slippage, emotional decisions and market conditions the backtest didn’t include. Plan for 1.5–2 times the backtest maximum.