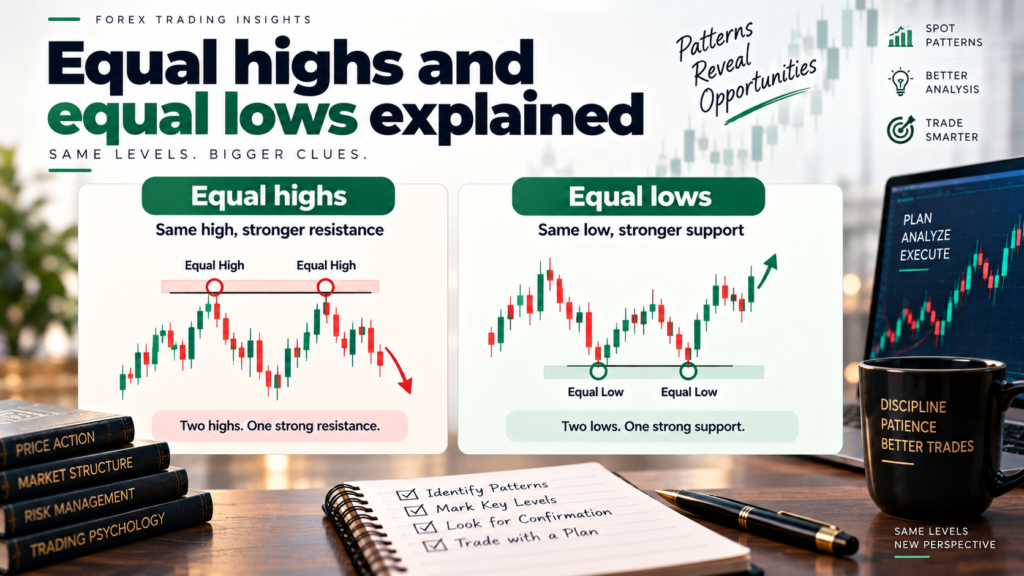
Quick answer: Equal highs are two or more swing highs at almost the same price. Equal lows are two or more swing lows at almost the same price. Both are easy to see on any chart, so many traders place stop-loss and breakout orders just beyond them. That makes them likely liquidity pools. When price returns, one of three things usually happens: it sweeps through and reverses, it breaks out and keeps going, or it holds and bounces as support or resistance. Wait for a candle close before deciding which.
Equal highs and lows are not a buy or sell signal on their own. They mark where a lot of orders are likely waiting, which makes them important places to watch and poor places to put your own stop-loss.
This guide defines them precisely, explains why they matter, walks through all three outcomes with Indian and global examples, and gives simple rules for trading around them.
What are equal highs and equal lows?
Definitions:
- Equal highs: two or more swing highs that peak at the same price, or within a small tolerance of each other, with a clear dip between them.
- Equal lows: two or more swing lows that bottom at the same price, or within a small tolerance of each other, with a clear rally between them.
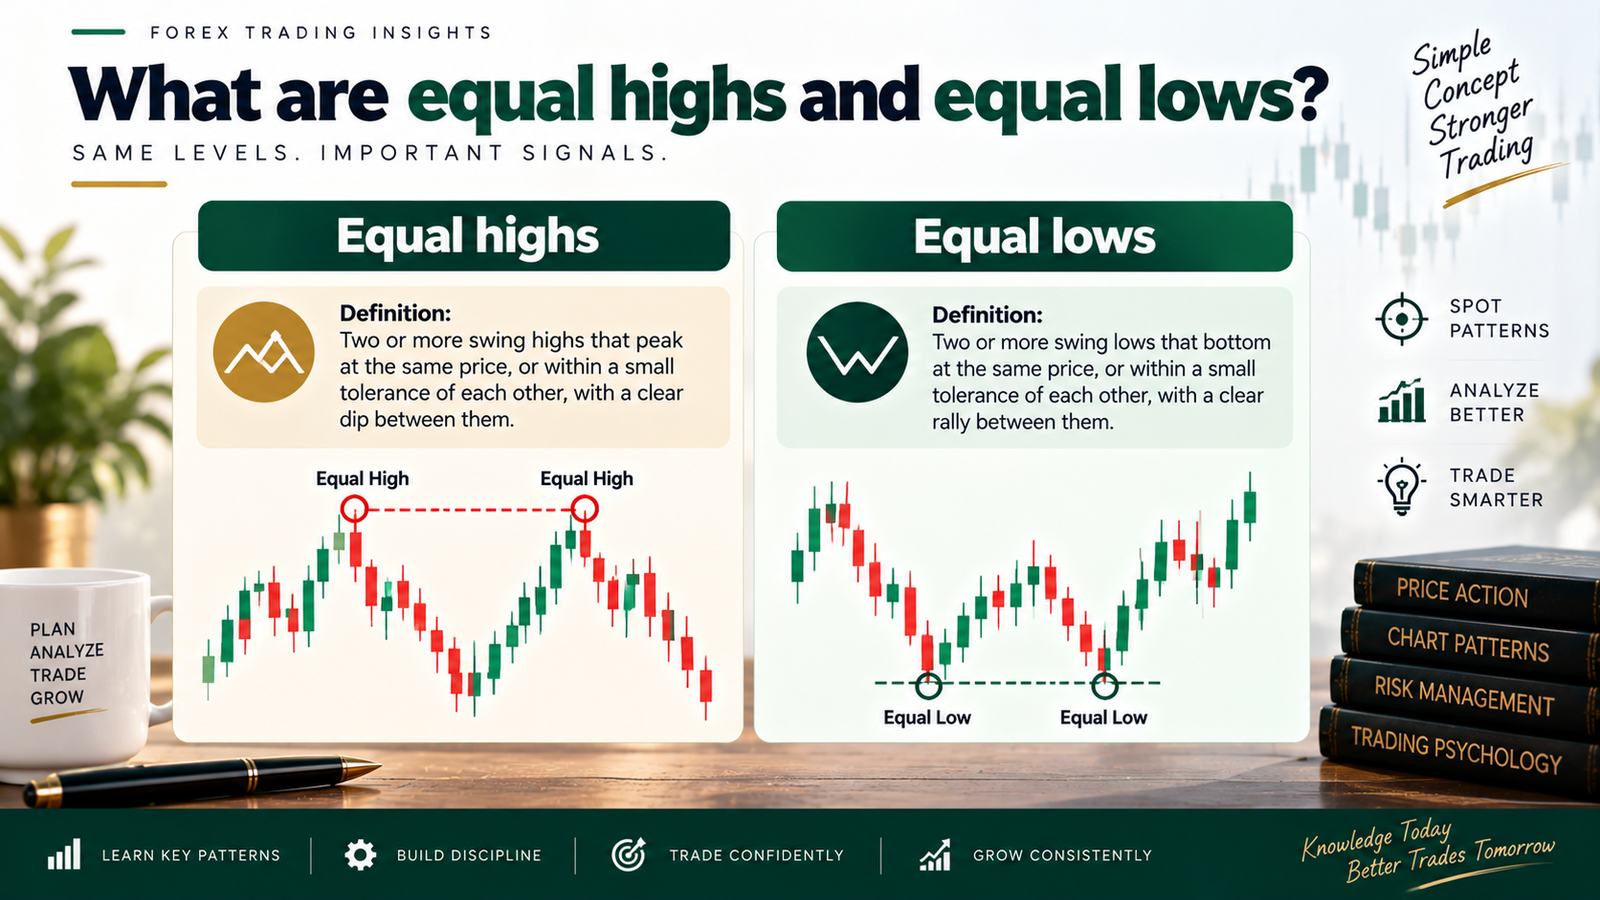
A swing high is a candle whose high is above the highs of the candles on either side. A swing low is the opposite. A common rule is at least two lower highs on each side of a swing high.
How close is “equal”?
Highs rarely match to the exact tick. Traders usually call them equal, or relatively equal, when the gap is small compared with normal price movement. A practical rule:
Two highs are equal if the gap between them is no more than 10% of the ATR(14) on that timeframe. At a minimum, allow a few ticks.
| Market (illustrative) | Timeframe ATR(14) | Tolerance (10% of ATR) | Example of “equal” |
|---|---|---|---|
| EUR/USD, 1-hour | 12 pips | about 1 pip | 1.1750 and 1.1751 |
| USD/INR futures, 1-hour | ₹0.08 (32 ticks) | about ₹0.008 (3 ticks) | ₹95.8000 and ₹95.8075 |
| Nifty futures, 15-minute | 40 points | about 4 points | 25,120 and 25,123 |
Using ATR keeps the rule consistent across markets and volatility levels.
Equal highs vs double tops
| Feature | Equal highs / lows | Double top / bottom |
|---|---|---|
| What it describes | Matching price levels | A reversal pattern |
| Number of touches | Two or more | Exactly two |
| Needs a confirmed reversal? | No | Yes: a close below the neckline (top) or above it (bottom) |
| Main use | Spotting where orders cluster | Signalling a trend change |
| Common in | Price-action, “smart money” and ICT-style content | Classic chart-pattern analysis |
Every double top contains equal highs, but most equal highs never turn into a completed double top.
Why equal highs and lows matter
1. They are where stops cluster
Because equal highs and lows are so visible, three groups of orders tend to build up just beyond them:
| Level | Orders likely resting just beyond it |
|---|---|
| Above equal highs | Buy stops from short sellers; breakout buy orders |
| Below equal lows | Sell stops from buyers; breakdown sell orders |
Traders call these zones buy-side liquidity (above highs) and sell-side liquidity (below lows).
2. What research actually shows
There is no public data on where retail stop-losses sit on any individual chart. But studies of real orders support the general idea that orders cluster at obvious levels:
- Osler (Federal Reserve Bank of New York), using a bank’s currency order book: take-profit orders cluster at round numbers, while stop-loss buy orders cluster just above round numbers and stop-loss sell orders just below them. Take-profit orders tend to reverse trends, while stop-loss orders tend to “propagate or intensify them.”
- Osler, follow-up study: exchange rates trend unusually fast once they reach levels where stop-loss orders cluster, and those moves can cascade. The effect lasted hours, not days.
- Lo, Mamaysky and Wang (Journal of Finance, 2000): using automated pattern recognition on US stocks, they found that several classic chart patterns, including double tops and bottoms, carried some incremental information about price moves. The effect was modest and not a guarantee of profit.

These studies looked at round numbers and chart patterns, not at “equal highs” as a named setup. Applying them here is a reasonable inference, not direct proof.
3. They are a warning sign for your own stops
If your stop sits one or two ticks beyond equal lows, it is in the same place as everyone else’s. A brief spike through the level can trigger it even if your trade idea was right.
What happens when price returns: three outcomes
flowchart TD
A[Price returns to<br/>equal highs or lows] –> B{How does the<br/>candle close?}
B — Back inside, long wick –> C[Sweep:<br/>likely reversal]
B — Beyond the level –> D{Does the retest<br/>hold?}
D — Yes –> E[Breakout:<br/>trend continues]
D — No –> C
B — Stops short of the level –> F[Hold:<br/>level acts as S/R]
The candle close is the first decision point. A retest after a close beyond the level is the second.
| Outcome | What you see | What it suggests |
|---|---|---|
| Sweep | Spike through the level, long wick, close back inside | Stops were triggered but price was rejected |
| Breakout | Close beyond the level, then a successful retest | Buyers or sellers took control; the old level may flip to support/resistance |
| Hold | Price turns before reaching the level | The level still acts as support or resistance; the pool stays in place |
Example 1: Sweep of equal lows in Nifty futures (illustrative)
- Nifty futures make two lows at 24,980 and 24,982 on the 15-minute chart (ATR about 40 points, so they count as equal).
- A trader is long 1 lot (65 units) at 25,040 with a stop at 24,975, just 5 points below the lows.
- A sharp dip hits 24,960. The stop fills at 24,972 with a little slippage. The 15-minute candle closes back at 24,995, inside the range.
- Loss = (24,972 − 25,040) × 65 = −₹4,420, before charges.
- Price then rallies to 25,150. The trade idea was right; the stop placement was not.
Example 2: Breakout of equal highs in USD/INR futures (illustrative)
- USD/INR futures form equal highs at ₹95.8000 and ₹95.8075.
- A 1-hour candle closes at ₹95.8400, above both. The next pullback retests ₹95.8100 and holds.
- A hedger with a genuine dollar exposure goes long 2 lots at ₹95.8150, with a stop at ₹95.7750 (back below the old highs) and a target of ₹95.9750.
- Risk = 0.04 × 1,000 × 2 = ₹80. Reward = 0.16 × 1,000 × 2 = ₹320. Risk/reward = 1:4.
Example 3: Equal lows hold in EUR/USD (illustrative)
- EUR/USD finds buyers at 1.1650 twice (1.1650 and 1.1651).
- On the third approach, price turns at 1.1656 without touching the lows, and a bullish candle closes at 1.1672.
- The equal lows act as support. The pool of sell stops below 1.1650 is still there, which is useful to know if you later place a stop below it.
How to trade around equal highs and lows: 6 rules
Rule 1: Mark them on a higher timeframe first
Find equal highs and lows on the 1-hour or 4-hour chart, then drop to a lower timeframe to plan entries. Levels on higher timeframes attract more orders.
Rule 2: Use a clear tolerance
Only call levels equal if they are within about 10% of ATR(14). This stops you from seeing “equal” levels everywhere.
Rule 3: Never act on the wick—wait for the close
| Candle close | Read it as | Possible action |
|---|---|---|
| Back inside the range, long wick | Sweep | Consider a reversal trade, with the stop beyond the wick |
| Beyond the level | Possible breakout | Wait for a retest that holds before entering |
| Short of the level | Hold | Treat the level as support/resistance; the pool is still intact |
Rule 4: Don’t put your stop in the pool
Place your stop beyond the obvious level plus a volatility buffer of about 0.5 to 1 × ATR.
Nifty example (illustrative): equal lows at 24,980; 15-minute ATR = 40 points.
| Stop placement | Stop level | Risk from 25,040 entry, per lot (65) |
|---|---|---|
| Obvious (5 points below) | 24,975 | 65 × 65 = ₹4,225 |
| Low − 0.75 × ATR | 24,950 | 90 × 65 = ₹5,850 |
The safer stop costs more per lot. If ₹5,850 is more than your risk limit, the answer is not a tighter stop but a better entry. Buying at 25,000 instead of 25,040 cuts the risk to 50 × 65 = ₹3,250 with the same safe stop.
Rule 5: Keep rupee risk fixed with position size
Lots = risk amount ÷ risk per lot
USD/INR example (illustrative): ₹1,000 risk budget (1% of ₹1 lakh).
| Stop distance | Risk per lot (ticks × ₹2.50) | Lots |
|---|---|---|
| 20 ticks | ₹50 | 20 |
| 40 ticks | ₹100 | 10 |
| 80 ticks | ₹200 | 5 |
Index futures can’t be split below one lot. If one lot is too much risk for your stop, skip the trade or use a smaller instrument.
Rule 6: Check context before acting
- Trend: a sweep of equal lows in an uptrend is more reliable than one in a downtrend.
- News: avoid acting in the minutes around RBI policy, US Fed decisions, US jobs data or major Indian data.
- Timing: sweeps often happen at the market open (9:15 am IST for Nifty) or the London and New York opens for forex.
Checklist before a trade near equal highs or lows
- ☐ The levels are within about 10% of ATR of each other.
- ☐ I have waited for a candle close, not just a wick.
- ☐ My stop is beyond the level plus an ATR buffer.
- ☐ My position size keeps risk to 1–2% of capital.
- ☐ Risk/reward is at least 1:2.
- ☐ No major news is due in the next 30 minutes.
Expert analysis
Fact: research on real currency orders at the Federal Reserve Bank of New York found that stop-loss orders cluster just beyond round numbers and can intensify price moves when triggered, while take-profit orders at round numbers tend to slow or reverse them.
Fact: Lo, Mamaysky and Wang (2000) found that some chart patterns, including double tops and bottoms, carried modest incremental information in US stock data.
Analysis: equal highs and lows are visible and widely taught, so it is reasonable to expect orders to gather beyond them, just as they do beyond round numbers. That makes them good places to watch. It does not make any single outcome predictable in advance.
Analysis: most online examples of equal-high sweeps are chosen after the fact. The same chart often shows equal highs that broke cleanly and never reversed. Test any rule on a sample of past charts, count failures as well as wins, and include charges.
Analysis: in Indian markets, SEBI’s studies found that about 9 in 10 individual F&O traders lost money in FY22–FY25. No chart pattern changes those odds by itself. Fixed risk, sensible stop placement and fewer trades matter more than spotting the perfect sweep.
Opinion: for beginners, the most useful thing about equal highs and lows is defensive: knowing where the crowd’s stops are so yours aren’t among them.
Common mistakes
- Calling any two nearby peaks “equal” without a clear tolerance.
- Trading the reversal on a wick before the candle closes.
- Placing stops a few ticks beyond equal lows or highs.
- Tightening a stop to fit a risk limit instead of improving the entry or skipping the trade.
- Ignoring the higher-timeframe trend and scheduled news.
- Treating hand-picked social media charts as proof that a pattern works.
Myths vs facts
| Myth | Fact |
|---|---|
| Equal highs always get swept | Many break out and keep going; wait for the close |
| Equal lows are strong support | They can hold, but they also attract sell stops that can speed a breakdown |
| Equal highs are always bearish | They are neutral; the close and the retest decide the direction |
| Big players can see your exact stop | No public evidence supports this; clustering at obvious levels explains the moves |
| A tighter stop reduces risk | It often just raises the chance of being stopped out; size is the real risk control |
Key takeaways
- Equal highs and equal lows are two or more swing points at almost the same price.
- Call them equal only within a set tolerance, such as 10% of ATR(14).
- Stop-loss and breakout orders are likely to cluster just beyond them.
- When price returns, expect a sweep, a breakout or a hold; the candle close decides which.
- Place stops beyond the level plus 0.5–1 × ATR, and control risk with position size.
- Research supports order clustering at obvious levels, but not guaranteed reversals.
- Wait for the close, check the trend and news, and keep risk to 1–2% per trade.
FAQs
1. What are equal highs in trading?
Equal highs are two or more swing highs that peak at the same price, or within a small tolerance of each other, with a clear dip between them.
2. What are equal lows in trading?
Equal lows are two or more swing lows that bottom at the same price, or very close to it, with a clear rally between them.
3. How close do highs need to be to count as equal?
A practical rule is within about 10% of the ATR(14) for that timeframe. For EUR/USD on a 1-hour chart with a 12-pip ATR, that is about 1 pip.
4. Are equal highs bullish or bearish?
Neither by themselves. The direction depends on how price behaves when it returns: a close back inside suggests a sweep, a close beyond with a successful retest suggests a breakout.
5. Why does price often move to equal highs or lows?
Stop-loss and breakout orders are likely to cluster just beyond them. Those orders provide volume that larger participants can trade against.
6. What is the difference between equal highs and a double top?
Equal highs simply describe matching peaks. A double top is a reversal pattern that needs a close below the neckline to confirm.
7. What is buy-side liquidity?
It is the cluster of buy orders, mainly buy stops and breakout buys, likely resting just above equal highs or other obvious highs.
8. What is sell-side liquidity?
It is the cluster of sell orders, mainly sell stops and breakdown sells, likely resting just below equal lows or other obvious lows.
9. How do I tell a sweep of equal highs from a breakout?
Wait for the candle close. A sweep closes back below the level with a long upper wick. A breakout closes above it and usually holds on a retest.
10. Where should I put my stop-loss near equal lows?
Below the equal lows plus a buffer of about 0.5 to 1 × ATR, not a few ticks below. Reduce position size to keep your risk fixed.
11. Do equal highs and lows work on Nifty and Bank Nifty?
The same order-clustering logic applies to any liquid market, including Nifty futures. Test any rule on past Nifty charts before trading it.
12. Do equal highs and lows work in USD/INR futures?
The concept applies, but rupee futures have had thinner order books since 2024. Sweeps can trigger stops with more slippage. Rupee-linked currency derivatives also require a genuine underlying exposure under RBI rules.
13. Which timeframe is best for finding equal highs and lows?
Start on the 1-hour or 4-hour chart for major levels, then use a lower timeframe such as 15 minutes to time entries.
14. Are three equal highs stronger than two?
Three touches usually mean more attention and more orders beyond the level. It can make a sweep or breakout more forceful, but it does not tell you which one will happen.
15. Is there scientific evidence for equal highs and lows?
There is research showing stop-loss orders cluster at obvious levels such as round numbers, and some evidence that classic chart patterns carry modest information. There is no direct study proving equal-high setups are profitable.
16. Can I trade equal highs and lows on offshore forex apps?
Indian residents may trade permitted currency derivatives on recognised Indian exchanges. Trading on overseas online forex platforms is illegal under FEMA.