Quick answer: In forex, liquidity means how easily a currency can be bought or sold without moving its price much. Traders also use the word for specific chart areas, called liquidity pools, where many stop-loss and pending orders are likely to sit, such as just above a recent high or just below a recent low. A liquidity sweep is a quick move through one of those areas that triggers the orders and then reverses. You can spot likely pools at obvious highs, lows and round numbers, and protect yourself by not placing stops exactly where everyone else does.
Most confusion comes from mixing up these two meanings. Market liquidity is measurable: turnover, spreads and order-book depth. Liquidity pools and sweeps are a way of reading charts. They describe real order behaviour, but many online claims about them go far beyond what anyone can verify.
This guide explains both meanings, shows how sweeps form with worked examples, gives a checklist for spotting them, and covers how to manage risk around them.
What liquidity means in forex
1. Market liquidity
Definition: Market liquidity is how easily you can trade an amount of currency close to the current price. Signs of high liquidity are tight bid-ask spreads, deep order books and small price impact from large orders.
The global FX market is the most liquid market in the world. According to the BIS Triennial Survey, turnover averaged $9.6 trillion a day in April 2025, up 28% from 2022.
| Currency | Share of global FX turnover, April 2025 |
|---|---|
| US dollar | 89.2% |
| Euro | 28.9% |
| Japanese yen | 16.7% |
| British pound | 10.2% |
| Chinese yuan | 8.5% |
| Indian rupee | 1.9% (11th) |
Shares add up to 200% because every trade involves two currencies. The UK (about 38%), US (about 19%), Singapore (11.8%) and Hong Kong (7.0%) together handled 75% of all trading.
What this means for Indian traders: major pairs such as EUR/USD are far more liquid than INR pairs. On NSE, liquidity in rupee currency futures also fell sharply after RBI’s May 2024 underlying-exposure rule, when average daily turnover dropped 87% in a month. Thinner liquidity means wider spreads and bigger jumps between prices.
Liquidity changes through the day
| Session | Approx. IST (northern summer) | Liquidity |
|---|---|---|
| Tokyo | 5:30 am – 2:30 pm | Moderate; yen pairs most active |
| London | 12:30 pm – 9:30 pm | High |
| London–New York overlap | 5:30 pm – 9:30 pm | Highest for major pairs |
| New York | 5:30 pm – 2:30 am | High early, thinning late |
| NSE currency futures | 9:00 am – 5:00 pm | Rupee contracts only |
Session times shift by about an hour when the UK and US change clocks. Treat them as approximate.
2. Chart-based “liquidity”
In many trading courses, especially “smart money concepts” or ICT-style content, liquidity means resting orders at a price level. Buy-side liquidity refers to buy orders above highs (buy stops from short sellers and breakout buy orders). Sell-side liquidity refers to sell orders below lows (sell stops from buyers and breakdown sell orders). The rest of this guide uses the word in this second sense.
What is a liquidity pool?
Definition: A liquidity pool is a price area where many pending orders, mostly stop-losses and breakout entries, are likely to be sitting. The idea is simple: traders tend to put orders in the same obvious places.
Where pools usually form
| Location | Orders likely resting there | Why traders put them there |
|---|---|---|
| Just above a recent swing high | Buy stops from short sellers; breakout buy orders | Textbooks say “put your stop above the high” |
| Just below a recent swing low | Sell stops from buyers; breakdown sell orders | Textbooks say “put your stop below the low” |
| Equal highs or equal lows (double tops/bottoms) | A dense cluster of the above | The level looks obvious to everyone |
| Round numbers (e.g., 1.1700, ₹96.00) | Stops, targets and limit orders | People like round prices |
| Previous day, week or month high/low | Stops and breakout orders | Widely watched reference levels |
| Edges of a tight range | Stops on both sides | Range traders protect just outside the box |
| Trend lines touched many times | Stops just beyond the line | Visible on almost every chart |
Why pools matter
Large participants need someone to trade with. A big buyer is easier to fill where many sell orders are waiting, for example when a cluster of sell stops below a low is triggered. That is why price is often drawn towards these areas. It does not mean anyone can see individual retail stops. In a decentralised spot market, no single participant sees the whole order book. It simply means order clusters create a pocket of available volume.
Limits of what we know: there is no public, market-wide data on where retail stop-losses sit in spot forex. Pools are an informed guess based on where orders usually go, not a map of where they are.
What is a liquidity sweep?
Definition: A liquidity sweep (also called a stop hunt or liquidity grab) is a quick price move through a liquidity pool that triggers the resting orders, followed by a fast reversal back inside the previous range.
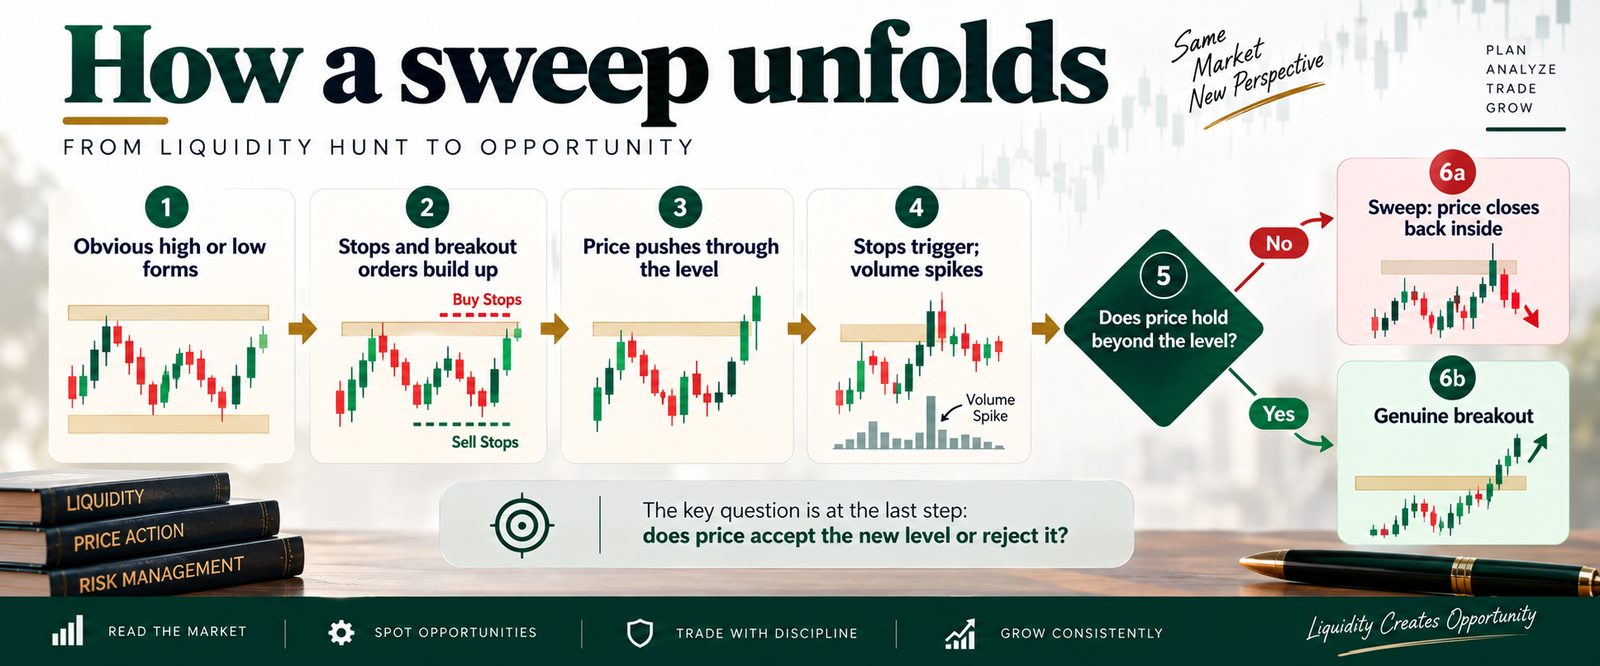
How a sweep unfolds
flowchart LR
A[Obvious high or low<br/>forms] –> B[Stops and breakout<br/>orders build up]
B –> C[Price pushes through<br/>the level]
C –> D[Stops trigger;<br/>volume spikes]
D –> E{Does price hold<br/>beyond the level?}
E — No –> F[Sweep: price closes<br/>back inside]
E — Yes –> G[Genuine breakout]
The key question is at the last step: does price accept the new level or reject it?
Sweep vs genuine breakout
| Feature | Liquidity sweep | Genuine breakout |
|---|---|---|
| Candle close | Closes back inside the prior range | Closes beyond the level |
| Wick | Long wick through the level | Small wick; body carries through |
| Follow-through | Little or none; quick reversal | Continues in the breakout direction |
| Retest | Often no retest; price moves away | Often retests the broken level as new support/resistance |
| Timing | Common at session opens and around news | Often backed by a news-driven shift or a strong trend |
Example 1: EUR/USD equal highs (illustrative)
- EUR/USD makes two highs at 1.1750 during the Asian session. Many short sellers put buy stops at 1.1755–1.1760.
- At the London open, price spikes to 1.1762, triggering those stops. The 15-minute candle leaves a long upper wick and closes at 1.1738, back below 1.1750.
- Price then falls to 1.1705 over the next few hours.
A short seller with a stop at 1.1756 was stopped out 6 pips from the high, just before price moved 45 pips in the direction they expected.
Example 2: USD/INR futures, previous day’s low (illustrative)
- The previous session’s low in USD/INR futures was ₹95.4000.
- A hedger is long 5 lots at ₹95.5000 with a stop at ₹95.3950, just below that low.
- Early the next day, a thin order book lets price dip to ₹95.3675. The stop triggers and fills at ₹95.3800 because of slippage.
- Loss = (95.3800 − 95.5000) × 1,000 × 5 = −₹600, before charges.
- By noon, the price is back at ₹95.4500.
In rupee futures, where order books have been thinner since 2024, a stop placed just a few ticks beyond an obvious level is especially exposed to this.
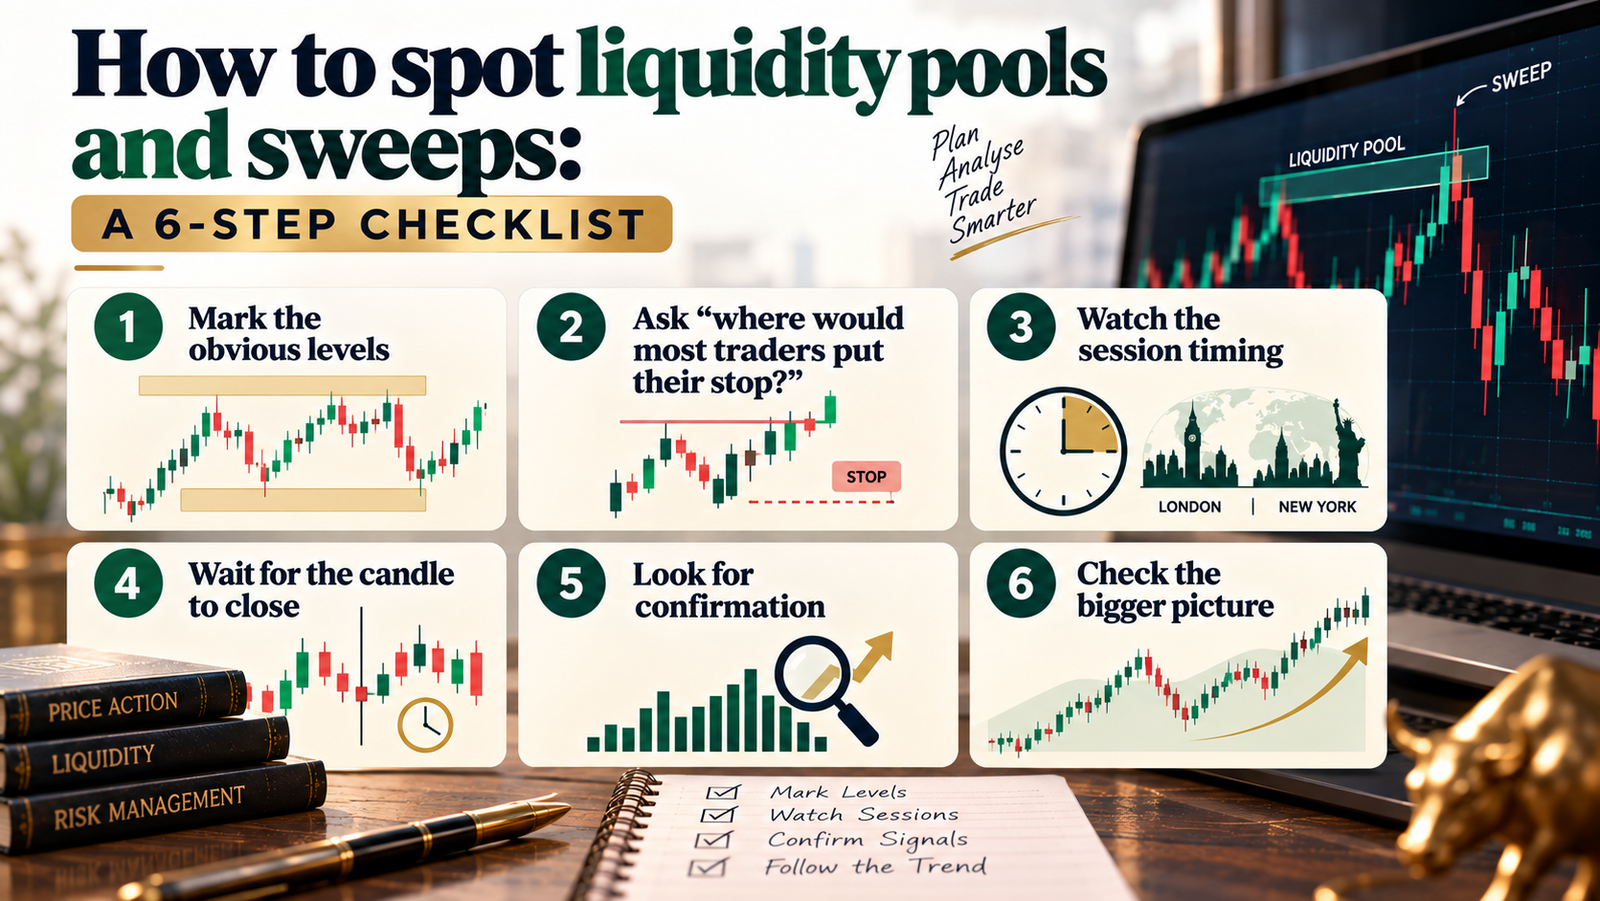
How to spot liquidity pools and sweeps: a 6-step checklist
Step 1: Mark the obvious levels
On a higher timeframe (1-hour or 4-hour), mark the previous day’s high and low, recent swing highs and lows, any equal highs or lows, and the nearest round numbers. These are your candidate pools.
Step 2: Ask “where would most traders put their stop?”
If a textbook trader would place a stop just beyond a level, assume many did. The more obvious the level, the bigger the likely pool.
Step 3: Watch the session timing
Sweeps are common at the start of the London and New York sessions (around 12:30 pm and 5:30 pm IST in the northern summer) and in the minutes around big data releases, such as US jobs data, US inflation data, Fed or ECB decisions and RBI policy announcements.
Step 4: Wait for the candle to close
A wick through a level is not a signal on its own. Wait for the candle to close:
- Closes back inside the range: possible sweep.
- Closes beyond the level and holds on the next candle: more likely a genuine breakout.
Step 5: Look for confirmation
| Confirmation sign | What it suggests |
|---|---|
| Long wick, small body beyond the level | Orders were absorbed and price was rejected |
| Volume or tick-volume spike on the wick | Stops triggered in a burst |
| A break of a short-term swing in the opposite direction | Momentum has shifted |
| No retest of the level from the new side | The breakout lacked follow-through |
Spot forex has no central volume figure; platforms show broker tick volume. On NSE currency futures, you can see real exchange volume and five levels of market depth for each contract.
Step 6: Check the bigger picture
A sweep against a strong higher-timeframe trend often fails. A sweep that lines up with the higher-timeframe direction is more reliable. Always check for scheduled news before acting on any pattern.
Using NSE market depth (for rupee futures)
NSE shows the best five bid and ask prices and their quantities for each currency futures contract. Signs of thin liquidity include:
- A wide gap between the best bid and ask (several ticks rather than one).
- Small quantities at each level.
- Large gaps between consecutive price levels.
When depth is thin, a market order or triggered stop can fill several ticks away, which is exactly what happened in Example 2.
Managing risk around liquidity sweeps
Place stops away from the obvious spot
Instead of a stop a few pips or ticks beyond a swing, add a buffer based on normal volatility, for example half to one times the Average True Range (ATR) of your timeframe.
Illustrative EUR/USD example: swing low 1.1700; 1-hour ATR(14) = 12 pips.
| Stop placement | Stop level | Distance from 1.1720 entry |
|---|---|---|
| Obvious (2 pips below low) | 1.1698 | 22 pips |
| Low + 0.5 × ATR buffer | 1.1694 | 26 pips |
| Low + 1 × ATR buffer | 1.1688 | 32 pips |
Keep risk fixed by cutting size
A wider stop does not have to mean more risk. Reduce the number of lots so the rupee amount at risk stays the same.
Position size (lots) = risk amount ÷ (stop distance in ticks × ₹2.50)
| USD/INR stop distance | Risk per lot | Lots for ₹1,000 risk (1% of ₹1 lakh) |
|---|---|---|
| 20 ticks (5 paise) | ₹50 | 20 |
| 40 ticks (10 paise) | ₹100 | 10 |
| 80 ticks (20 paise) | ₹200 | 5 |
At about ₹2,281 margin per lot (23 September 2026), 20 lots needs about ₹45,600 margin and 5 lots about ₹11,400. The wider stop is also less capital-intensive.
Other protections
- Avoid placing new orders in the minutes before major data releases.
- Use limit orders instead of market orders in thin contracts.
- If you are stopped out by a sweep, don’t immediately re-enter bigger to “win it back.” That is revenge trading.
Expert analysis
Fact: global FX turnover averaged $9.6 trillion a day in April 2025 (BIS), with the rupee at 1.9% of turnover, 11th among currencies.
Fact: research by Carol Osler at the Federal Reserve Bank of New York, using real currency order data, found that exchange rates trend unusually fast when they reach levels where stop-loss orders cluster. Stop-loss orders can be “triggered in waves, contributing to price cascades,” and the effect lasted hours, not days. Her related work found that orders tend to cluster at round numbers.
Analysis: the mechanism behind sweeps is real. When many stops trigger at once they become market orders, which can push price briefly through a level before normal supply and demand return. What is not proven is the popular claim that specific banks deliberately “hunt” retail stops as a strategy. In a decentralised market, no one sees everyone’s stops. Sweeps are better explained as order clustering meeting temporary thin liquidity.
Analysis: many social media patterns are shown only in hindsight, on charts where the outcome is already known. Before trusting any sweep-based strategy, test it on past data with fixed rules, and count the failures as well as the winners.
Opinion: for beginners, the most useful takeaway is defensive, not offensive: learn where pools are so your own stops don’t sit in them.
Common mistakes
- Treating every wick through a level as a sweep and trading the reversal immediately.
- Putting stops exactly one or two pips beyond an obvious high or low.
- Confusing market liquidity (spreads, depth) with chart “liquidity pools.”
- Trading sweep patterns in thin markets, around news, or late in the New York session.
- Believing a pattern works because it looks convincing on a hand-picked chart.
- Following offshore “smart money” signal groups that use platforms unauthorised in India.
Myths vs facts
| Myth | Fact |
|---|---|
| Banks can see your stop-loss and target it | No participant sees all orders in decentralised spot forex |
| Every stop-out was a stop hunt | Most stops are hit because the trade idea was wrong |
| Sweeps always reverse | Many become genuine breakouts; wait for a close |
| Wider stops mean more risk | Not if you cut position size to keep rupee risk fixed |
| Liquidity concepts need special indicators | Highs, lows, round numbers and candle closes are enough to start |
Key takeaways
- Market liquidity is how easily a currency trades; forex averaged $9.6 trillion a day in April 2025.
- A liquidity pool is where many stop and breakout orders likely sit: beyond highs, lows, equal highs/lows and round numbers.
- A liquidity sweep pushes through a pool, triggers orders and quickly reverses back into the range.
- Tell a sweep from a breakout by the candle close, wick size and follow-through.
- Sweeps are common at session opens and around major news.
- Protect yourself with ATR-based buffers and smaller size, keeping rupee risk fixed.
- Deliberate “stop hunting” by banks is a popular claim, not an established fact.
FAQs
1. What is liquidity in forex trading?
Liquidity is how easily a currency can be bought or sold without moving its price much. In chart analysis, the word also refers to clusters of pending orders at certain price levels.
2. What is a liquidity pool in forex?
A liquidity pool is a price area where many stop-loss and breakout orders are likely to sit, such as just above a recent high or just below a recent low.
3. What is a liquidity sweep?
A liquidity sweep is a quick move through a liquidity pool that triggers the resting orders, followed by a fast reversal back into the previous range.
4. What is the difference between buy-side and sell-side liquidity?
Buy-side liquidity is the cluster of buy orders above highs, mainly buy stops and breakout buys. Sell-side liquidity is the cluster of sell orders below lows.
5. Is a liquidity sweep the same as a stop hunt?
The terms are used interchangeably. “Stop hunt” suggests someone deliberately targets stops, which is a popular claim but not an established fact.
6. How do I tell a sweep from a real breakout?
Wait for the candle to close. A sweep closes back inside the range with a long wick. A breakout closes beyond the level and usually continues or retests it.
7. Where do liquidity pools usually form?
Beyond swing highs and lows, at equal highs or lows, at round numbers, at the previous day’s or week’s high and low, and at the edges of tight ranges.
8. When are liquidity sweeps most common?
Around session opens, especially London and New York (about 12:30 pm and 5:30 pm IST in the northern summer), and around major economic data releases.
9. Do banks really hunt retail stop-losses?
There is no public evidence that banks can see individual retail stops in spot forex or target them as a strategy. Sweeps are better explained by orders clustering at obvious levels.
10. How can I avoid getting stopped out by a sweep?
Place stops beyond obvious levels with a volatility buffer, such as half to one ATR. Reduce position size so your rupee risk stays fixed.
11. Which forex session has the most liquidity?
The London–New York overlap, roughly 5:30 pm to 9:30 pm IST in the northern summer, is usually the most liquid for major pairs.
12. How liquid is the Indian rupee?
The rupee was 1.9% of global FX turnover in April 2025, ranking 11th, per the BIS Triennial Survey. It is far less liquid than the dollar or euro.
13. How can I check liquidity in NSE currency futures?
Look at the market depth window. It shows the best five bids and offers with their quantities. A wide bid-ask gap or small quantities mean thin liquidity.
14. Is trading liquidity sweeps profitable?
There is no reliable public evidence that sweep-based strategies are consistently profitable for retail traders. Test any strategy on past data with fixed rules before risking money.
15. Is it legal to trade forex liquidity strategies in India?
Indian residents may trade permitted currency derivatives on recognised Indian exchanges, subject to RBI rules. Trading on overseas online forex platforms is illegal under FEMA.
16. What is the difference between market liquidity and a liquidity pool?
Market liquidity describes how easily a currency trades overall. A liquidity pool is a specific price area where orders are likely to be clustered.