Quick answer
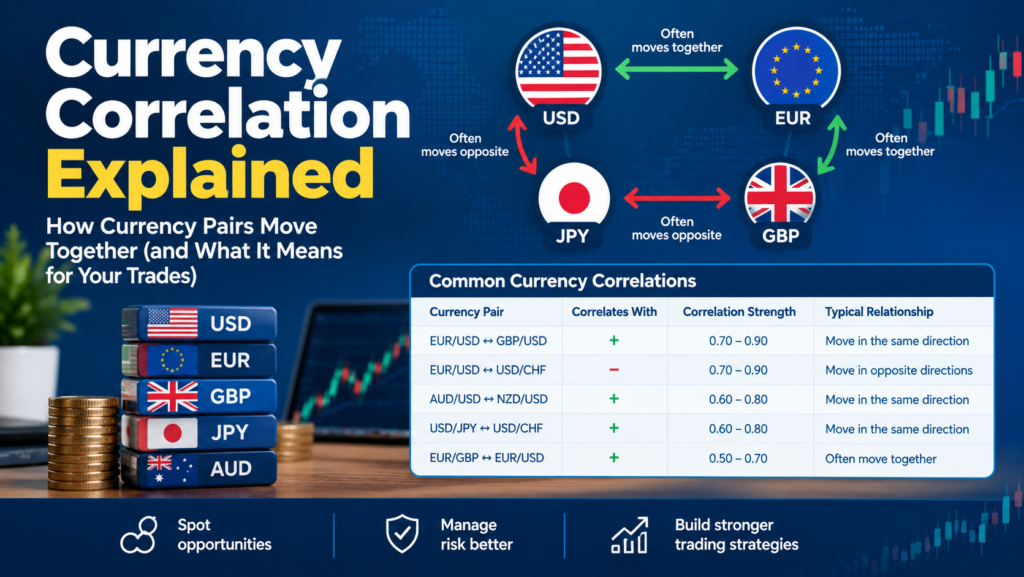
Currency correlation in forex trading measures how two currency pairs move in relation to each other, on a scale from -1 to +1. A value near +1 means they move together; near -1 means they move oppositely. In forex, correlation matters because trading two highly correlated pairs can secretly double your risk.
Introduction
You place two trades you think are separate – long EUR/USD and long GBP/USD – and feel diversified. In reality you may have just doubled a single bet, because those pairs usually move together. Understanding currency correlation forex traders live with is what turns that hidden risk into a managed one, and it is one of the most overlooked concepts in trading.
This guide explains currency correlation from the ground up: the coefficient scale, positive versus negative relationships, what drives them, and how to read a correlation table. Because real correlation values shift constantly, the table here is marked as illustrative – you should always confirm current values on a live tool. This is educational content, not financial advice.
What Is Currency Correlation?
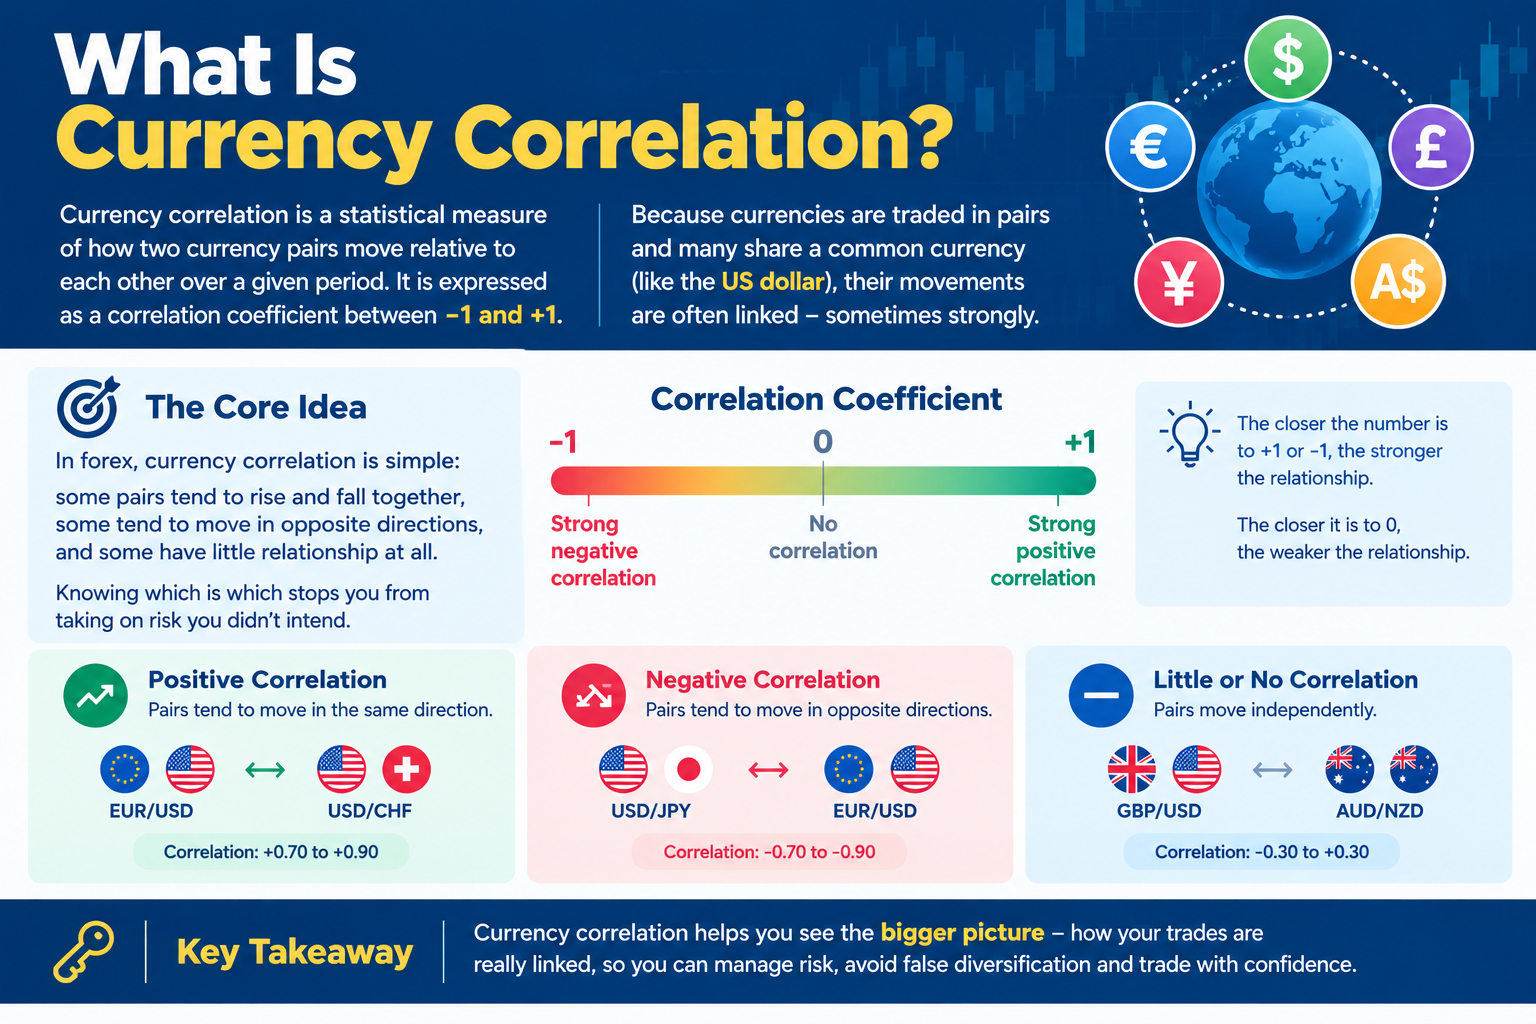
Currency correlation is a statistical measure of how two currency pairs move relative to each other over a given period. It is expressed as a correlation coefficient between -1 and +1. Because currencies are traded in pairs and many share a common currency (like the US dollar), their movements are often linked – sometimes strongly.
The core idea of currency correlation in forex is simple: some pairs tend to rise and fall together, some tend to move in opposite directions, and some have little relationship at all. Knowing which is which stops you from taking on risk you didn’t intend.
The Correlation Coefficient (-1 to +1)
The correlation coefficient quantifies the relationship. Here is how to read it:
| Coefficient range | Relationship | What it means |
|---|---|---|
| +0.7 to +1.0 | Strong positive | The pairs move together most of the time |
| +0.3 to +0.7 | Moderate positive | They often move together, but not always |
| -0.3 to +0.3 | Weak / none | Little to no reliable relationship |
| -0.7 to -0.3 | Moderate negative | They often move in opposite directions |
| -1.0 to -0.7 | Strong negative | They move oppositely most of the time |
A coefficient of +1 means perfect positive correlation (identical moves), -1 means perfect negative correlation (mirror-image moves), and 0 means no relationship. Real pairs rarely hit the extremes, but many sit in the strong ranges.
Positive vs Negative Correlation
Positive correlation
Positively correlated pairs move in the same direction. EUR/USD and GBP/USD are the classic example – both are quoted against the US dollar and both track European economies, so they usually rise and fall together.
Negative correlation
Negatively correlated pairs move in opposite directions. EUR/USD and USD/CHF are the textbook case: the dollar sits on opposite sides of the two pairs, so when one rises the other typically falls.
Why Currency Correlation Matters
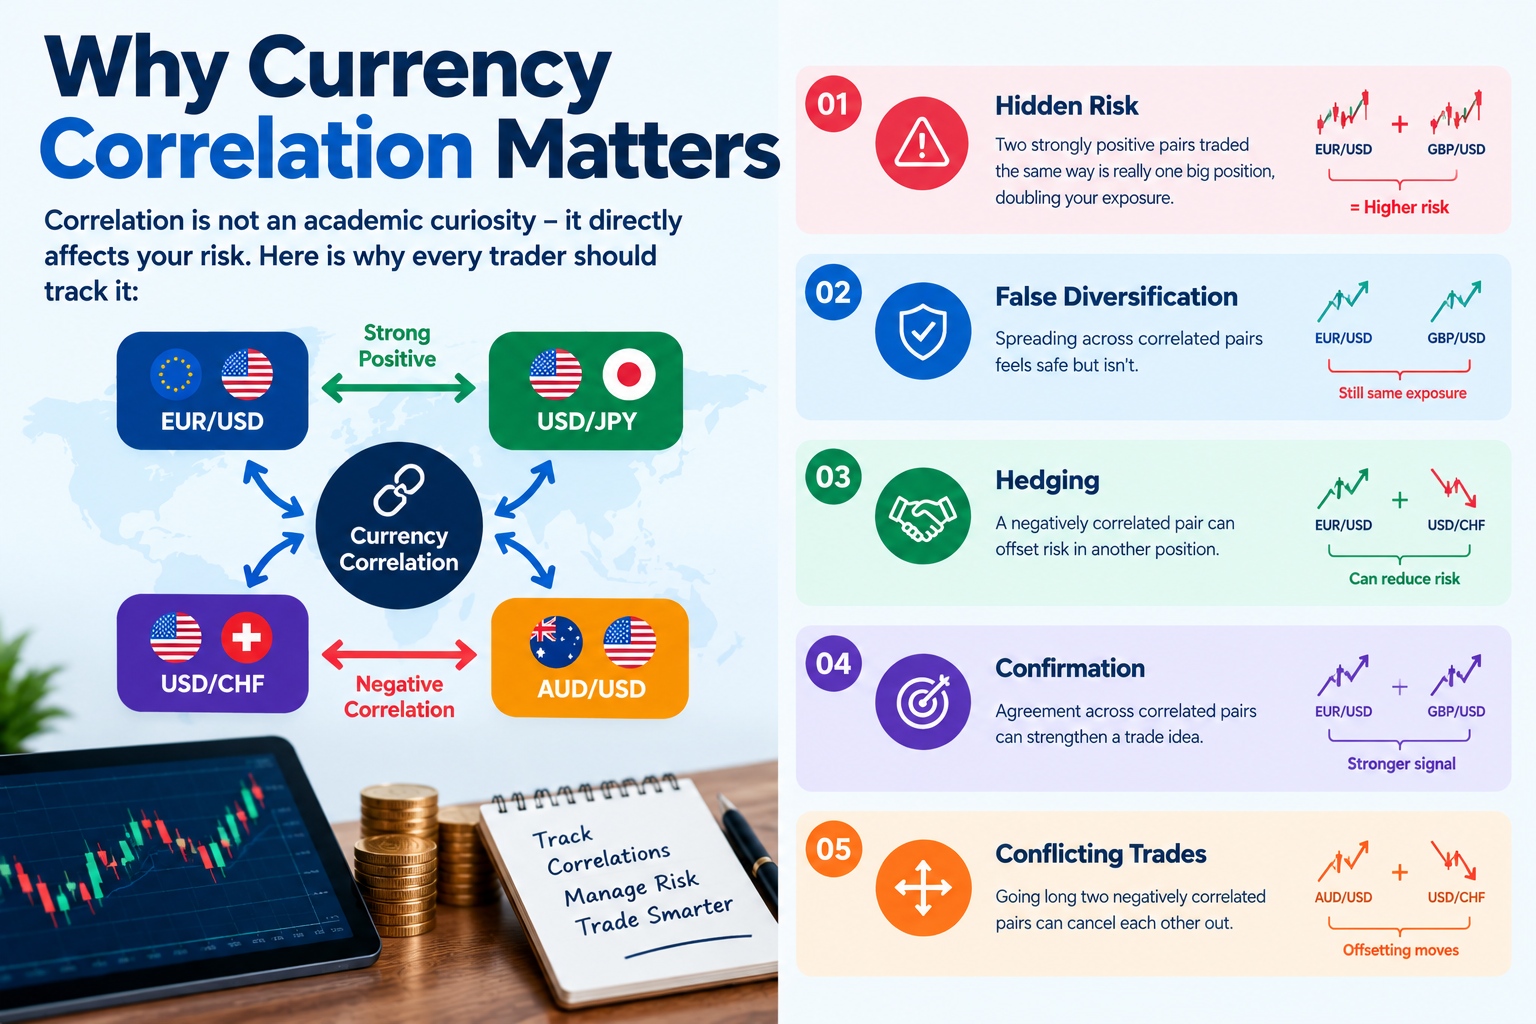
Correlation is not an academic curiosity – it directly affects your risk. Here is why every trader should track it:
- Hidden risk – two strongly positive pairs traded the same way is really one big position, doubling your exposure.
- False diversification – spreading across correlated pairs feels safe but isn’t.
- Hedging – a negatively correlated pair can offset risk in another position.
- Confirmation – agreement across correlated pairs can strengthen a trade idea.
- Conflicting trades – going long two negatively correlated pairs can cancel each other out.
What Drives Currency Correlation?
Correlations are not random – they come from real economic and structural links. Understanding the causes helps you anticipate when currency correlation forex relationships are likely to hold or break.
- Shared currency – pairs with a common currency (both quoted in USD) are naturally linked.
- Connected economies – neighbouring or trade-linked economies (Australia and New Zealand) move together.
- Commodity ties – the Canadian dollar tracks oil, the Australian dollar tracks commodities and gold.
- Risk sentiment – in ‘risk-on’ phases, higher-yield currencies rise while safe havens (USD, JPY, CHF) fall, and vice versa.
Currency Correlation Table (Typical Relationships)
The table below shows commonly observed relationships and the reason behind each. These are typical, illustrative directions – not exact live figures – because correlation values change daily. Always confirm current numbers on a correlation matrix (Myfxbook, OANDA or TradingView).
| Pair combination | Typical correlation | Reason |
|---|---|---|
| EUR/USD & GBP/USD | Strong positive | Both vs USD; linked European economies |
| EUR/USD & USD/CHF | Strong negative | USD on opposite sides; EUR/CHF fairly stable |
| AUD/USD & NZD/USD | Strong positive | Similar commodity-driven economies |
| USD/CAD & crude oil | Negative | Canada is a major oil exporter |
| AUD/USD & gold | Positive | Australia is a major gold exporter; risk-on asset |
| USD/JPY & USD/CHF | Positive | JPY and CHF are both safe havens vs USD |
| EUR/USD & USD/JPY | Variable | Depends on whether USD or risk sentiment leads |
Read this as direction and logic, not fixed numbers. A relationship that is strongly positive today can weaken or flip during major news or shifts in risk sentiment.
How to Read and Use a Correlation Matrix
A correlation matrix is a grid showing the coefficient between every pair of instruments, usually colour-coded and available for different timeframes. To use it well:
- Check the timeframe – correlations differ on hourly, daily and weekly windows; match it to your trading horizon.
- Avoid stacking risk – don’t take the same direction on two strongly positive pairs unless you accept the combined size.
- Use negatives to hedge – a negatively correlated position can reduce overall exposure.
- Watch for confirmation – correlated pairs agreeing can add conviction; disagreeing can be a warning.
- Re-check often – correlations drift, so treat the matrix as a live gauge, not a fixed rule.
Important Caveats
Currency correlation is powerful but must be handled with care. Correlations are not constant – they strengthen, weaken and sometimes reverse, especially around central-bank decisions, geopolitical shocks or sharp shifts in risk appetite. A pair relationship that held for months can break in a day. They also vary by timeframe, so a strong daily correlation may look very different intraday. Treat every correlation figure as a snapshot with an expiry date, and never size a trade as if a correlation is guaranteed.
Common Mistakes
- Trading multiple correlated pairs and thinking you’re diversified.
- Treating a correlation number as permanent rather than a moving snapshot.
- Ignoring the timeframe the correlation was measured on.
- Opening opposing trades on negatively correlated pairs that cancel out.
- Relying on correlation alone instead of combining it with analysis and risk rules.
Myths vs Facts
| Myth | Fact |
|---|---|
| Correlated pairs always move together. | They tend to; correlation is a probability, not a guarantee. |
| Correlation values are fixed. | They change constantly with news, sentiment and timeframe. |
| Trading many pairs means diversification. | Not if the pairs are highly correlated – it can concentrate risk. |
| Negative correlation removes all risk. | It can offset, but the hedge is imperfect and can break down. |
Accuracy note
This article is for educational purposes only and is not investment advice. Correlation values change continuously; the relationships in the table are typical, illustrative directions, not live figures. Always confirm current correlations on a real-time matrix (such as Myfxbook, OANDA or TradingView) before making trading decisions.
Expert Analysis
The most valuable use of currency correlation is defensive. Traders obsess over entries, but the quiet account-killer is unintentionally concentrated risk – three ‘different’ trades that are really one leveraged bet on the US dollar. A trader who checks correlation before opening a second position instantly sees whether they are diversifying or doubling down, and that single habit prevents a whole category of oversized losses. In this sense, a correlation matrix is less a trade-finding tool and more a risk X-ray.
The subtler skill is respecting that correlations are regime-dependent. In calm, dollar-led markets, the textbook relationships hold neatly; but during a risk-off shock, almost everything can correlate to a single factor – the flight to safety – and normally unrelated pairs start moving in lockstep. Traders who understand currency correlation forex dynamics therefore watch not just the numbers but the regime driving them, tightening risk when correlations spike across the board. Used this way, correlation stops being a static table and becomes a live read on how concentrated the whole market has become.
Key Takeaways
- Currency correlation measures how two pairs move together, on a scale from -1 to +1.
- Positive pairs (EUR/USD & GBP/USD) move together; negative pairs (EUR/USD & USD/CHF) move oppositely.
- Its biggest value is spotting hidden, doubled-up risk across correlated positions.
- Correlations come from shared currencies, linked economies, commodities and risk sentiment.
- Values change constantly – use a live correlation matrix and never treat them as fixed.
Frequently Asked Questions (FAQ)
Q: What is currency correlation in forex?
A: It is a measure of how two currency pairs move relative to each other, expressed as a coefficient from -1 (opposite) to +1 (together).
Q: Which currency pairs are positively correlated?
A: EUR/USD and GBP/USD are a classic positive pair, as are AUD/USD and NZD/USD, because they share currencies or similar economies.
Q: Which currency pairs are negatively correlated?
A: EUR/USD and USD/CHF typically move oppositely, because the US dollar sits on opposite sides of the two pairs.
Q: What does a correlation of +1 mean?
A: Perfect positive correlation – the two pairs move in the same direction essentially all the time over the measured period.
Q: What does a correlation of -1 mean?
A: Perfect negative correlation – the two pairs move in exactly opposite directions over the measured period.
Q: Why does currency correlation matter?
A: It reveals hidden risk: trading two strongly correlated pairs the same way can double your exposure without you realising it.
Q: How do I read a correlation table?
A: Find the two pairs; a value near +1 means they move together, near -1 means oppositely, and near 0 means little relationship.
Q: Do currency correlations change?
A: Yes, constantly. They shift with news, central-bank decisions, risk sentiment and the timeframe measured.
Q: What causes currency correlations?
A: Shared currencies, connected economies, commodity links (oil, gold) and shifts in global risk sentiment.
Q: Can I use correlation to hedge?
A: Yes. A negatively correlated position can offset risk in another, though the hedge is imperfect and can break down.
Q: Does timeframe affect correlation?
A: Yes. A strong daily correlation can look very different on an hourly or weekly chart, so match it to your horizon.
Q: Is trading many pairs diversification?
A: Only if the pairs aren’t highly correlated. Trading several correlated pairs can concentrate rather than spread risk.
Q: What is a commodity currency?
A: A currency whose economy depends on commodity exports, like the Canadian dollar (oil) or Australian dollar (metals).
Q: Where can I find a correlation matrix?
A: Free tools like Myfxbook, OANDA and TradingView provide live correlation matrices across timeframes.
Q: Should I trade on correlation alone?
A: No. Use it alongside your analysis and risk rules; correlation manages exposure, it doesn’t generate signals by itself.