Introduction
Markets do not trend all the time. In fact, many currency pairs spend long stretches moving sideways, bouncing between a ceiling and a floor. Trend-following traders often struggle in these conditions, getting stopped out repeatedly as price changes direction.
A range trading strategy turns sideways markets into an opportunity. The idea is simple: buy near support, sell near resistance and take profits as price moves back across the range. Done well, it offers clear entry levels, tight stops and frequent setups. Done badly, it can lead to large losses when a range finally breaks.
This guide explains:
- What range trading is and when it works
- How to identify a valid range
- Tools and indicators that help
- Entry, stop-loss and target rules
- How to handle breakouts and false breakouts
- A worked example and common mistakes
What Is a Range Trading Strategy?
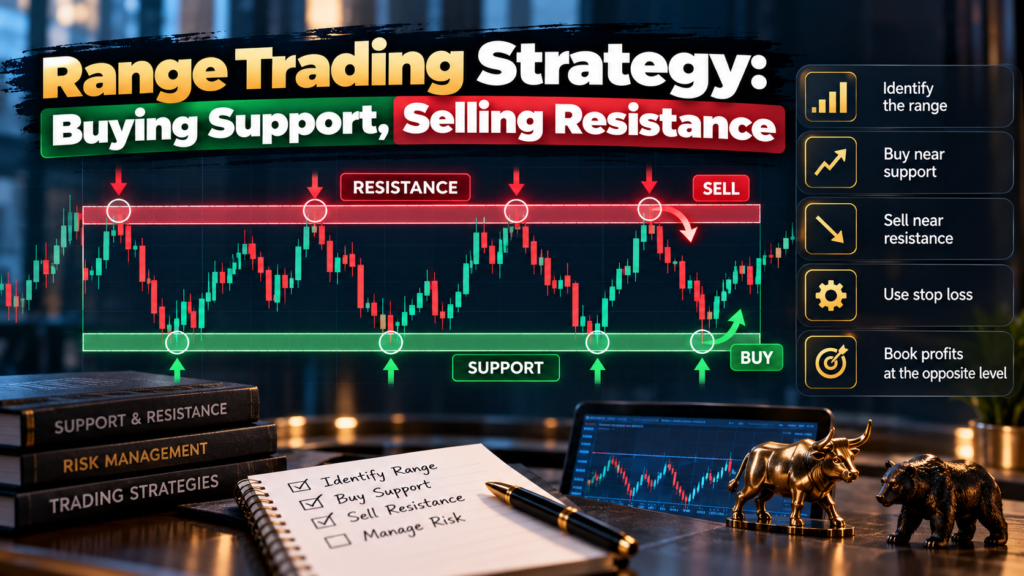
A range trading strategy is an approach that aims to profit from price moving back and forth between two levels:
- Support: A price level where buying interest has repeatedly stopped declines.
- Resistance: A price level where selling interest has repeatedly stopped rallies.
Range traders buy near support, expecting a bounce, and sell near resistance, expecting a pullback. It is a form of mean reversion: the assumption is that price will return towards the middle of the range rather than break out.
When Does Range Trading Work Best?
Ranges are common when:
- There is no strong fundamental driver pushing the market in one direction.
- Central bank policy is stable and expected.
- Markets are waiting for a major event, such as an interest rate decision.
- Liquidity is lower, for example during the Asian session for many currency pairs.
- A central bank actively smooths currency moves, as the RBI often does with USD/INR.
A range trading strategy works best when these conditions are present and becomes risky when a strong catalyst arrives.
How to Identify a Valid Range
1. At least two touches on each side
A range needs clear evidence. Look for at least two tests of support and two tests of resistance. More touches make the levels more reliable.
2. Horizontal boundaries
The highs and lows should be roughly level. If highs are falling and lows are rising, you may be looking at a triangle, which often leads to a breakout.
3. Enough room to trade
The distance between support and resistance should be large enough to offer a reasonable reward after costs. A very narrow range may not justify the risk.
4. Weak trend strength
Indicators such as ADX can confirm the absence of a trend. ADX readings below about 20 often suggest a ranging market.
5. Zones, not exact lines
Support and resistance are best treated as zones rather than single prices. Price may overshoot slightly before reversing.
Tools for a Range Trading Strategy
| Tool | How it helps |
|---|---|
| Horizontal support and resistance | Defines the range boundaries |
| RSI | Signals overbought near resistance and oversold near support |
| Stochastic oscillator | Gives timing signals with crossovers in overbought or oversold zones |
| ADX | Confirms weak trend strength and warns when a breakout may be starting |
| Bollinger Bands | Narrow, flat bands often accompany ranges; touches of the bands can signal extremes |
| Candlestick patterns | Pin bars and engulfing patterns can confirm rejection at the boundaries |
Keep your chart simple. Two or three tools that work together are better than many that conflict.
Range Trading Strategy Entry Rules
Buying at support
- Price approaches the support zone.
- Look for signs of rejection, such as a bullish pin bar or engulfing candle.
- Optionally confirm with RSI or stochastic turning up from oversold levels.
- Enter long once the confirmation candle closes.
Selling at resistance
- Price approaches the resistance zone.
- Look for bearish rejection candles.
- Optionally confirm with RSI or stochastic turning down from overbought levels.
- Enter short once the confirmation candle closes.
Waiting for a rejection candle helps avoid buying into a support level that is about to break.
Stop-Loss Placement in a Range Trading Strategy
- For longs: Place the stop below the support zone, giving room for small overshoots.
- For shorts: Place the stop above the resistance zone.
- ATR buffer: Some traders add a fraction of the Average True Range beyond the zone to avoid being stopped out by noise.
A key advantage of a range trading strategy is that stops can be relatively tight, because the boundary gives a clear point where the trade idea is proven wrong.
Setting Profit Targets
- Midpoint of the range: A conservative target with a high probability of being reached.
- Opposite boundary: A larger target, aiming for the full swing across the range.
- Partial profits: Take some profit at the midpoint and let the rest run towards the far side.
Avoid holding range trades beyond the opposite boundary, because that is where other range traders will be taking the opposite position.
Worked Example of a Range Trading Strategy
Imagine EUR/USD has been moving sideways on the 1-hour chart between 1.1600 (support) and 1.1680 (resistance) for several days. ADX reads 16, confirming a weak trend.
- Price falls to 1.1605, inside the support zone.
- A bullish engulfing candle forms, and RSI turns up from around 30.
- The trader buys at 1.1612, with a stop at 1.1590, below support (22 pips of risk).
- The first target is the midpoint at 1.1640 (28 pips), and the second target is just below resistance at 1.1675 (63 pips).
- Half the position is closed at 1.1640, and the stop is moved to break-even.
- Price reaches 1.1675, and the rest of the position is closed.
The trade gains an average of about 45 pips on 22 pips of initial risk, a reward of roughly 2 times the risk.
This example is illustrative and uses hypothetical prices.
Handling Breakouts
Every range eventually ends. A range trading strategy must include a plan for breakouts.
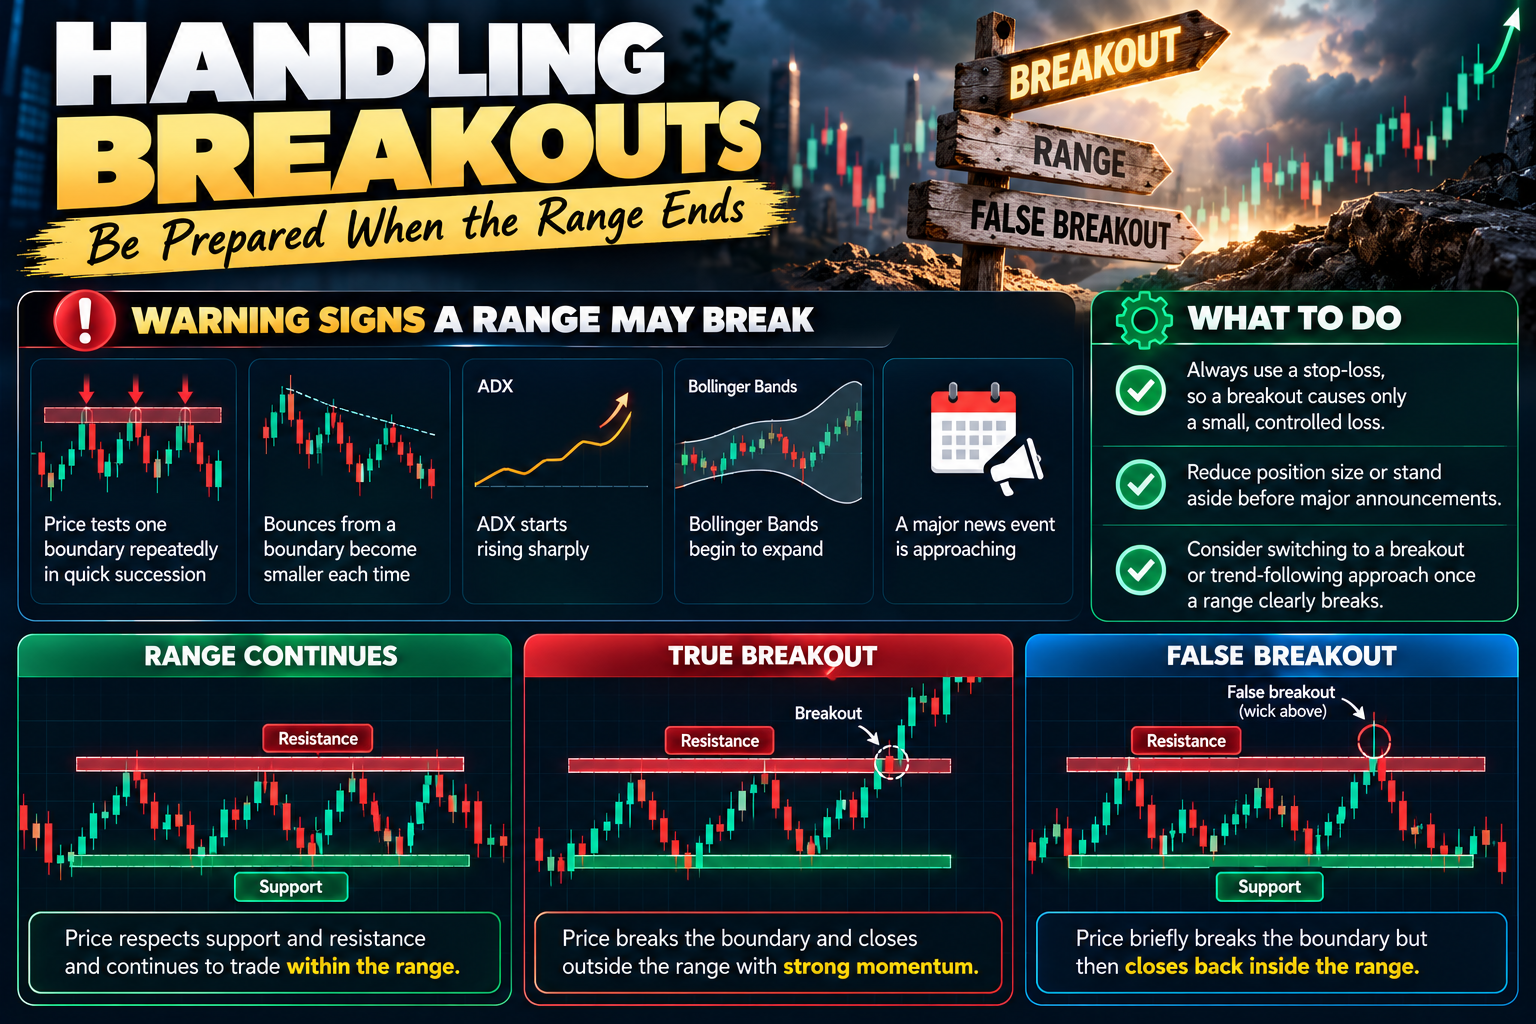
Warning signs a range may break
- Price tests one boundary repeatedly in quick succession
- Bounces from a boundary become smaller each time
- ADX starts rising sharply
- Bollinger Bands begin to expand
- A major news event is approaching
What to do
- Always use a stop-loss, so a breakout causes only a small, controlled loss.
- Reduce position size or stand aside before major announcements.
- Consider switching to a breakout or trend-following approach once a range clearly breaks.
False breakouts
Sometimes price briefly breaks a boundary and then snaps back inside the range. These false breakouts can offer strong range trades, because traders who bought the breakout are trapped. Some range traders specifically look for a wick beyond the boundary followed by a close back inside the range as an entry signal.
Range Trading Strategy vs Breakout Trading
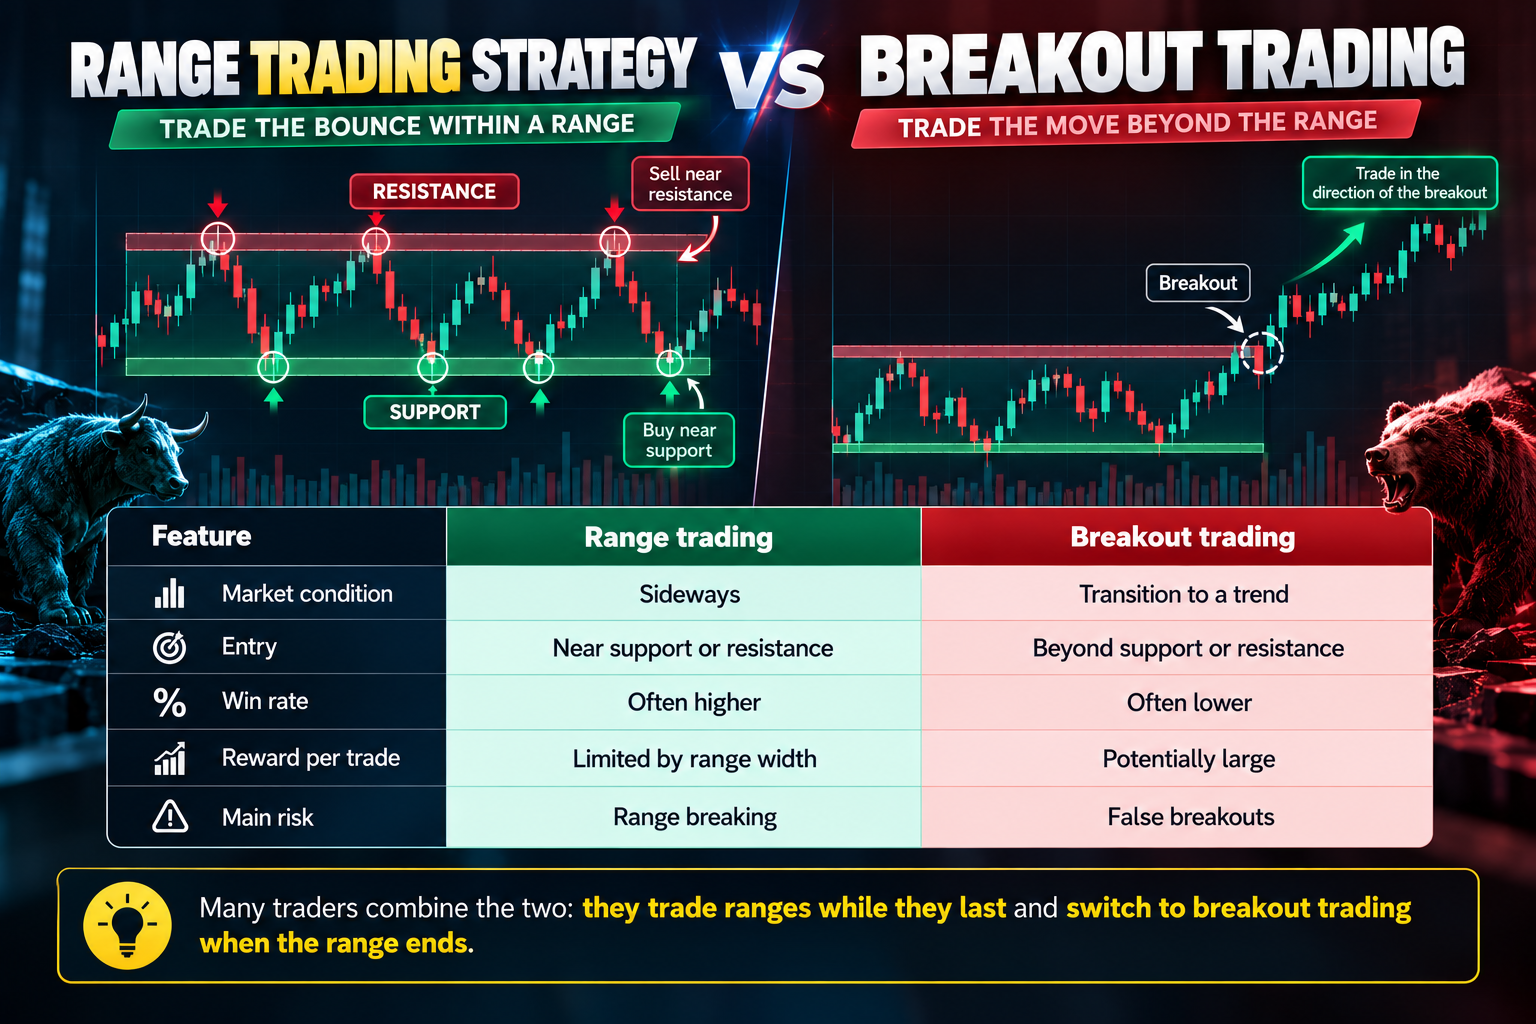
| Feature | Range trading | Breakout trading |
|---|---|---|
| Market condition | Sideways | Transition to a trend |
| Entry | Near support or resistance | Beyond support or resistance |
| Win rate | Often higher | Often lower |
| Reward per trade | Limited by range width | Potentially large |
| Main risk | Range breaking | False breakouts |
Many traders combine the two: they trade ranges while they last and switch to breakout trading when the range ends.
Best Timeframes and Markets for a Range Trading Strategy
- Intraday: 15-minute and 1-hour charts often show clear ranges, especially during quieter sessions.
- Swing trading: 4-hour and daily charts can reveal ranges lasting weeks or months.
- Markets: Range trading works in forex, indices and commodities, especially during periods without strong news.
Using Bollinger Bands in a Range Trading Strategy
Bollinger Bands plot a moving average with an upper and lower band set two standard deviations away. In a sideways market, the bands tend to flatten and run roughly parallel to the support and resistance zones, which makes them a useful companion to horizontal levels.
- Confluence: A touch of the lower band at support, or the upper band at resistance, adds weight to a range trade.
- Middle band as target: The 20-period moving average in the middle often sits near the midpoint of the range and works as a first profit target.
- Squeeze warning: When the bands contract sharply after a quiet spell, volatility is compressed and a breakout may follow.
- Expansion warning: If price closes outside a band and the bands widen quickly, the range may be ending.
Used this way, Bollinger Bands give a range trading strategy both confirmation at the boundaries and an early signal of when to step aside.
Range Trading Strategy for Part-Time Traders
Many Indian traders have full-time jobs and cannot watch screens all day. Range trading can suit this lifestyle, because the levels are known in advance. Mark support and resistance in the evening, set alerts near each zone and review the chart only when an alert fires. Limit orders placed just inside the zones, with stops already attached, let you participate without constant monitoring. Higher timeframes such as the 4-hour chart produce fewer, cleaner signals that fit around office hours, and a written plan keeps you from improvising when a trade is open.
Range Trading Strategy in Indian Markets
USD/INR is a classic example of a pair that often trades in ranges, partly because the RBI intervenes to smooth sharp moves. This can make a range trading strategy useful for NSE currency futures traders. However, ranges in USD/INR can be narrow, so check that the potential reward is worth the costs and margin.
Remember that each 1-paise move in USD/INR futures is worth ₹10 per lot. In a range of, say, 30 paise, the full swing is worth ₹300 per lot before costs.
Indian residents should trade currencies only through recognised exchanges such as NSE and BSE, via SEBI-registered brokers. Leveraged forex trading through offshore CFD platforms is not permitted under FEMA.
Common Range Trading Strategy Mistakes
- Forcing ranges: Drawing ranges on trending markets leads to repeated losses.
- Entering without confirmation: Buying blindly at support can mean catching a falling knife.
- No stop-loss: When a range breaks, losses can grow quickly without a stop.
- Targets too ambitious: Expecting price to break beyond the range defeats the strategy’s logic.
- Trading narrow ranges: Costs can eat most of the profit.
- Ignoring news: Major announcements often end ranges abruptly.
- Averaging down: Adding to losing positions near a breaking boundary increases risk sharply.
Range Trading Strategy Checklist
- Are there at least two touches on both support and resistance?
- Is ADX low, suggesting a weak trend?
- Is the range wide enough to justify the trade after costs?
- Is price at a boundary zone, not in the middle?
- Is there a rejection candle or oscillator confirmation?
- Is the stop placed beyond the zone?
- Is the risk-reward at least 1:1.5 to the midpoint or 1:2 to the far side?
- Is major news due soon?
FAQs
What is a range trading strategy?
It is an approach that buys near support and sells near resistance when a market is moving sideways, aiming to profit from price returning towards the middle of the range.
How do I know if a market is ranging?
Look for at least two touches on support and resistance, roughly horizontal boundaries and a low ADX reading, often below 20.
Which indicators work best for range trading?
RSI, stochastic, Bollinger Bands and ADX are popular, combined with horizontal support and resistance.
Where should I place my stop-loss?
Just beyond the support or resistance zone, often with a small ATR buffer.
What happens when the range breaks?
Your stop-loss should limit the loss. Many traders then switch to a breakout or trend-following approach.
Conclusion
A range trading strategy can be a reliable way to profit from sideways markets, offering clear levels, defined risk and frequent opportunities. The keys are identifying genuine ranges, waiting for confirmation at the boundaries, placing stops beyond the zones and taking realistic profits.
Above all, respect the fact that every range eventually ends. Watch for breakout warning signs, avoid trading through major news and keep your risk small. Practise on historical charts and a demo account to build confidence before trading live.
Disclaimer: This article is for education only and is not investment or trading advice. Trading involves a high risk of loss. Indian residents should trade only through recognised exchanges and SEBI-registered brokers, and consult a registered adviser before trading.