Introduction
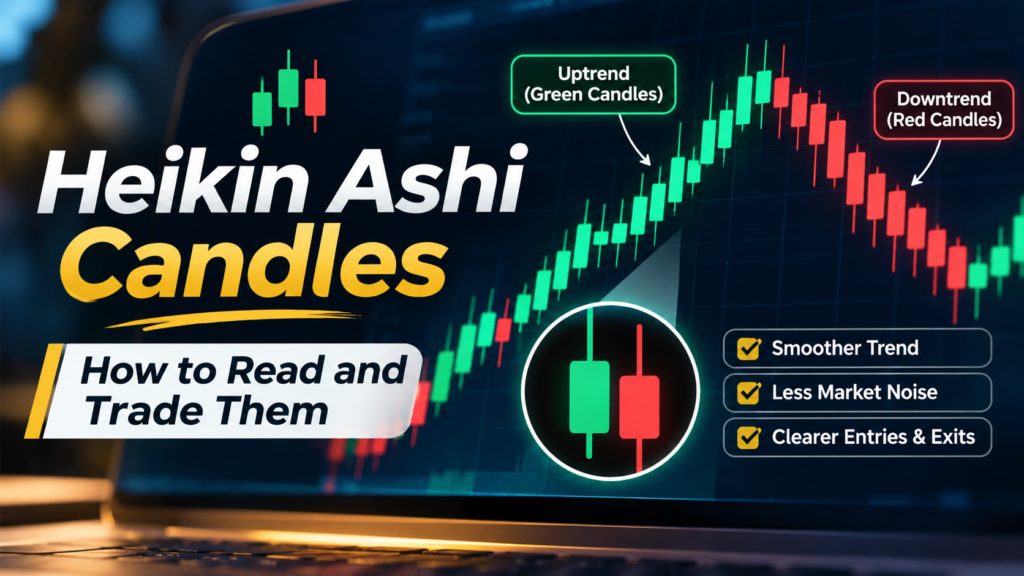
Standard candlestick charts show every twist in price, which is useful but can also be noisy. In a strong trend, a few red candles in a green move can shake traders out of good positions. Heikin Ashi candles were designed to solve that problem.
Heikin Ashi, which roughly means “average bar” in Japanese, smooths price data so trends are easier to see and stay with. Long runs of same-coloured candles show clear trends, while small-bodied candles with wicks on both sides warn of possible reversals.
This guide explains:
- What these candles are and how they are calculated
- How they differ from regular candlesticks
- How to read trend strength, weakness and reversals
- Practical trading strategies and a worked example
- Limitations and common mistakes
What Are Heikin Ashi Candles?
Heikin Ashi candles are a modified form of Japanese candlesticks. Instead of plotting the actual open, high, low and close of each period, they use averaged values. Each candle is partly based on the previous candle, which creates a smoother chart.
The result looks like a regular candlestick chart, but with fewer colour changes and cleaner trends. Traders use these charts mainly to:
- Identify the direction of the trend
- Judge the strength of a trend
- Stay in winning trades longer
- Spot early signs of trend exhaustion
The Heikin Ashi Formula
Each candle is built from four calculated values:
| Value | Formula |
|---|---|
| HA Close | (Open + High + Low + Close) ÷ 4 of the current period |
| HA Open | (Previous HA Open + Previous HA Close) ÷ 2 |
| HA High | The highest of the current High, HA Open and HA Close |
| HA Low | The lowest of the current Low, HA Open and HA Close |
The close is an average of the whole period, and the open is the midpoint of the previous candle’s body. That averaging is what smooths the chart.
Calculation example
Suppose the previous Heikin Ashi candle on EUR/USD had an HA Open of 1.1600 and an HA Close of 1.1620. The current regular candle has:
- Open: 1.1625
- High: 1.1660
- Low: 1.1615
- Close: 1.1650
The new candle is:
- HA Close = (1.1625 + 1.1660 + 1.1615 + 1.1650) ÷ 4 = 1.16375
- HA Open = (1.1600 + 1.1620) ÷ 2 = 1.1610
- HA High = highest of 1.1660, 1.1610 and 1.16375 = 1.1660
- HA Low = lowest of 1.1615, 1.1610 and 1.16375 = 1.1610
The HA Close is above the HA Open, so the candle is bullish. The HA Low equals the HA Open, so there is no lower wick, which is a sign of a strong uptrend.
You do not need to calculate this manually. Most charting platforms, including TradingView and MetaTrader, offer this chart type with one click.
Heikin Ashi vs Regular Candlesticks
| Feature | Regular candlesticks | Heikin Ashi |
|---|---|---|
| Prices shown | Actual open, high, low, close | Averaged values |
| Noise | Shows every fluctuation | Smoothed |
| Gaps | Visible | Mostly hidden |
| Trend clarity | Can be choppy | Clear runs of colour |
| Signal speed | Immediate | Slightly delayed |
| Best use | Precise entries and patterns | Trend direction and holding trades |
The key trade-off is clarity versus precision. These smoothed candles make trends easier to read but do not show real prices, so the last HA close is usually different from the actual market price.
How to Read Heikin Ashi Candles
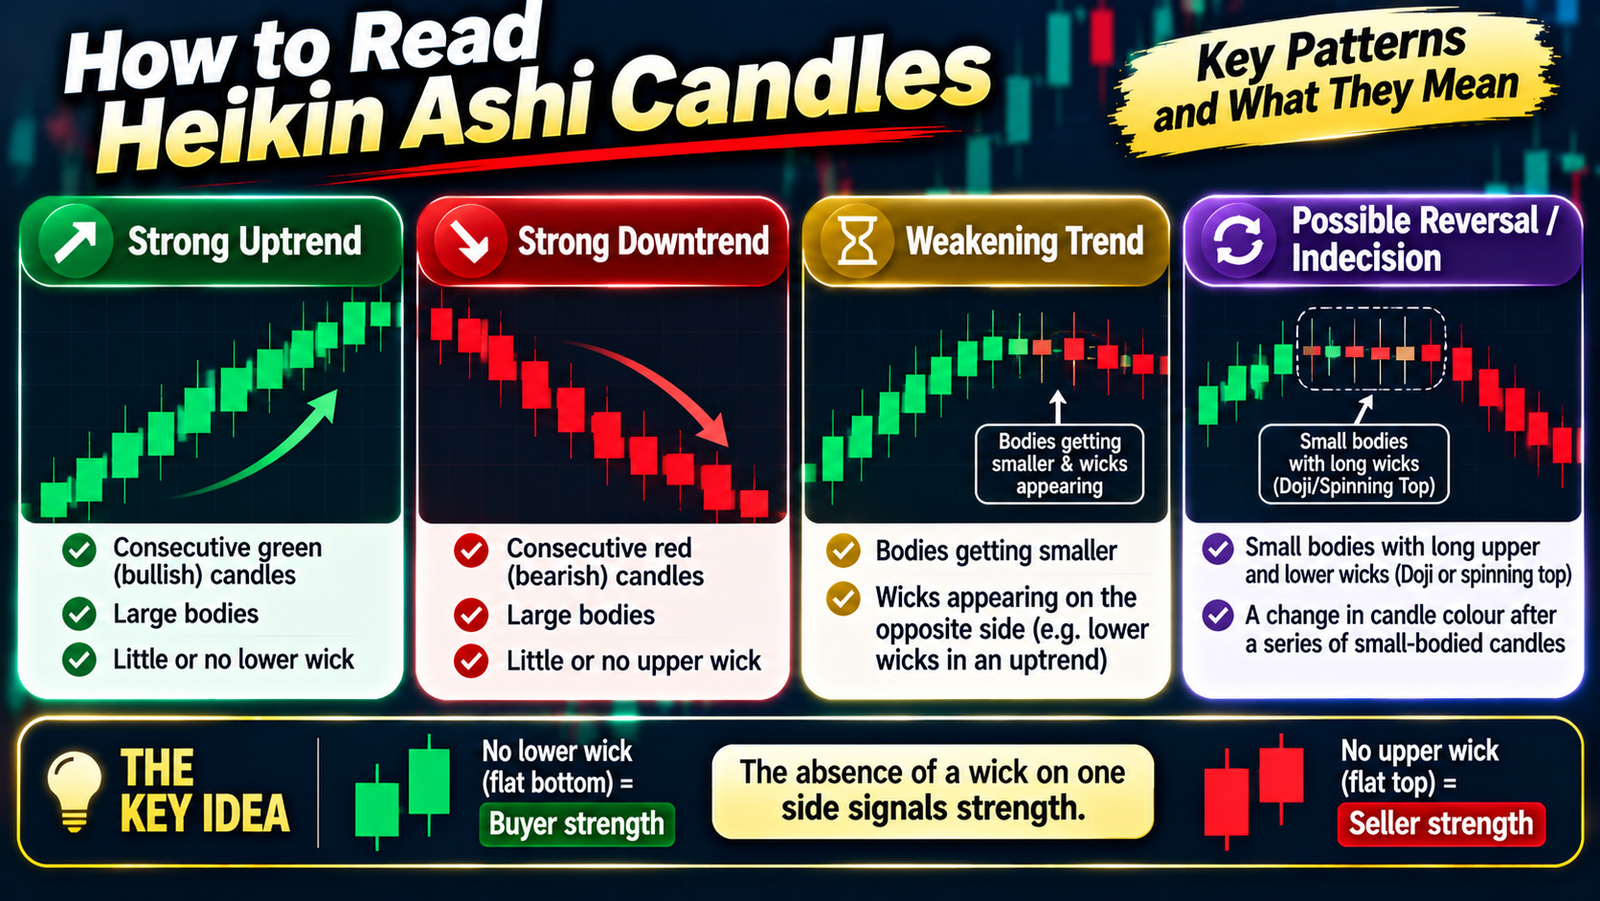
Strong uptrend
- Consecutive green (bullish) candles
- Large bodies
- Little or no lower wick
Strong downtrend
- Consecutive red (bearish) candles
- Large bodies
- Little or no upper wick
Weakening trend
- Bodies getting smaller
- Wicks appearing on the opposite side, for example lower wicks in an uptrend
Possible reversal or indecision
- Small bodies with long upper and lower wicks, similar to a doji or spinning top
- A change in candle colour after a series of small-bodied candles
The single most useful idea is this: the absence of a wick on one side signals strength. Flat-bottomed green candles mean buyers are firmly in control; flat-topped red candles mean sellers are.
Heikin Ashi Trading Strategies
1. Basic trend-following strategy
- Identify the trend on a higher timeframe.
- Wait for a pullback, shown by a few opposite-coloured or small-bodied candles.
- Enter when the candles change back to the trend colour, ideally with no wick on the opposite side.
- Place the stop beyond the recent swing high or low.
- Exit when a strong opposite-coloured candle appears or when candles show clear exhaustion.
2. Heikin Ashi with a moving average
Adding a moving average filters trades. For example:
- Only take long trades when price is above the 50-period EMA.
- Only take short trades when price is below it.
- Use the candle colour change as the entry trigger.
This combination keeps you aligned with the bigger trend and avoids many false signals in sideways markets.
3. Reversal strategy with doji-style candles
After an extended trend, look for one or more small-bodied candles with long wicks on both sides. This shows indecision. If the next candle closes strongly in the opposite colour, near a key support or resistance level, it can signal a reversal. Confirmation from RSI divergence or a break of a trendline improves reliability.
4. Heikin Ashi as a trailing exit tool
Some traders enter using regular candlesticks or price action and then switch to the smoothed chart to manage the trade. They stay in as long as candles keep their colour and exit after the first strong opposite candle. This helps capture more of a trend without being shaken out by small pullbacks.
Worked Example of a Heikin Ashi Trade
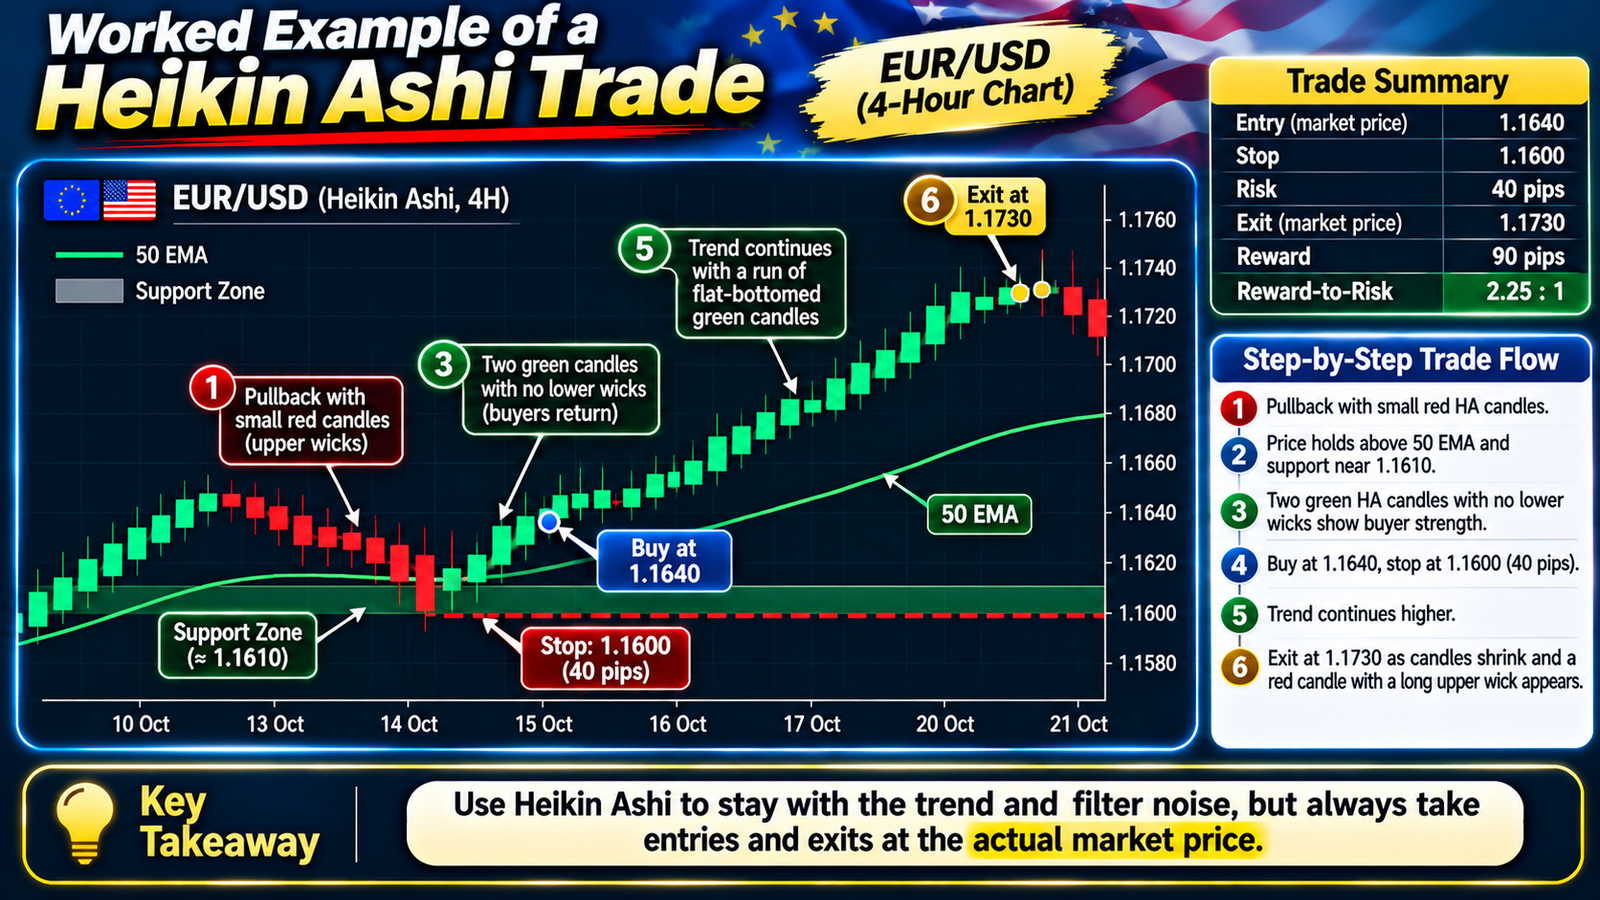
Imagine EUR/USD is in an uptrend on the daily chart. On the 4-hour Heikin Ashi chart:
- Price pulls back for several candles, showing small red bodies with upper wicks.
- Price holds above the 50 EMA and a support zone near 1.1610.
- Two green candles then form with no lower wicks, signalling buyers have returned.
- The trader buys at the actual market price of 1.1640, with a stop below the swing low at 1.1600 (40 pips of risk).
- The trend continues with a run of flat-bottomed green candles.
- After several days, candles shrink and a red candle with a long upper wick appears. The trader exits at the actual market price of 1.1730.
The trade gains 90 pips on 40 pips of risk, about 2.25 times the risk. Note that the entry and exit use real market prices, not HA values.
This example is illustrative and uses hypothetical prices.
Adding Confirmation Tools
Smoothed candles show trend direction well, but they say little about momentum or where price is likely to stop. A few simple tools fill those gaps:
- RSI: In an uptrend, RSI holding above 40 to 50 during pullbacks suggests the trend is healthy. Bearish divergence, where price makes a higher high but RSI makes a lower high, warns that momentum is fading even if candles are still green.
- ADX: A reading above 20 to 25 confirms that a trend is strong enough to follow. Below 20, colour changes are more likely to be noise.
- Support and resistance: Mark key horizontal levels on the regular chart. Entries near support in an uptrend, or near resistance in a downtrend, offer better risk-reward.
- Volume: On exchange-traded futures, rising volume during a run of same-coloured candles supports the move, while falling volume suggests the trend may be tiring.
- Higher-timeframe structure: A series of higher highs and higher lows on the daily chart gives context for long trades on the 4-hour chart.
Keep confirmation simple. One trend filter and one momentum tool are usually enough. Adding too many indicators leads to conflicting signals and missed trades, which defeats the purpose of using a cleaner chart in the first place.
Best Timeframes and Markets
- Higher timeframes (4-hour, daily, weekly): Give the cleanest trends and fewest false signals.
- Intraday (15-minute, 1-hour): Usable, but more noise and more colour changes.
- Very short timeframes (1 to 5 minutes): Generally less reliable because averaging delays signals.
- Markets: Works on forex, indices, commodities and stocks. It is most useful in trending markets and least useful in tight ranges.
Limitations of Heikin Ashi
- Not real prices: The HA close is an average, so you cannot use it for exact entries, stops or targets.
- Lag: Because of averaging, signals come later than on regular candlesticks. You may miss part of a move.
- Hidden gaps: Gaps are smoothed out, which can hide important information.
- Poor in ranges: In sideways markets, colours flip often and produce false signals.
- Pattern confusion: Classic candlestick patterns do not translate directly to this chart type.
Common Mistakes
- Placing orders at HA prices: Always check the real chart for entries and stops.
- Trading every colour change: In choppy markets, this leads to many small losses.
- Ignoring the bigger trend: Use a higher timeframe or moving average to filter direction.
- Using it on very small timeframes: The lag makes signals unreliable.
- Forgetting risk management: Smooth charts can create overconfidence. Always use stops and fixed risk per trade.
- Backtesting on HA prices: Backtests using averaged prices can look far better than reality.
Using Heikin Ashi in Indian Markets
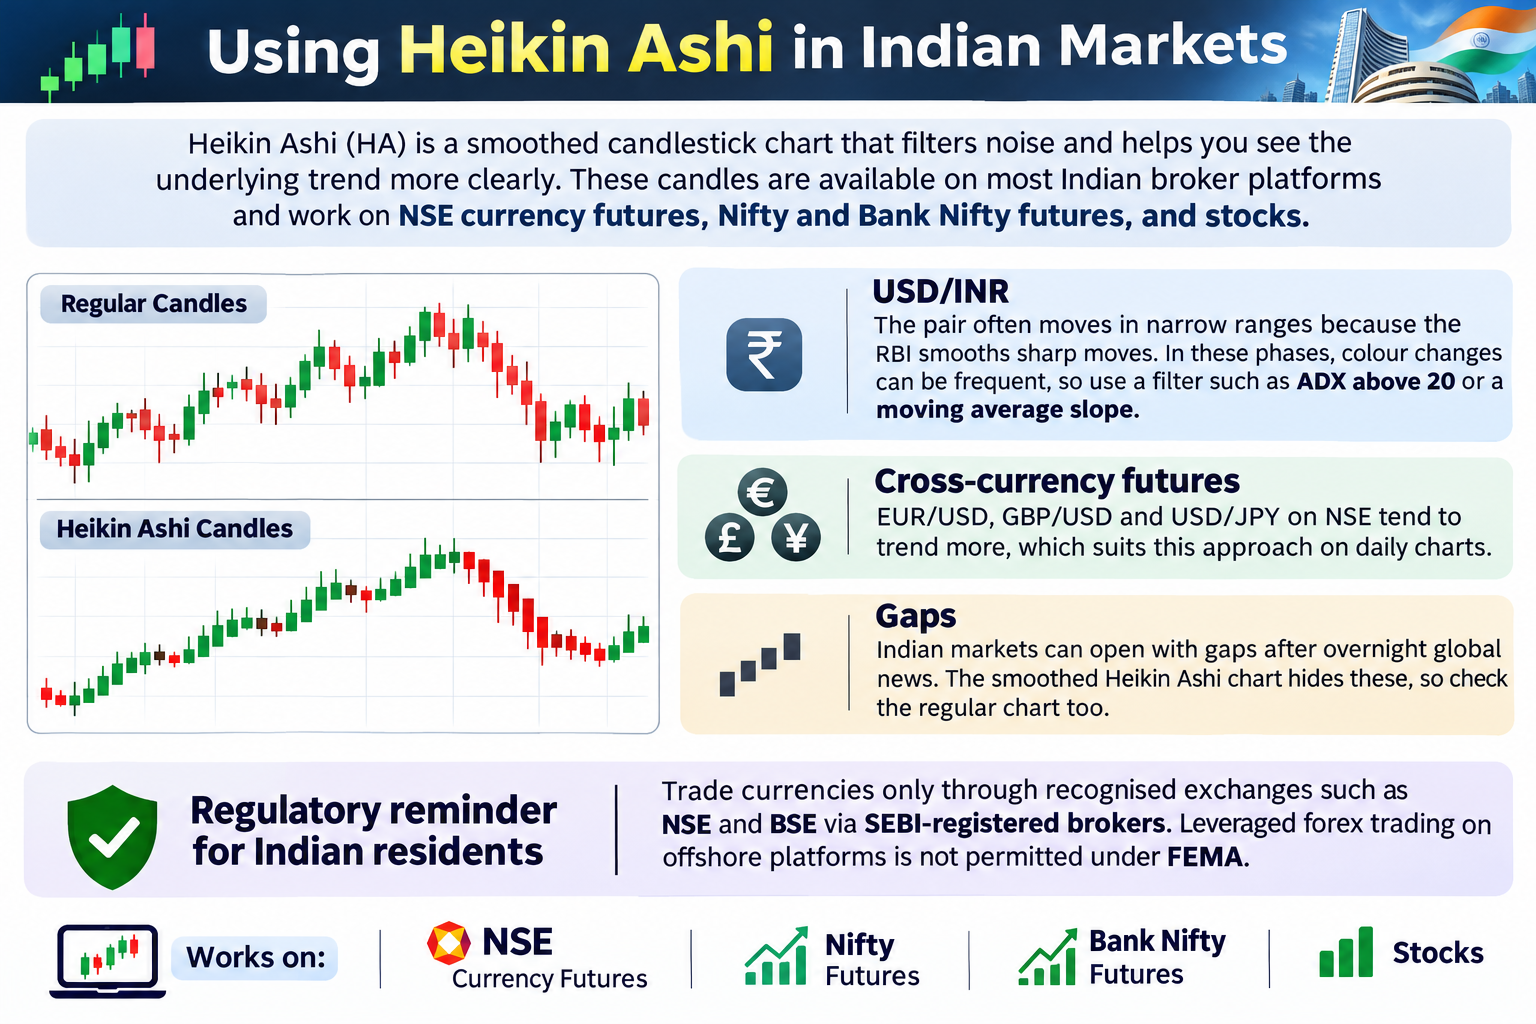
These candles are available on most Indian broker platforms and work on NSE currency futures, Nifty and Bank Nifty futures, and stocks.
- USD/INR: The pair often moves in narrow ranges because the RBI smooths sharp moves. In these phases, colour changes can be frequent, so use a filter such as ADX above 20 or a moving average slope.
- Cross-currency futures: EUR/USD, GBP/USD and USD/JPY on NSE tend to trend more, which suits this approach on daily charts.
- Gaps: Indian markets can open with gaps after overnight global news. The smoothed chart hides these, so check the regular chart too.
Indian residents should trade currencies only through recognised exchanges such as NSE and BSE via SEBI-registered brokers. Leveraged forex trading on offshore platforms is not permitted under FEMA.
Checklist Before Taking a Trade
- Is the higher-timeframe trend clear?
- Is price on the right side of my moving average?
- Has a pullback ended with a colour change?
- Does the new candle lack a wick on the opposite side?
- Is there a nearby support or resistance level supporting the trade?
- Have I placed my entry and stop using real prices?
- Is the risk-reward at least 1:2?
FAQs
What does Heikin Ashi mean?
It is a Japanese term that roughly translates as “average bar”, reflecting the averaging used to build each candle.
Is Heikin Ashi better than regular candlesticks?
Neither is better in all cases. These candles make trends clearer, while regular candlesticks show exact prices and react faster.
What is the best timeframe for Heikin Ashi?
The 4-hour and daily charts usually give the most reliable signals. Very short timeframes suffer more from lag and noise.
Can I trade using only these candles?
Some traders do, but combining it with a moving average, support and resistance or an oscillator improves results.
Why does the HA close differ from the actual price?
Because it is an average of the period’s open, high, low and close rather than the last traded price.
Conclusion
Heikin Ashi candles are a simple but powerful way to cut through market noise. By averaging price, they make trends clearer, help you stay in winning trades and highlight when momentum is fading.
Use them for what they do best: identifying trend direction and managing trades. Combine them with a moving average or key levels, always place orders using real prices and avoid relying on them in choppy markets. Practice on historical charts and a demo account before trading live.