Introduction
Few moments in trading are as exciting as a breakout. Price has been stuck in a range for hours or days, and then it bursts through a key level with strong momentum. Traders who catch these moves early can ride large trends with relatively small risk.
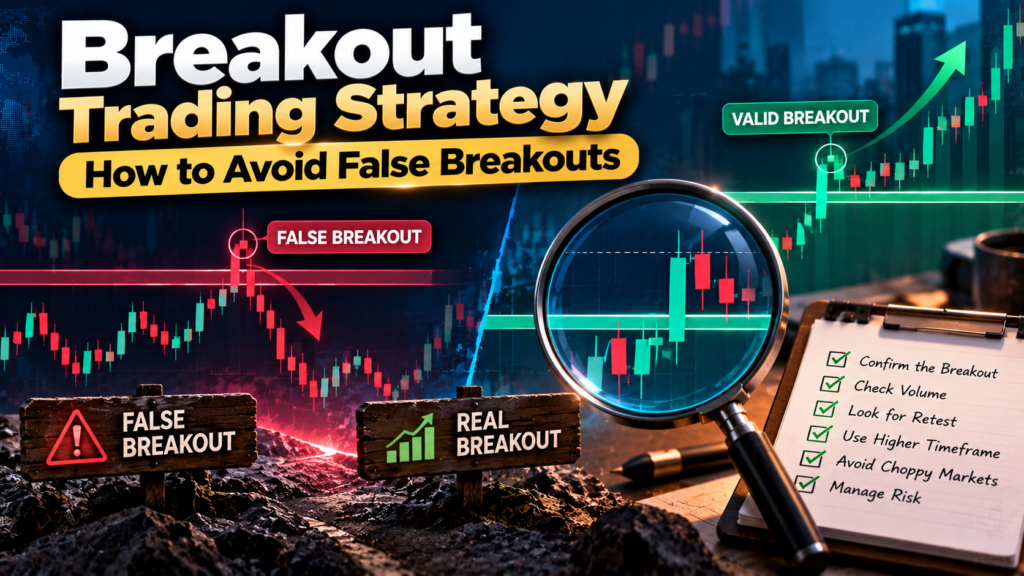
But breakouts have a frustrating side. Many of them fail. Price pushes through a level, triggers a wave of buy or sell orders, and then reverses sharply, trapping traders on the wrong side. These false breakouts, often called fakeouts, are one of the most common reasons traders lose money with breakouts.
This guide explains how a breakout trade strategy works, why false breakouts happen and, most importantly, how to filter them out. You will learn:
- What a breakout is and why it matters
- The best setups for breakout trading
- Why false breakouts happen
- Seven filters to avoid fakeouts
- Entry, stop-loss and target rules
- A worked example and common mistakes
What Is a Breakout?
A breakout happens when price moves decisively beyond a clear level of support or resistance, or out of a defined pattern such as a range or triangle. The idea is simple: when price escapes a zone where buyers and sellers have been balanced, a new trend may begin.
- Bullish breakout: Price breaks above resistance, suggesting buyers have taken control.
- Bearish breakout: Price breaks below support, suggesting sellers have taken control.
A breakout trade strategy aims to enter early in that new move, with a stop placed on the other side of the broken level.
Why a Breakout Trading Strategy Works
Breakouts work because of how orders build up around key levels. Above resistance, there are often stop-loss orders from short sellers and buy-stop orders from breakout traders. Below support, there are sell stops. When price reaches these levels, those orders are triggered, adding fuel to the move.
When that fresh buying or selling is backed by genuine demand or supply, the breakout can turn into a strong trend. When it is not, the move quickly runs out of steam. That difference is what separates a successful breakout trade strategy from one that keeps getting trapped.
Best Setups for a Breakout Trading Strategy
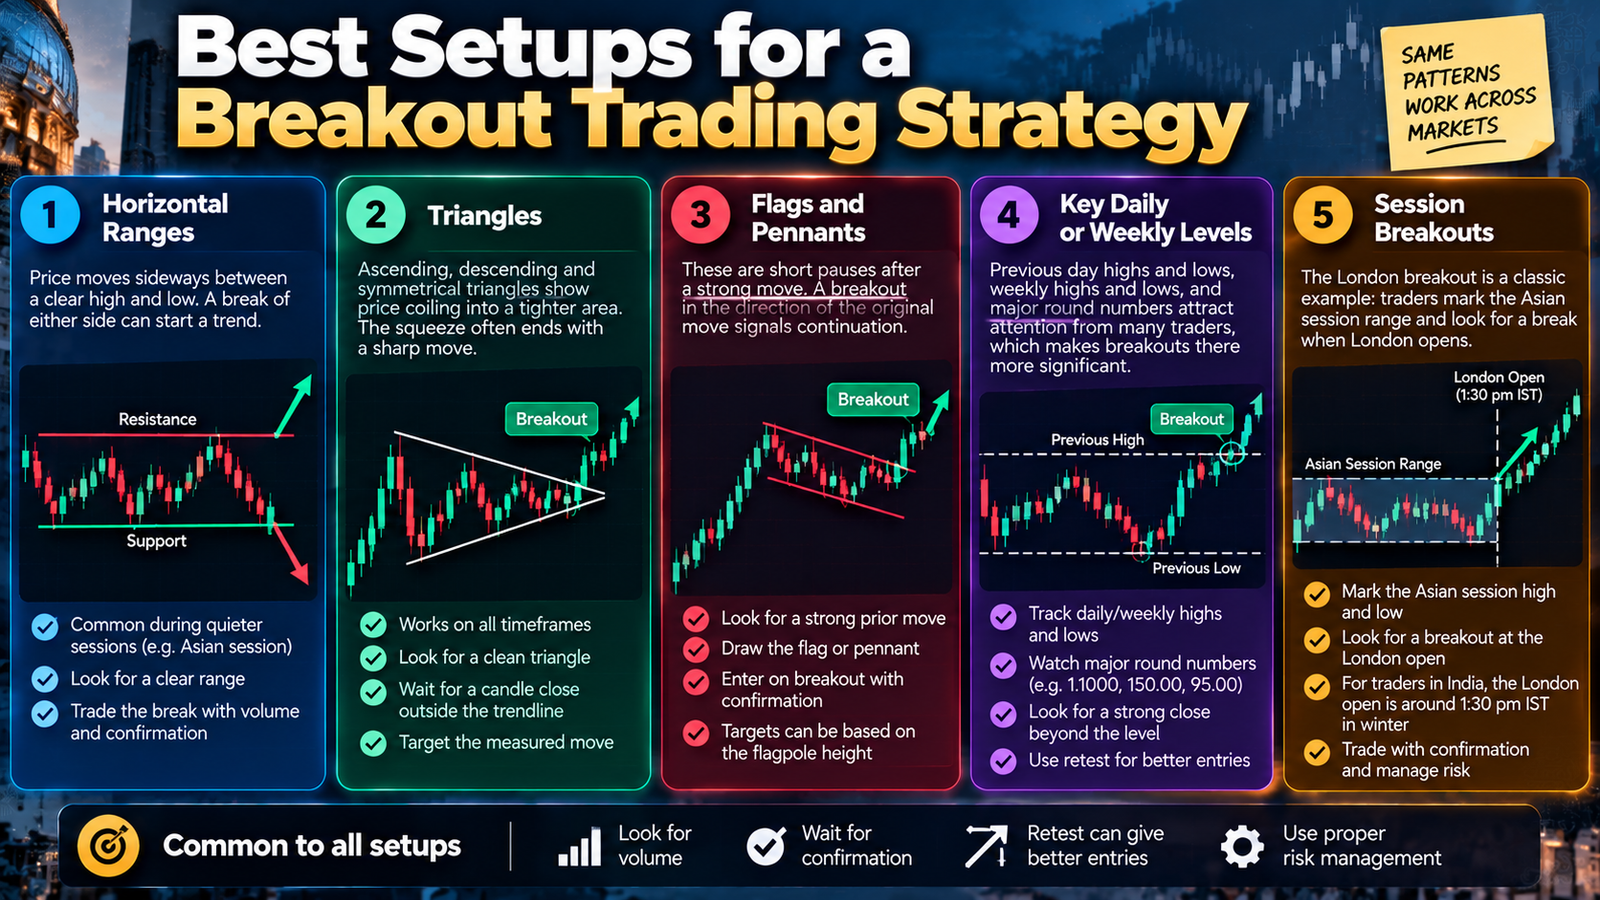
1. Horizontal ranges
Price moves sideways between a clear high and low. A break of either side can start a trend. Ranges are common during quieter sessions, such as the Asian session in forex.
2. Triangles
Ascending, descending and symmetrical triangles show price coiling into a tighter area. The squeeze often ends with a sharp move.
3. Flags and pennants
These are short pauses after a strong move. A breakout in the direction of the original move signals continuation.
4. Key daily or weekly levels
Previous day highs and lows, weekly highs and lows, and major round numbers attract attention from many traders, which makes breakouts there more significant.
5. Session breakouts
The London breakout is a classic example: traders mark the Asian session range and look for a break when London opens. For traders in India, the London open is around 1:30 pm IST in winter.
Why False Breakouts Happen
Understanding the cause of fakeouts is the first step to building a breakout trade strategy that avoids them. Common reasons include:
- Liquidity hunts: Larger traders may push price beyond a level to trigger stop orders, then reverse once they have filled their positions.
- Low volume: A breakout without participation lacks the fuel to continue.
- Against the higher-timeframe trend: Breakouts that fight the bigger trend often fail.
- News spikes: A sudden headline can push price through a level briefly before the market calms down.
- Weak levels: Breaking a minor or poorly defined level means little.
- Overextended moves: If price has already travelled far before reaching the level, there may be little energy left.
Seven Filters to Avoid False Breakouts
No breakout trading strategy can eliminate fakeouts completely, but these filters can greatly improve your odds.
1. Wait for a candle close
Do not enter just because price pokes through a level. Wait for a candle to close beyond it on your chosen timeframe. A wick through resistance that closes back inside the range is a warning sign, not a breakout.
2. Look for strong momentum
Genuine breakouts often come with a large, decisive candle and little wick against the direction of the move. Small, hesitant candles at the level suggest indecision.
3. Confirm with volume
In stock and futures markets, rising volume on the breakout is a strong confirmation. In spot forex, where real volume is not centrally reported, tick volume or exchange-traded futures volume can serve as a rough guide.
4. Trade with the higher-timeframe trend
Check the daily or 4-hour chart before taking a breakout on a lower timeframe. A bullish breakout in a higher-timeframe uptrend has better odds than one against it.
5. Use the retest
Instead of buying the breakout candle, wait for price to come back and retest the broken level. When old resistance holds as new support (or old support holds as new resistance), the breakout is more likely to be real. You may miss some fast moves, but you will avoid many traps.
6. Look for a proper build-up
Strong breakouts often follow a period of tight consolidation near the level, sometimes with higher lows into resistance or lower highs into support. This shows pressure building before the break.
7. Avoid major news releases
Breakouts during high-impact news, such as central bank decisions or US jobs data, can reverse quickly. Many traders wait until the initial spike settles.
| Sign | Genuine breakout | Likely false breakout |
|---|---|---|
| Candle close | Closes well beyond the level | Wick through, closes back inside |
| Candle size | Large, decisive body | Small body, long wicks |
| Volume | Rising | Flat or falling |
| Trend | With the higher-timeframe trend | Against the higher-timeframe trend |
| Retest | Old level holds | Price falls back into the range |
Breakout Trading Strategy Entry Methods
A breakout trade strategy usually uses one of three entry styles:
- Aggressive entry: Enter as soon as a candle closes beyond the level. You catch the full move but face more false signals.
- Retest entry: Wait for a pullback to the broken level and enter when it holds. This gives better confirmation and often a tighter stop.
- Pending orders: Place a buy-stop above resistance or a sell-stop below support. This is convenient, but more exposed to fakeouts and slippage.
Many traders combine methods, for example taking a partial position on the breakout and adding on the retest.
Stop-Loss Placement in a Breakout Trading Strategy
Good stop placement protects you when a breakout fails. Common options include:
- Inside the range: Place the stop back inside the range, beyond the breakout candle’s low (for longs) or high (for shorts).
- Below the retest low: On a retest entry, place the stop just below the retest swing.
- ATR-based stops: Use a multiple of the Average True Range, such as 1 to 1.5 times ATR, to allow for normal volatility.
Avoid placing stops exactly at the obvious level, because that is where many other stops sit and where liquidity hunts often occur.
Setting Profit Targets
Every breakout trade strategy needs a clear exit plan before the trade is placed.
- Measured move: Project the height of the range or pattern from the breakout point.
- Next key level: Target the next major support or resistance.
- Risk-reward ratio: Aim for at least 1:2.
- Trailing stop: Trail your stop behind swing points to ride strong trends.
Turning False Breakouts Into Opportunities
A failed breakout can itself be a trading signal. When price breaks above resistance, closes back inside the range and then breaks below the breakout candle’s low, trapped buyers may need to exit, pushing price lower. Some traders deliberately trade these “failed breakout” or “fakeout reversal” setups.
The logic is the same as many liquidity-based approaches: a sweep of a key level followed by a sharp reversal suggests the move was a stop hunt. Adding this setup to your breakout trde strategy means you are prepared for both outcomes.
Breakout Trading Strategy: Worked Example
Imagine EUR/USD has been in an uptrend on the 4-hour chart. On the 1-hour chart, it forms a range between 1.1620 and 1.1660 for most of the Asian session.
- At the London open, a strong 1-hour candle closes at 1.1675, well above resistance at 1.1660.
- The trader waits. Over the next two hours, price pulls back to 1.1662, just above the old resistance, and forms a bullish rejection candle.
- The trader buys at 1.1665, with a stop at 1.1645, back inside the range.
- The range height is 40 pips, so the measured-move target is 1.1700 (1.1660 plus 40 pips).
The trade risks 20 pips to make 35, a risk-reward ratio of about 1:1.75. That is slightly below the 1:2 guideline, so a trader might take partial profit at 1.1700 and trail the stop on the rest to capture more if the trend continues.
This example is illustrative and uses hypothetical prices.
Best Timeframes and Markets for a Breakout Trading Strategy
- Intraday: 15-minute and 1-hour charts suit session breakouts such as the London breakout.
- Swing trading: 4-hour and daily charts give fewer but often more reliable breakouts.
- Markets: Breakouts work in forex, indices, commodities and stocks, but each market has its own typical volatility and active hours.
For Indian traders, exchange-traded products such as NSE currency futures, index futures and MCX commodities are legal routes for applying a breakout trde strategy. Leveraged forex trading through offshore CFD platforms is not permitted under FEMA.

Risk Management for Breakout Traders
- Risk a fixed percentage: Many traders risk 0.5–1% per trade.
- Expect losses: Even a good breakout trading strategy will have a series of failed breakouts. Size positions so a losing streak does not hurt your account badly.
- Limit trades per day: Chasing every breakout leads to overtrading.
- Keep a journal: Record which breakouts worked and which failed, and why.
Common Breakout Trading Mistakes
- Entering before a candle closes beyond the level
- Chasing price after a large move has already happened
- Ignoring the higher-timeframe trend
- Trading breakouts of weak or unclear levels
- Placing stops too tight, at obvious levels
- Trading breakouts during major news without a plan
- Giving up after a few fakeouts instead of reviewing the filters
A Breakout Trading Strategy Checklist
- Is the level clear and important?
- Does the breakout agree with the higher-timeframe trend?
- Has a candle closed decisively beyond the level?
- Is momentum or volume supporting the move?
- Is there major news due soon?
- Where is my stop, and is the risk-reward at least 1:2?
- Am I entering on the breakout or waiting for a retest?
If most answers are positive, the setup meets the standards of a disciplined breakout trading strategy.
FAQs
What is a breakout trading strategy?
It is an approach that aims to enter a trade when price moves decisively beyond a key level of support, resistance or a chart pattern, expecting a new trend to follow.
How do I avoid false breakouts?
Wait for a candle close beyond the level, look for strong momentum and volume, trade with the higher-timeframe trend, and consider entering on a retest.
Is it better to enter on the breakout or the retest?
Retest entries usually have better confirmation and tighter stops, but you may miss some fast moves. Breakout entries catch more moves but face more fakeouts.
What timeframe is best for breakout trading?
Intraday traders often use 15-minute and 1-hour charts, while swing traders use 4-hour and daily charts.
Can false breakouts be traded?
Yes. A failed breakout that quickly reverses can signal a move in the opposite direction, as trapped traders exit their positions.
Conclusion
A breakout trading strategy can be one of the most rewarding ways to trade, because it puts you at the start of new trends. But it only works if you respect the risk of false breakouts. Waiting for candle closes, checking momentum and volume, trading with the bigger trend and using retests can filter out many traps.
Combine these filters with clear stop-loss and target rules, consistent risk management and a trading journal. Over time, you will learn which breakouts are worth trading and which are best left alone.