Introduction
Market structure is the foundation of Smart Money Concepts (SMC) trading. Before you can find order blocks, fair value gaps or liquidity, you need to know which way the market is moving and whether that direction is continuing or changing. Two terms sit at the centre of this: Break of Structure (BOS) and Change of Character (CHoCH).
Many new traders mix them up. Both involve price breaking a previous swing point, so they can look similar on a chart. But they tell you very different things. One says the trend is continuing; the other warns that it may be reversing. Understanding BOS vs CHoCH is essential for reading charts correctly and avoiding trades against the real direction of the market.
This guide explains:
- The basics of market structure
- What a BOS is and what a CHoCH is
- The key differences, with tables and examples
- How to confirm each signal
- How to trade them with simple entry models
- Common mistakes and how to avoid them
Market Structure Basics Behind BOS vs CHoCH
Market structure describes the pattern of swing highs and swing lows that price creates.
- Uptrend (bullish structure): Price makes higher highs (HH) and higher lows (HL).
- Downtrend (bearish structure): Price makes lower highs (LH) and lower lows (LL).
- Range: Price moves sideways without clear higher highs or lower lows.
A swing high is a peak with lower highs on either side. A swing low is a trough with higher lows on either side. These swing points are the reference levels for both BOS and CHoCH.
What Is a Break of Structure (BOS)?
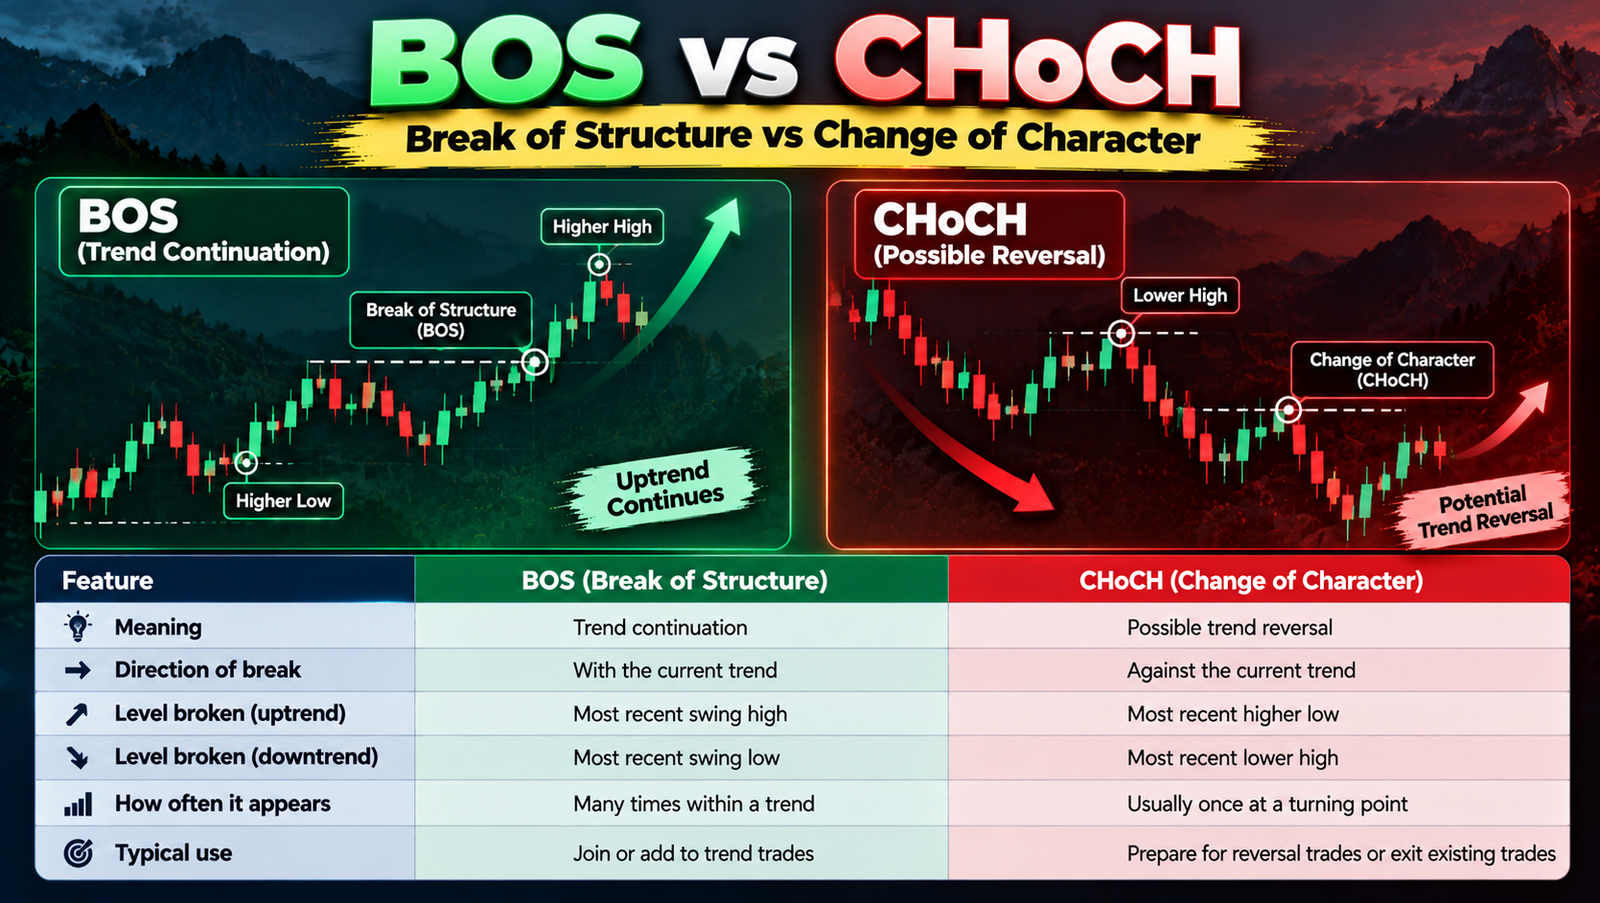
A Break of Structure happens when price breaks a swing point in the direction of the existing trend. It confirms that the trend is continuing.
- Bullish BOS: In an uptrend, price breaks above the most recent swing high, creating a new higher high.
- Bearish BOS: In a downtrend, price breaks below the most recent swing low, creating a new lower low.
Think of a BOS as the market saying, “The trend is still in charge.” Each new BOS in an uptrend shows that buyers are still strong enough to push price to new highs.
What Is a Change of Character (CHoCH)?
A Change of Character happens when price breaks a swing point against the existing trend. It is the first sign that the trend may be reversing.
- Bullish CHoCH: In a downtrend, price breaks above the most recent lower high. Sellers have failed to keep control.
- Bearish CHoCH: In an uptrend, price breaks below the most recent higher low. Buyers have failed to keep control.
A CHoCH is often called a market structure shift (MSS), although some traders use these terms slightly differently. Either way, it signals that the “character” of price action has changed.
BOS vs CHoCH: The Key Differences
| Feature | BOS (Break of Structure) | CHoCH (Change of Character) |
|---|---|---|
| Meaning | Trend continuation | Possible trend reversal |
| Direction of break | With the current trend | Against the current trend |
| Level broken (uptrend) | Most recent swing high | Most recent higher low |
| Level broken (downtrend) | Most recent swing low | Most recent lower high |
| How often it appears | Many times within a trend | Usually once at a turning point |
| Typical use | Join or add to trend trades | Prepare for reversal trades or exit existing trades |
The simplest way to remember the BOS vs CHoCH difference is: BOS breaks with the trend; CHoCH breaks against it.
A Simple Example of BOS vs CHoCH
Imagine EUR/USD in an uptrend on the 1-hour chart:
- Price makes a high at 1.1650, pulls back to a higher low at 1.1620, then breaks above 1.1650 to 1.1680. That break is a bullish BOS.
- Price pulls back to a new higher low at 1.1640, then rallies to 1.1700. Another bullish BOS.
- Price then falls sharply and breaks below 1.1640, the most recent higher low. That is a bearish CHoCH, the first sign the uptrend may be ending.
- If price then forms a lower high and breaks below the next swing low, that is a bearish BOS, confirming the new downtrend.
This sequence of BOS, BOS, CHoCH and then BOS in the new direction is the classic way trends end and new ones begin. Learning to read it in real time is the practical skill behind every BOS vs CHoCH decision: are you seeing the trend continue, or the first crack in it? Asking that question at every swing break will keep you on the right side of the market more often.
This example is illustrative and uses hypothetical prices.
BOS vs CHoCH Confirmation: What Counts as a Break?
One of the biggest debates in BOS vs CHoCH analysis is what counts as a valid break. Common approaches include:
- Candle body close: Many traders require a candle body to close beyond the swing point. A wick alone does not count.
- Displacement: A strong, decisive candle through the level shows real intent. Weak, overlapping candles suggest a possible fake break.
- Wick break: Some traders treat a wick beyond a level as a liquidity sweep rather than a structural break.
Choose one rule and apply it consistently. Mixing rules leads to confusion and inconsistent results.
Liquidity sweep vs genuine break
Price often pokes beyond a swing high or low to trigger stop orders, then reverses. This is a liquidity sweep, not a BOS. If price sweeps a high with a wick and closes back inside, it may actually be setting up a CHoCH in the opposite direction.
BOS vs CHoCH in Internal vs Swing Structure
Structure exists on multiple levels:
- Swing (external) structure: The major highs and lows that define the main trend on your chosen timeframe.
- Internal structure: The smaller highs and lows inside a single swing leg.
An internal CHoCH can appear during a pullback within a larger uptrend. It does not necessarily mean the bigger trend has reversed. Many traders use internal CHoCH as an entry trigger at the end of a pullback, while respecting the swing structure for overall direction.
When studying BOS vs CHoCH, always ask: “Which level of structure am I looking at?”
A Multi-Timeframe View of BOS vs CHoCH
A CHoCH on the 5-minute chart may just be a pullback on the 4-hour chart. A common approach is:
- Higher timeframe (daily or 4-hour): Identify the main trend using swing BOS and CHoCH.
- Intermediate timeframe (1-hour): Find a pullback into a point of interest, such as an order block or fair value gap.
- Lower timeframe (5 or 15 minutes): Look for a CHoCH back in the direction of the higher-timeframe trend as an entry trigger.
This keeps lower-timeframe signals aligned with the bigger picture.
How to Trade BOS
In any BOS vs CHoCH framework, BOS signals are the trend trader’s best friend.
- Confirm the trend on your chosen timeframe with a series of BOS.
- After a new BOS, wait for price to pull back.
- Look for an order block or fair value gap created by the move that caused the BOS.
- Enter when price reacts at that zone, ideally with lower-timeframe confirmation.
- Place the stop beyond the pullback low (for buys) or high (for sells).
- Target the next liquidity level or a new structural high or low.
How to Trade CHoCH
The CHoCH side of BOS vs CHoCH is where reversal traders focus.
- Look for price to reach a higher-timeframe point of interest or sweep liquidity.
- Wait for a CHoCH on a lower timeframe, ideally with strong displacement.
- Mark the order block or fair value gap left by the CHoCH move.
- Enter on a pullback into that zone.
- Place the stop beyond the swing high or low that was swept.
- Target opposing liquidity, such as the previous range high or low.
Because a CHoCH is only the first sign of reversal, many traders wait for a BOS in the new direction before adding to positions.
BOS vs CHoCH: Worked Trade Example
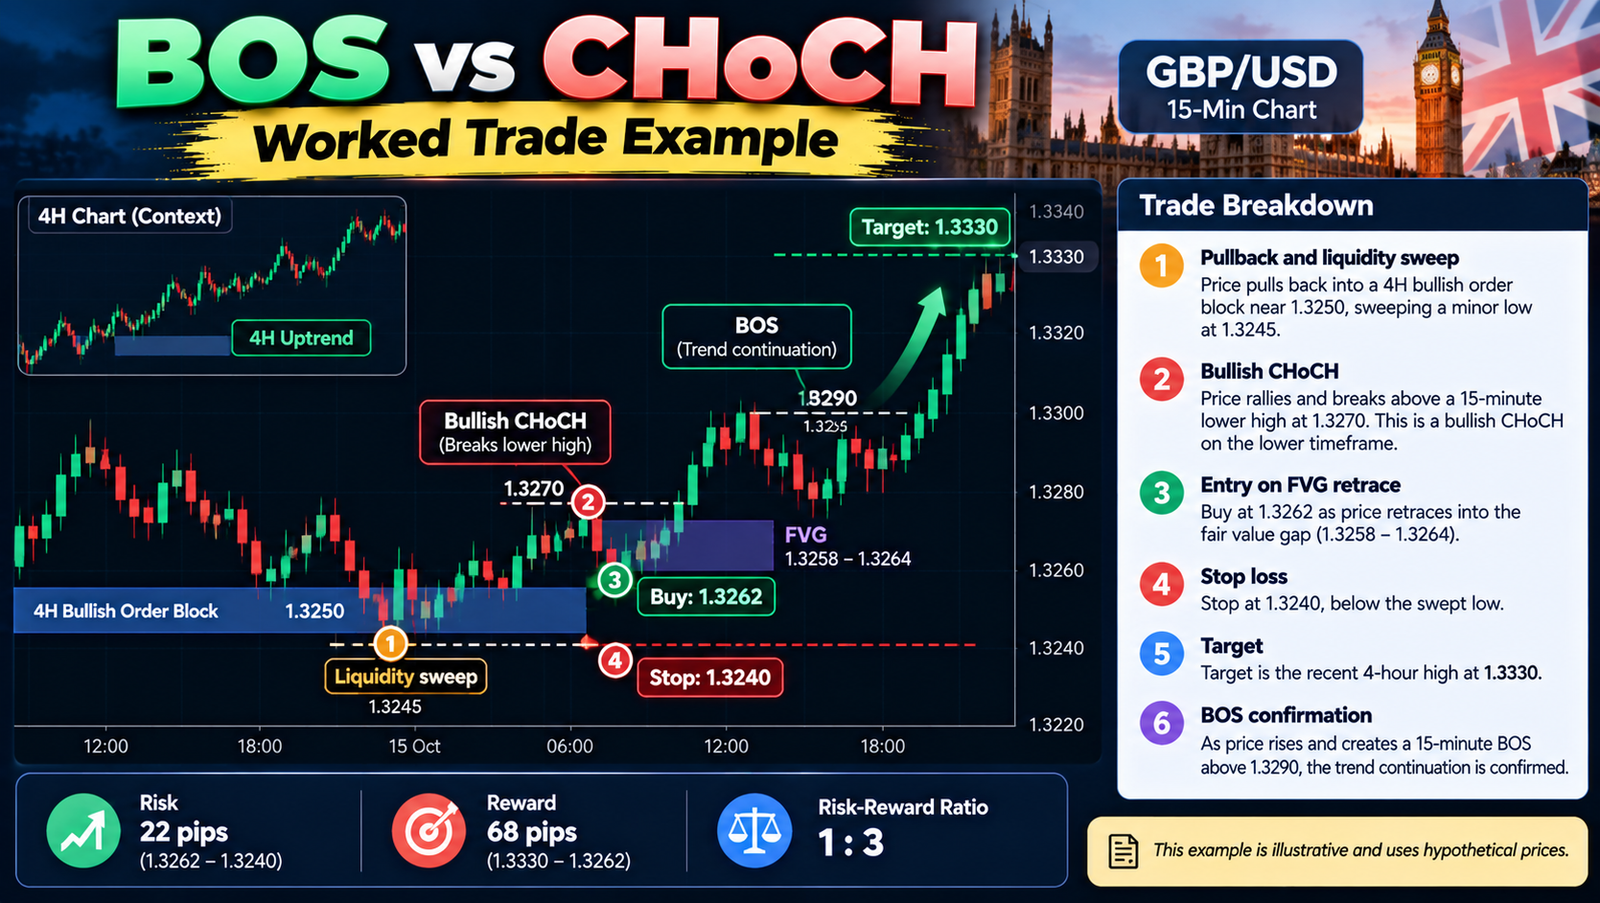
Suppose GBP/USD is in a 4-hour uptrend. On the 15-minute chart, price pulls back into a 4-hour bullish order block near 1.3250, sweeping a minor low at 1.3245.
- Price then rallies strongly and breaks above a 15-minute lower high at 1.3270. This is a bullish CHoCH on the lower timeframe.
- The rally leaves a fair value gap between 1.3258 and 1.3264.
- A trader buys at 1.3262 as price retraces into the gap, with a stop at 1.3240, below the swept low.
- The target is the recent 4-hour high at 1.3330.
The trade risks 22 pips to make 68, a risk-reward ratio of about 1:3. As price rises and creates a 15-minute BOS above 1.3290, the trend continuation is confirmed.
This example is illustrative and uses hypothetical prices.
BOS vs CHoCH: Common Mistakes
- Confusing the two: Labelling a counter-trend break as a BOS, or a with-trend break as a CHoCH.
- Ignoring timeframe context: Treating a lower-timeframe CHoCH as a full reversal of the higher-timeframe trend.
- Counting wicks as breaks: Mistaking liquidity sweeps for structural breaks.
- Marking too many swings: Labelling every small wiggle as structure creates noise.
- Trading every CHoCH: Not every CHoCH leads to a reversal, especially mid-range.
- Entering without a point of interest: Structure breaks work best near key levels, order blocks or liquidity.
- Changing rules: Switching between body-close and wick rules on different trades.
Tips for Mastering BOS vs CHoCH
- Practise on historical charts: Mark swings, BOS and CHoCH on past price action before trading live.
- Keep it simple: Start with one timeframe for structure and one for entries.
- Use clear rules: Write down exactly what counts as a swing and a break.
- Combine with liquidity: The strongest CHoCH setups often follow a liquidity sweep.
- Journal your trades: Record whether each trade was based on a BOS or CHoCH and review the results weekly.
 Applying BOS vs CHoCH in Indian Markets
Market structure concepts apply to any liquid market, including NSE currency futures such as USD/INR, Nifty and Bank Nifty futures, and MCX commodities. USD/INR often moves in narrow ranges, so structure breaks can be small; focus on higher timeframes and clear swings.
Indian residents should trade currencies only through recognised exchanges such as NSE and BSE, via SEBI-registered brokers. Leveraged forex trading through offshore CFD platforms is not permitted under FEMA.
FAQs
What is the main difference in BOS vs CHoCH?
A BOS breaks structure in the direction of the trend and signals continuation. A CHoCH breaks structure against the trend and signals a possible reversal.
Is CHoCH the same as a market structure shift?
Many traders use the terms interchangeably. Some use MSS specifically for a CHoCH accompanied by strong displacement.
Should I use a wick or candle close to confirm a break?
Many traders use a candle body close for confirmation and treat wick breaks as liquidity sweeps. Choose one rule and use it consistently.
Can a CHoCH fail?
Yes. A CHoCH is an early warning, not a guarantee. Many traders wait for a BOS in the new direction for confirmation.
Which timeframe is best for BOS and CHoCH?
Use higher timeframes for overall structure and lower timeframes for entries. Popular combinations are 4-hour with 15-minute, or 1-hour with 5-minute.
Conclusion
Understanding BOS vs CHoCH is one of the most important steps in reading market structure. A BOS shows that the current trend is still in control, while a CHoCH warns that control may be shifting. Used together, they help you join trends at the right time and spot reversals early.
Keep your rules clear, respect higher-timeframe structure, combine signals with liquidity and points of interest, and manage risk carefully. Practise marking structure on historical charts and a demo account until identifying BOS vs CHoCH becomes second nature.