Key Takeaways
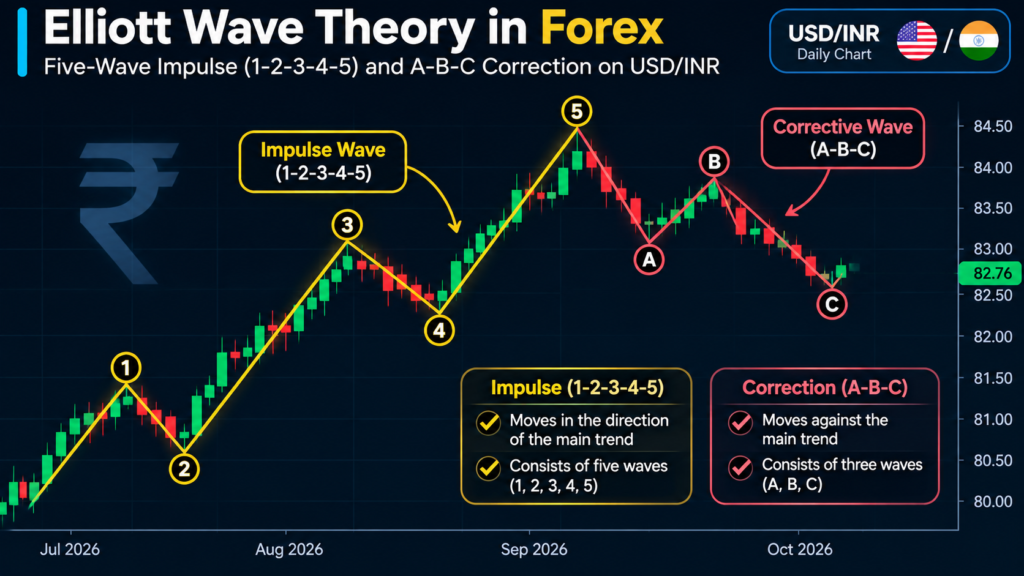
- Elliott wave theory for forex says trends tend to unfold in five waves with the trend and three waves against it.
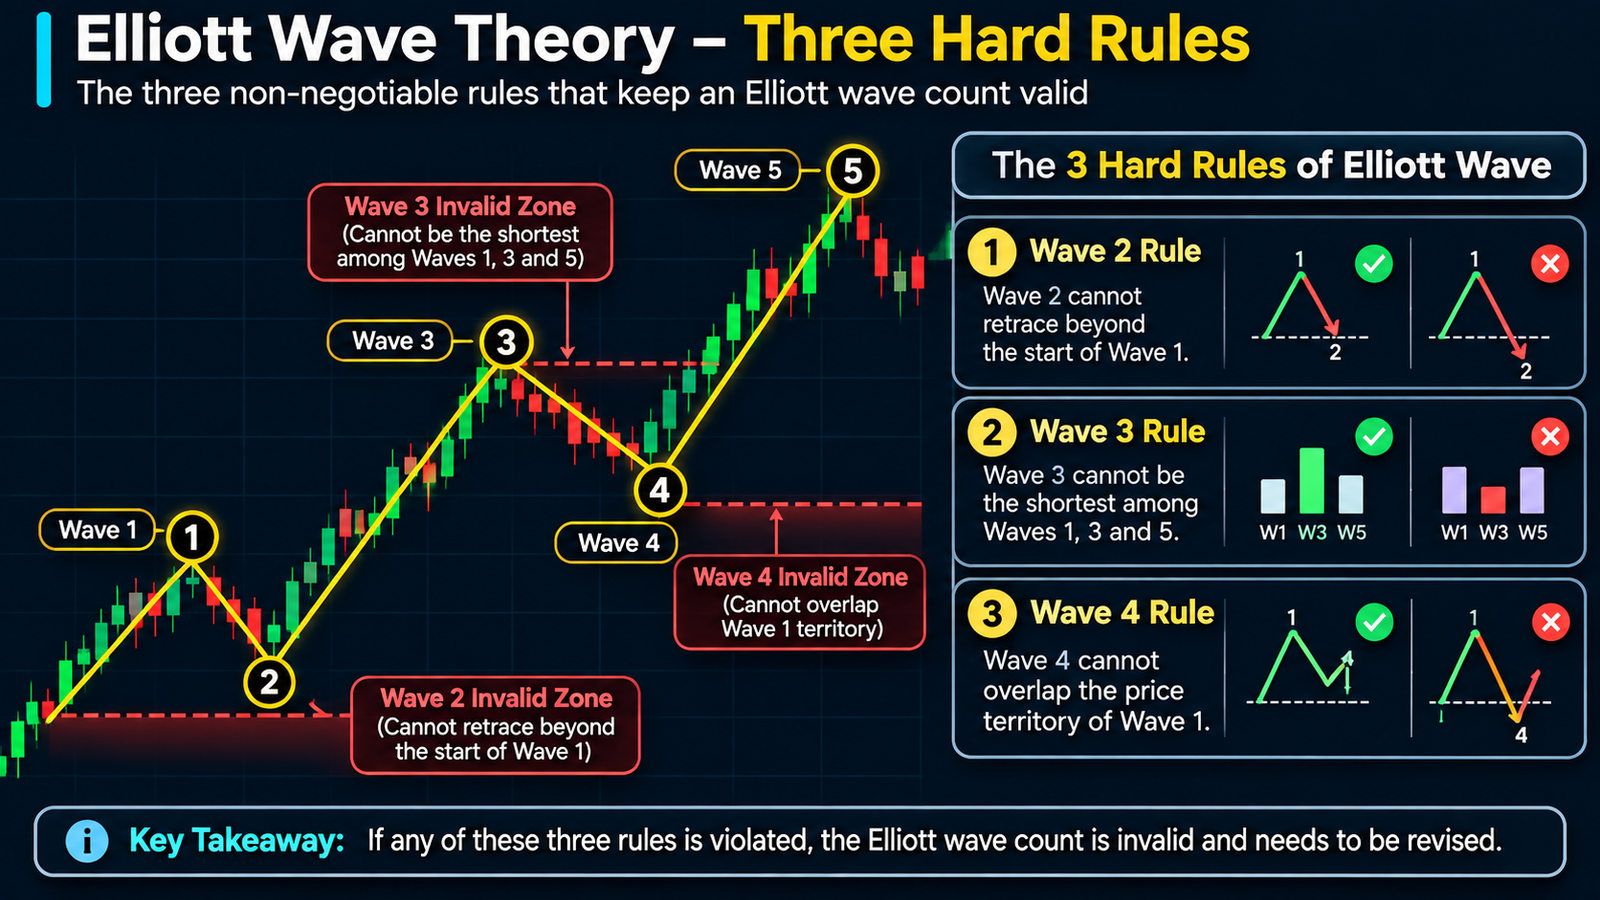
- Only three rules are hard: wave 2 never retraces more than 100% of wave 1, wave 3 is never the shortest impulse wave, and wave 4 does not overlap wave 1.
- Fibonacci ratios such as 61.8% and 161.8% are guidelines for targets, not rules.
- The real value of a wave count is a clear invalidation level, which tells you where your stop belongs.
- On NSE USD/INR futures, a 1 paisa move equals ₹10 per lot, so wave-based stops convert neatly into rupee risk.
Most chart readers can spot a trend. Fewer can say where it may pause, where it may resume and at what price their reading is simply wrong. Elliott wave theory for forex tries to answer all three by labelling price swings as a repeating sequence of waves. It is not a crystal ball, and counts get revised often. Used properly, it gives you a map of the trend and a hard line that cancels the map. This guide covers the rules, the guidelines, the main corrective patterns and a hypothetical wave count on NSE USD/INR futures with rupee risk per lot.
What is Elliott wave theory for forex?
Elliott wave theory is a method of technical analysis that describes market prices as moving in a repeating 5-3 pattern: five waves in the direction of the main trend, followed by three corrective waves. Forex traders use it to map trend phases, project targets and set stops.
The idea comes from Ralph Nelson Elliott (1871–1948), an American accountant who studied stock market price data in the 1930s and published The Wave Principle in 1938. His work was later popularised by A.J. Frost and Robert Prechter in their 1978 book Elliott Wave Principle.
Because the same pattern repeats at small and large scales, it is described as fractal: a five-wave move on an hourly chart can be just wave 1 of a larger daily move.
Wave degrees in plain terms
A wave degree is the relative size of a wave within the larger structure. Names run from Grand Supercycle down to Subminuette; keep degrees consistent, or you will mix a small wiggle with a major turn.
Impulse and corrective waves: how the 5-3 structure works
An impulse wave is a five-wave move (labelled 1, 2, 3, 4, 5) that makes net progress in the direction of the larger trend. Waves 2 and 4 are pullbacks inside it.
A corrective wave is a move against the larger trend, usually labelled A, B, C. Elliott Wave International calls one point “the single most important rule” of corrections: corrections are never fives. Only motive waves subdivide into five.
Traders often describe wave 3 as the leg where the trend becomes obvious, and wave 5 as a final push where volume is often lower and momentum indicators frequently diverge.
The Elliott count sits on top of ordinary swing analysis; our guide to market structure trading explains the swing logic that makes wave labelling easier.
What are the three Elliott wave rules that cannot be broken?
There are only three Elliott wave rules for an impulse. Break one, and the count must be relabelled.
- Wave 2 never retraces more than 100% of wave 1. If price falls below the start of wave 1 in an uptrend, it was not wave 2.
- Wave 3 is never the shortest of waves 1, 3 and 5.
- Wave 4 does not enter the price territory of wave 1 in a standard impulse. In an uptrend, the wave 4 low must stay above the wave 1 high.
Everything else is a guideline. The rules give you objective invalidation points, which is where stop-losses belong.
Elliott wave Fibonacci guidelines (not rules)
Fibonacci ratios come from the Fibonacci sequence (1, 2, 3, 5, 8, 13…) and the golden ratio of about 1.618. Practitioners use them to estimate how far waves may travel, as tendencies rather than certainties.
| Wave | Common Fibonacci guideline | Hard rule? |
|---|---|---|
| Wave 2 | Often retraces a large share of wave 1, typically no more than 61.8% | No |
| Wave 3 | Often extends to about 161.8% of wave 1 | No |
| Wave 4 | Typically retraces less than 38.2% of wave 3 | No |
| Wave 5 | Often weaker than wave 3, with momentum divergence | No |
The 38.2%, 50% and 61.8% retracement levels are standard across technical analysis; CME Group’s lesson on Fibonacci retracements and extensions describes them as shallow, medium and deeper pullbacks. For drawing these levels correctly on a chart, see our Fibonacci retracement guide.
When wave 2 ends near 50–61.8% of wave 1 and price then breaks the wave 1 high, traders often take that as a sign the count is on track.
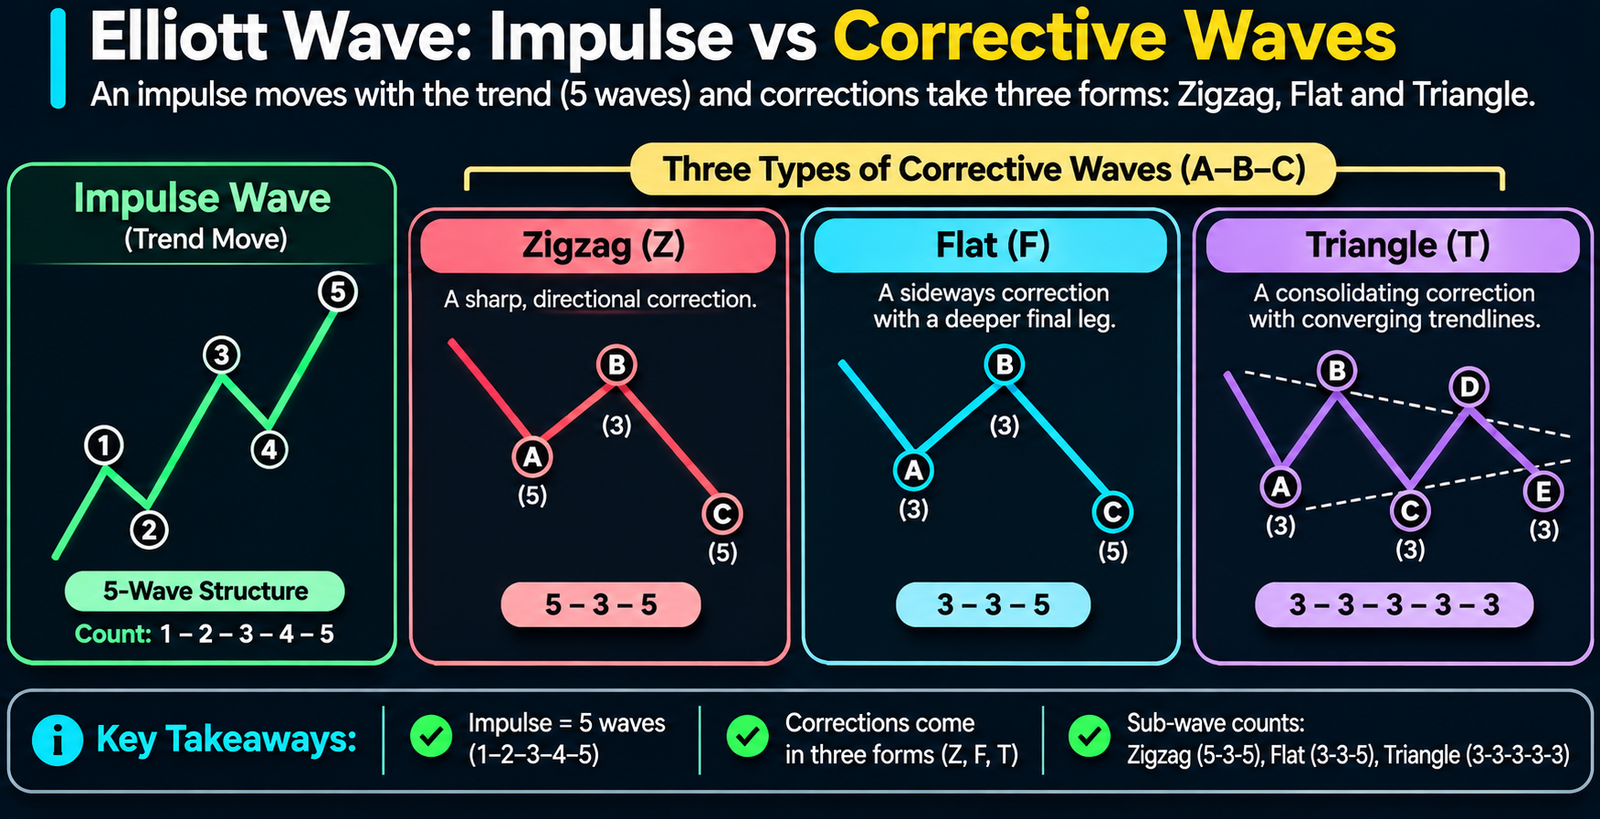
Corrective patterns: zigzag, flat and triangle
Corrections are harder to trade than impulses: they come in more shapes, combine into double and triple threes, and end less predictably.
| Pattern | Sub-wave structure | What it looks like |
|---|---|---|
| Zigzag | 5-3-5 | A sharp, steep move against the trend |
| Flat | 3-3-5 | A sideways correction that often returns near its starting level |
| Triangle | 3-3-3-3-3 | Five overlapping legs (A to E) that contract, then a thrust out |
Zigzag
A zigzag is a sharp correction labelled A-B-C, where A and C each subdivide into five and B into three. It can appear as a single, double or triple zigzag.
Flat
A flat is a sideways correction whose wave A has only three sub-waves. Variants include regular, expanded and running flats.
Triangle
A triangle is a correction of five three-wave legs, typically resolving with a thrust out of the pattern. Types include contracting, barrier and expanding. Their breakout logic overlaps with the triangles in our forex chart patterns guide.
How to count Elliott waves on a forex chart
A methodical process stops you forcing a count onto a chart that does not fit.
- Start on a higher timeframe. Use weekly or daily charts to find the dominant trend.
- Mark the obvious swing highs and lows. Label only clear turning points.
- Find the strongest leg. That leg is often wave 3. Work backwards and forwards from it.
- Test the three hard rules. If any rule fails, relabel.
- Check Fibonacci guidelines. Compare retracements and wave 3 length with common ratios.
- Prepare an alternate count. Keep a second scenario ready.
- Define the invalidation price. Note the exact level where the primary count fails.
- Drop to a lower timeframe for entry. A small five-wave move in your direction confirms the larger count.
Wave counting USD/INR: a hypothetical NSE futures example
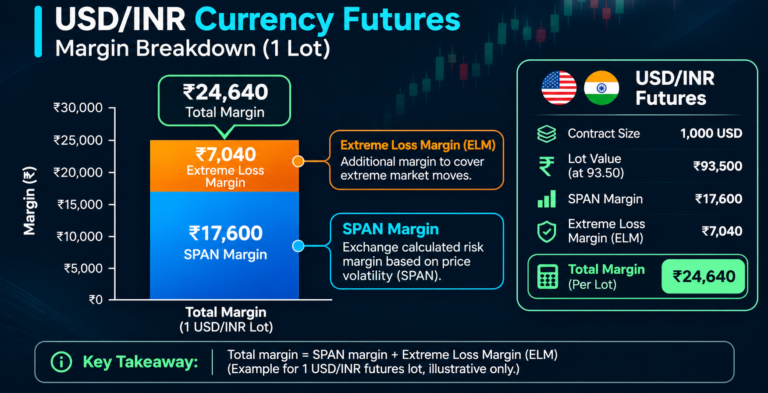
Indian residents can apply wave analysis to USD/INR futures on NSE through a SEBI-registered broker. According to NSE’s contract specifications, one USD/INR futures lot is US$1,000, the tick size is ₹0.0025 (0.25 paise), and contracts are cash-settled in rupees. So a 1 paisa (₹0.01) move equals ₹10 per lot. New to the contract? Read our guide on how to trade USD/INR on NSE.
Example (hypothetical): a trader with ₹1,00,000 in trading capital is studying a USD/INR daily chart. All price levels below are hypothetical.
- Wave 1 rises from 94.00 to 94.80 (80 paise).
- Wave 2 pulls back to 94.35, a retracement of about 56% of wave 1.
- Rule check: wave 2 has not fallen below 94.00, so the count is still valid.
Planning the trade (hypothetical):
| Item | Level / value |
|---|---|
| Entry (after a small five-wave rise off 94.35) | 94.45 |
| Invalidation (start of wave 1) | 94.00 |
| Stop-loss (just below invalidation) | 93.98 |
| Risk per lot | 47 paise × ₹10 = ₹470 |
| Risk budget (1% of ₹1,00,000) | ₹1,000 |
| Lots | 2 (₹940 total risk) |
| Wave 3 target (161.8% of 80 paise from 94.35) | about 95.64 |
| Potential gain per lot | 119 paise × ₹10 = ₹1,190 |
The projection is 0.80 × 1.618 ≈ 1.29 rupees added to 94.35, giving reward-to-risk of roughly 2.5 to 1. Because 161.8% is only a guideline, the trader might book part early and trail the rest.
Later, the wave 4 rule takes over: any wave 4 decline must stay above 94.80, the wave 1 high. A trade below that level breaks the count, and a careful trader exits or relabels rather than hopes.
When the logical stop looks too tight for normal daily noise, check it against volatility with our ATR stop loss tool, then size the trade so the rupee risk stays fixed. Remember that margin, brokerage and exchange charges also apply and are not included in this hypothetical.
Common mistakes traders make with Elliott waves
Critics argue Elliott analysis is too subjective because practitioners cannot consistently agree where waves begin and end. Keep that in mind.
- Forcing a count. If you need to squint, there probably is no tradable count.
- Treating guidelines as rules. Wave 3 does not have to reach 161.8%. Wave 2 can retrace deeper than 61.8%. Only the three hard rules are fixed.
- Ignoring invalidation. Exit when the count fails instead of moving the stop.
- Mixing wave degrees. Calling a four-hour wiggle the end of a daily wave leads to early, wrong reversal trades.
- Trading every correction. Many traders wait for the next impulse rather than guessing where a flat or triangle ends.
- Using it alone. Wave counts work better alongside support and resistance, momentum indicators and the economic calendar, especially around RBI policy and US data releases.
FAQs
Does Elliott wave theory work in forex?
Elliott wave theory can be applied to forex because currency prices move in trending and corrective swings like other markets. It does not predict prices with certainty, and counts often need revision. Traders find it most useful for organising price action, projecting Fibonacci targets and setting clear invalidation levels that define where a trade idea has failed.
What are the three main Elliott wave rules?
The three hard rules are: wave 2 never retraces more than 100% of wave 1; wave 3 is never the shortest of waves 1, 3 and 5; and wave 4 does not enter the price territory of wave 1 in a standard impulse. Breaking any one of these means the wave count is wrong and must be relabelled.
What is the difference between impulse and corrective waves?
Impulse waves move with the larger trend and subdivide into five waves, labelled 1 to 5. Corrective waves move against the trend and are usually labelled A, B, C, made of three-wave or mixed structures. A key principle is that corrections are never fives; only motive waves have five sub-waves.
Which Fibonacci levels are used with Elliott waves?
Common Elliott wave Fibonacci guidelines include wave 2 retracing up to 61.8% of wave 1, wave 3 extending to about 161.8% of wave 1, and wave 4 typically retracing less than 38.2% of wave 3. These are tendencies rather than rules, so traders use them as target zones alongside other confirmation.
Can I use Elliott waves on USD/INR futures in India?
Yes. Indian residents can apply wave counting to USD/INR futures traded on NSE through SEBI-registered brokers. One lot is US$1,000 and the tick size is ₹0.0025, so a 1 paisa move equals ₹10 per lot. This makes it straightforward to convert a wave invalidation level into rupee risk per lot.
Which timeframe is best for Elliott wave counting?
Start with weekly and daily charts to find the main trend and the clearest waves, because higher timeframes contain less noise. Then use four-hour or hourly charts to refine entries. The fractal nature of waves means patterns appear on every timeframe, but keeping wave degrees consistent across charts is essential to avoid mislabelling.
Conclusion
Elliott wave theory for forex is best seen as a framework, not a forecasting machine. The five-wave impulse and three-wave correction give you a map of the trend, Fibonacci guidelines suggest where waves may end, and the three hard rules tell you precisely when that map is wrong. On NSE USD/INR futures, where 1 paisa equals ₹10 per lot, that invalidation level turns directly into a rupee stop. Count patiently, keep an alternate scenario and never let a favourite count override risk control. Before your next trade, run your stop distance through the position size calculator so each wave idea risks only what you planned.